

Key Insights
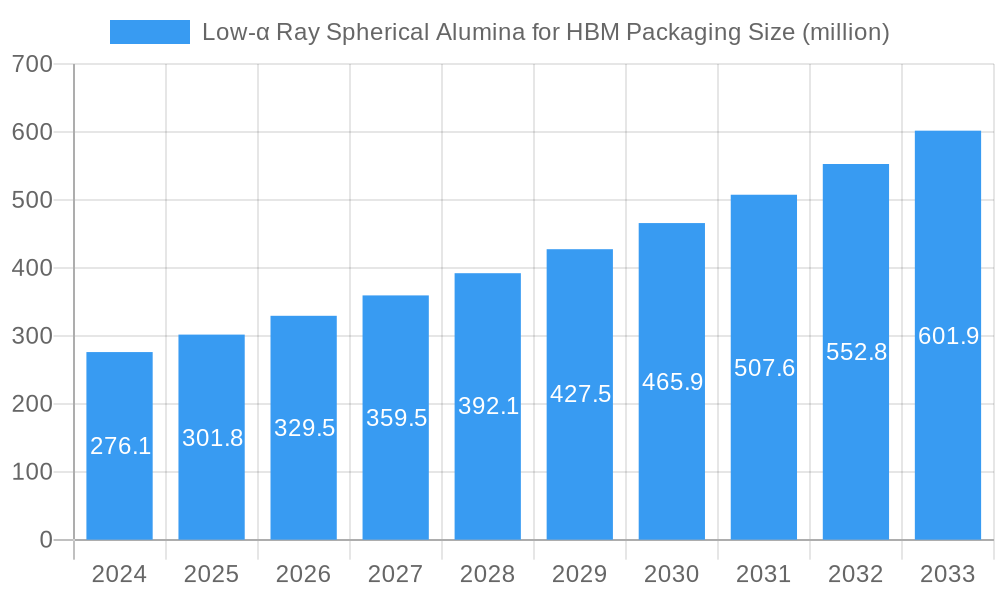
The Low-α Ray Spherical Alumina for HBM Packaging market is poised for significant expansion, driven by the burgeoning demand for high-performance computing and advanced semiconductor solutions. In 2024, the market size stands at an estimated $276.1 million, with projections indicating a robust compound annual growth rate (CAGR) of 9.4% through 2033. This accelerated growth is primarily fueled by the increasing adoption of High Bandwidth Memory (HBM) technologies, particularly HBM2, HBM2E, and the rapidly emerging HBM3. These memory solutions are critical for applications requiring immense data processing capabilities, such as artificial intelligence, machine learning, high-performance computing, and advanced gaming. The superior thermal management and dielectric properties of low-α ray spherical alumina make it an indispensable material for ensuring the reliability and performance of these sophisticated HBM packages, directly translating into market demand.
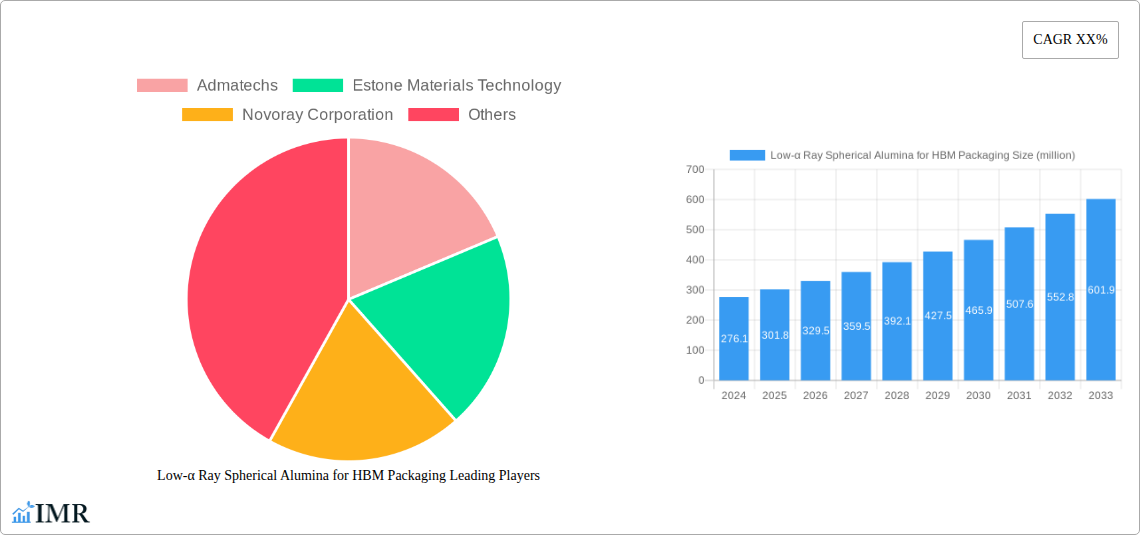
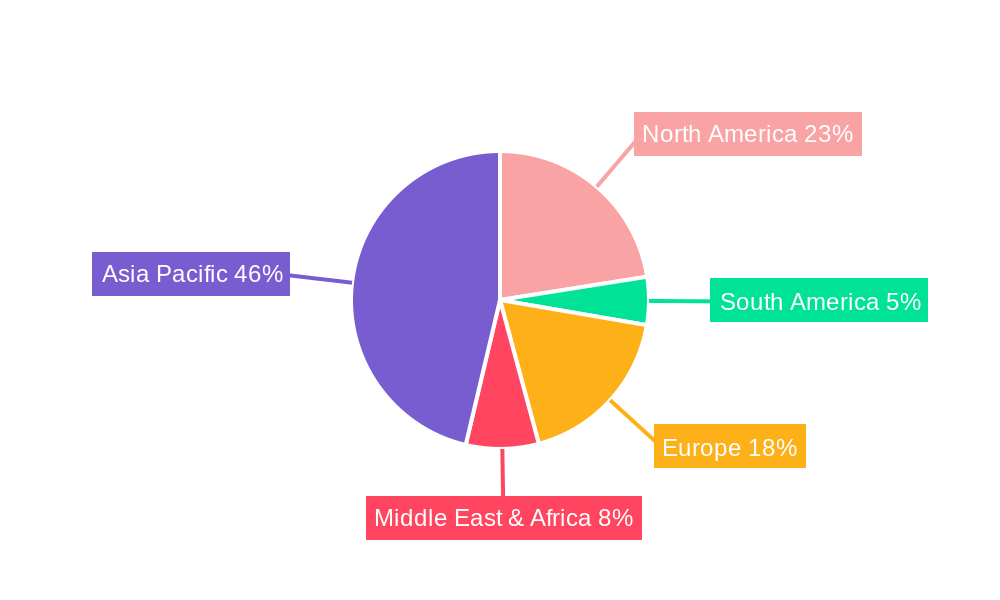
Low-α Ray Spherical Alumina for HBM Packaging Market Size (In Million)
Further analysis reveals that the market is segmented by particle size, with both ≤1μm and >1μm categories catering to specific manufacturing nuances and performance requirements in HBM packaging. The application segment is dominated by HBM2 and HBM2E, with HBM3 expected to witness substantial growth as it becomes more widely adopted. Leading companies like Admatechs, Estone Materials Technology, and Novoray Corporation are at the forefront of innovation, investing in research and development to enhance material purity, particle morphology, and alpha emission reduction. Geographically, the Asia Pacific region, led by China and South Korea, is anticipated to be a major growth engine due to its strong presence in semiconductor manufacturing. North America and Europe also represent significant markets, driven by their advanced research institutions and high-tech industries.
Low-α Ray Spherical Alumina for HBM Packaging Company Market Share
This in-depth report provides a definitive market analysis of Low-α Ray Spherical Alumina for High Bandwidth Memory (HBM) packaging. Leveraging critical industry insights and meticulously gathered data, this study offers unparalleled visibility into market dynamics, growth trajectories, and key player strategies. This report is vital for manufacturers, suppliers, investors, and R&D professionals seeking to capitalize on the rapidly expanding HBM market and its core material requirements.
Low-α Ray Spherical Alumina for HBM Packaging Market Dynamics & Structure
The Low-α Ray Spherical Alumina market for HBM packaging is characterized by a moderately concentrated structure, with Admatechs and Estone Materials Technology holding significant sway. Technological innovation is primarily driven by the relentless demand for higher performance, lower power consumption, and enhanced reliability in advanced semiconductor packaging, particularly for HBM applications. Regulatory frameworks, though nascent in this specialized material sector, are increasingly focusing on material safety and environmental impact. Competitive product substitutes, while limited in direct low-alpha performance, include other filler materials and advanced composite solutions. End-user demographics are dominated by leading semiconductor manufacturers and integrated device manufacturers (IDMs) pushing the boundaries of memory technology. Mergers and acquisitions (M&A) activity, while not pervasive, is anticipated to increase as key players seek to secure supply chains and technological advantages.
- Market Concentration: Moderate, with key players Admatechs and Estone Materials Technology leading.
- Innovation Drivers: Demand for higher HBM speeds, reduced latency, and improved thermal management.
- Regulatory Landscape: Evolving, with a focus on material safety and environmental compliance.
- Competitive Substitutes: Other specialized filler materials and advanced polymer composites.
- End-User Demographics: Semiconductor giants and IDMs driving HBM advancements.
- M&A Trends: Expected to rise as companies seek vertical integration and technological edge.
Low-α Ray Spherical Alumina for HBM Packaging Growth Trends & Insights
The global Low-α Ray Spherical Alumina for HBM Packaging market is poised for substantial expansion, projecting a Compound Annual Growth Rate (CAGR) of XX% from 2025 to 2033. This robust growth is fueled by the escalating demand for higher bandwidth memory solutions across various high-performance computing applications. The market size is estimated to reach $XX million in 2025, with an anticipated surge to $XX million by 2033. Adoption rates for low-alpha ray spherical alumina are directly correlated with the increasing adoption of HBM technologies, particularly in data centers, AI accelerators, and high-end consumer electronics. Technological disruptions, such as advancements in particle engineering for improved dielectric properties and enhanced alpha particle shielding, are critical in shaping the market's trajectory. Consumer behavior shifts, characterized by an insatiable appetite for faster data processing and more immersive digital experiences, are indirectly driving the demand for advanced memory solutions and, consequently, their essential materials. The market penetration of low-alpha ray spherical alumina is expected to deepen as its benefits in mitigating soft errors and ensuring data integrity become more widely recognized and demanded by semiconductor manufacturers.
Dominant Regions, Countries, or Segments in Low-α Ray Spherical Alumina for HBM Packaging
Asia-Pacific, particularly Taiwan and South Korea, is emerging as the dominant region in the Low-α Ray Spherical Alumina for HBM Packaging market. This dominance is primarily driven by the concentration of leading semiconductor foundries and HBM manufacturers in these countries, which are at the forefront of HBM2, HBM2E, and the rapidly advancing HBM3 technologies. The application segment of HBM3 is expected to witness the most significant growth, driven by its superior performance capabilities and increasing adoption in next-generation AI and HPC systems. Within the Types segment, Particle Size: ≤1μm is projected to lead due to its ability to facilitate finer pitch interconnects and denser packaging, crucial for advanced HBM architectures.
- Dominant Region: Asia-Pacific (Taiwan, South Korea)
- Key Application Segment Driver: HBM3, fueled by AI and HPC advancements.
- Dominant Particle Size Segment: Particle Size: ≤1μm, critical for high-density packaging.
- Underlying Growth Drivers in Dominant Regions:
- Economic Policies: Government support for the semiconductor industry and R&D.
- Infrastructure: Advanced manufacturing facilities and robust supply chains.
- Technological Expertise: A highly skilled workforce in semiconductor fabrication.
- Market Demand: Proximity to major HBM consumers and manufacturers.
- Growth Potential Analysis: The HBM3 segment and ≤1μm particle size represent substantial growth opportunities due to their alignment with future HBM technology roadmaps.
Low-α Ray Spherical Alumina for HBM Packaging Product Landscape
The product landscape for Low-α Ray Spherical Alumina is defined by continuous innovation aimed at enhancing alpha particle shielding and improving material properties for advanced HBM packaging. Manufacturers are focusing on achieving ultra-high purity and precisely controlled particle size distributions, particularly below 1μm, to meet the stringent requirements of next-generation HBM interconnects. These spherical alumina materials offer superior dielectric properties, excellent thermal conductivity, and minimal ionic contamination, all critical for ensuring the reliability and performance of HBM stacks. Unique selling propositions revolve around achieving industry-leading low alpha emission rates, contributing to the mitigation of soft errors and enhanced data integrity in high-speed memory modules.
Key Drivers, Barriers & Challenges in Low-α Ray Spherical Alumina for HBM Packaging
Key Drivers:
- Escalating HBM Demand: The relentless growth in high-performance computing, AI, and data analytics is a primary catalyst.
- Technological Advancements in HBM: The continuous evolution of HBM standards (HBM2, HBM2E, HBM3) necessitates advanced materials for improved performance and reliability.
- Need for Soft Error Mitigation: Low alpha emission is crucial for preventing bit flips and ensuring data integrity in sensitive memory applications.
- Miniaturization Trends: The drive for smaller and more powerful electronic devices requires materials that can support denser packaging.
Barriers & Challenges:
- High Purity and Manufacturing Complexity: Achieving ultra-high purity and consistent spherical morphology requires sophisticated and costly manufacturing processes.
- Supply Chain Volatility: Dependence on specialized raw materials and the concentrated nature of manufacturing can lead to supply chain disruptions.
- Cost Sensitivity: While performance is paramount, cost remains a consideration for mass adoption, especially in competitive markets.
- Stringent Quality Control: Ensuring extremely low alpha emission rates requires rigorous testing and quality assurance protocols, adding to production costs.
Emerging Opportunities in Low-α Ray Spherical Alumina for HBM Packaging
Emerging opportunities lie in the expansion of HBM adoption into new application domains such as advanced driver-assistance systems (ADAS) and the metaverse, which will require significant advancements in memory bandwidth and reliability. The development of customized low-alpha ray spherical alumina grades with tailored properties, such as enhanced thermal dissipation or specific dielectric constants, presents a significant untapped market. Furthermore, exploring novel integration techniques and composite materials incorporating spherical alumina for next-generation packaging technologies beyond traditional HBM will unlock new revenue streams. The growing emphasis on end-to-end memory solution reliability will also drive demand for these specialized materials.
Growth Accelerators in the Low-α Ray Spherical Alumina for HBM Packaging Industry
Long-term growth will be significantly accelerated by ongoing breakthroughs in materials science that enable even lower alpha emission rates and enhanced thermal management capabilities. Strategic partnerships between alumina manufacturers and leading HBM developers will foster co-innovation and ensure material readiness for future memory generations. Market expansion into emerging geographical regions with burgeoning semiconductor manufacturing capabilities will also play a crucial role. Furthermore, the development of more efficient and cost-effective manufacturing processes for high-purity spherical alumina will broaden its accessibility and adoption across a wider range of HBM applications.
Key Players Shaping the Low-α Ray Spherical Alumina for HBM Packaging Market
- Admatechs
- Estone Materials Technology
- Novoray Corporation
Notable Milestones in Low-α Ray Spherical Alumina for HBM Packaging Sector
- 2019: Increased demand for HBM2E begins to drive material R&D for enhanced reliability.
- 2020: Development of sub-micron spherical alumina with ultra-low alpha emission rates by key players.
- 2021: Growing awareness of soft error impact in high-performance memory drives material adoption.
- 2022: Advancements in particle coating technologies to further reduce alpha particle generation.
- 2023: Significant investment in production capacity for high-purity spherical alumina by leading manufacturers.
- 2024: Initial qualification of low-alpha ray spherical alumina for emerging HBM3 applications.
In-Depth Low-α Ray Spherical Alumina for HBM Packaging Market Outlook
The future of the Low-α Ray Spherical Alumina for HBM Packaging market is exceptionally promising, propelled by the relentless innovation in high-bandwidth memory and advanced semiconductor packaging. Key growth accelerators, including advancements in materials science leading to ultra-low alpha emission and superior thermal properties, will ensure its integral role in future memory architectures. Strategic collaborations between material suppliers and leading semiconductor manufacturers will foster a synergistic approach to meeting the evolving demands of HBM technology. The market is set to witness a significant expansion as HBM becomes indispensable across an ever-wider array of cutting-edge applications. Investors and industry stakeholders are advised to focus on companies demonstrating a strong commitment to R&D and supply chain robustness.
Low-α Ray Spherical Alumina for HBM Packaging Segmentation
-
1. Application
- 1.1. HBM2 and HBM2E
- 1.2. HBM3
- 1.3. Other
-
2. Types
- 2.1. Particle Size:≤1μm
- 2.2. Particle Size:>1μm
Low-α Ray Spherical Alumina for HBM Packaging Segmentation By Geography
-
1. North America
- 1.1. United States
- 1.2. Canada
- 1.3. Mexico
-
2. South America
- 2.1. Brazil
- 2.2. Argentina
- 2.3. Rest of South America
-
3. Europe
- 3.1. United Kingdom
- 3.2. Germany
- 3.3. France
- 3.4. Italy
- 3.5. Spain
- 3.6. Russia
- 3.7. Benelux
- 3.8. Nordics
- 3.9. Rest of Europe
-
4. Middle East & Africa
- 4.1. Turkey
- 4.2. Israel
- 4.3. GCC
- 4.4. North Africa
- 4.5. South Africa
- 4.6. Rest of Middle East & Africa
-
5. Asia Pacific
- 5.1. China
- 5.2. India
- 5.3. Japan
- 5.4. South Korea
- 5.5. ASEAN
- 5.6. Oceania
- 5.7. Rest of Asia Pacific
Low-α Ray Spherical Alumina for HBM Packaging Regional Market Share
Geographic Coverage of Low-α Ray Spherical Alumina for HBM Packaging
Low-α Ray Spherical Alumina for HBM Packaging REPORT HIGHLIGHTS
| Aspects | Details |
|---|---|
| Study Period | 2020-2034 |
| Base Year | 2025 |
| Estimated Year | 2026 |
| Forecast Period | 2026-2034 |
| Historical Period | 2020-2025 |
| Growth Rate | CAGR of 9.4% from 2020-2034 |
| Segmentation |
|
Table of Contents
- 1. Introduction
- 1.1. Research Scope
- 1.2. Market Segmentation
- 1.3. Research Methodology
- 1.4. Definitions and Assumptions
- 2. Executive Summary
- 2.1. Introduction
- 3. Market Dynamics
- 3.1. Introduction
- 3.2. Market Drivers
- 3.3. Market Restrains
- 3.4. Market Trends
- 4. Market Factor Analysis
- 4.1. Porters Five Forces
- 4.2. Supply/Value Chain
- 4.3. PESTEL analysis
- 4.4. Market Entropy
- 4.5. Patent/Trademark Analysis
- 5. Global Low-α Ray Spherical Alumina for HBM Packaging Analysis, Insights and Forecast, 2020-2032
- 5.1. Market Analysis, Insights and Forecast - by Application
- 5.1.1. HBM2 and HBM2E
- 5.1.2. HBM3
- 5.1.3. Other
- 5.2. Market Analysis, Insights and Forecast - by Types
- 5.2.1. Particle Size:≤1μm
- 5.2.2. Particle Size:>1μm
- 5.3. Market Analysis, Insights and Forecast - by Region
- 5.3.1. North America
- 5.3.2. South America
- 5.3.3. Europe
- 5.3.4. Middle East & Africa
- 5.3.5. Asia Pacific
- 5.1. Market Analysis, Insights and Forecast - by Application
- 6. North America Low-α Ray Spherical Alumina for HBM Packaging Analysis, Insights and Forecast, 2020-2032
- 6.1. Market Analysis, Insights and Forecast - by Application
- 6.1.1. HBM2 and HBM2E
- 6.1.2. HBM3
- 6.1.3. Other
- 6.2. Market Analysis, Insights and Forecast - by Types
- 6.2.1. Particle Size:≤1μm
- 6.2.2. Particle Size:>1μm
- 6.1. Market Analysis, Insights and Forecast - by Application
- 7. South America Low-α Ray Spherical Alumina for HBM Packaging Analysis, Insights and Forecast, 2020-2032
- 7.1. Market Analysis, Insights and Forecast - by Application
- 7.1.1. HBM2 and HBM2E
- 7.1.2. HBM3
- 7.1.3. Other
- 7.2. Market Analysis, Insights and Forecast - by Types
- 7.2.1. Particle Size:≤1μm
- 7.2.2. Particle Size:>1μm
- 7.1. Market Analysis, Insights and Forecast - by Application
- 8. Europe Low-α Ray Spherical Alumina for HBM Packaging Analysis, Insights and Forecast, 2020-2032
- 8.1. Market Analysis, Insights and Forecast - by Application
- 8.1.1. HBM2 and HBM2E
- 8.1.2. HBM3
- 8.1.3. Other
- 8.2. Market Analysis, Insights and Forecast - by Types
- 8.2.1. Particle Size:≤1μm
- 8.2.2. Particle Size:>1μm
- 8.1. Market Analysis, Insights and Forecast - by Application
- 9. Middle East & Africa Low-α Ray Spherical Alumina for HBM Packaging Analysis, Insights and Forecast, 2020-2032
- 9.1. Market Analysis, Insights and Forecast - by Application
- 9.1.1. HBM2 and HBM2E
- 9.1.2. HBM3
- 9.1.3. Other
- 9.2. Market Analysis, Insights and Forecast - by Types
- 9.2.1. Particle Size:≤1μm
- 9.2.2. Particle Size:>1μm
- 9.1. Market Analysis, Insights and Forecast - by Application
- 10. Asia Pacific Low-α Ray Spherical Alumina for HBM Packaging Analysis, Insights and Forecast, 2020-2032
- 10.1. Market Analysis, Insights and Forecast - by Application
- 10.1.1. HBM2 and HBM2E
- 10.1.2. HBM3
- 10.1.3. Other
- 10.2. Market Analysis, Insights and Forecast - by Types
- 10.2.1. Particle Size:≤1μm
- 10.2.2. Particle Size:>1μm
- 10.1. Market Analysis, Insights and Forecast - by Application
- 11. Competitive Analysis
- 11.1. Global Market Share Analysis 2025
- 11.2. Company Profiles
- 11.2.1 Admatechs
- 11.2.1.1. Overview
- 11.2.1.2. Products
- 11.2.1.3. SWOT Analysis
- 11.2.1.4. Recent Developments
- 11.2.1.5. Financials (Based on Availability)
- 11.2.2 Estone Materials Technology
- 11.2.2.1. Overview
- 11.2.2.2. Products
- 11.2.2.3. SWOT Analysis
- 11.2.2.4. Recent Developments
- 11.2.2.5. Financials (Based on Availability)
- 11.2.3 Novoray Corporation
- 11.2.3.1. Overview
- 11.2.3.2. Products
- 11.2.3.3. SWOT Analysis
- 11.2.3.4. Recent Developments
- 11.2.3.5. Financials (Based on Availability)
- 11.2.1 Admatechs
List of Figures
- Figure 1: Global Low-α Ray Spherical Alumina for HBM Packaging Revenue Breakdown (undefined, %) by Region 2025 & 2033
- Figure 2: Global Low-α Ray Spherical Alumina for HBM Packaging Volume Breakdown (K, %) by Region 2025 & 2033
- Figure 3: North America Low-α Ray Spherical Alumina for HBM Packaging Revenue (undefined), by Application 2025 & 2033
- Figure 4: North America Low-α Ray Spherical Alumina for HBM Packaging Volume (K), by Application 2025 & 2033
- Figure 5: North America Low-α Ray Spherical Alumina for HBM Packaging Revenue Share (%), by Application 2025 & 2033
- Figure 6: North America Low-α Ray Spherical Alumina for HBM Packaging Volume Share (%), by Application 2025 & 2033
- Figure 7: North America Low-α Ray Spherical Alumina for HBM Packaging Revenue (undefined), by Types 2025 & 2033
- Figure 8: North America Low-α Ray Spherical Alumina for HBM Packaging Volume (K), by Types 2025 & 2033
- Figure 9: North America Low-α Ray Spherical Alumina for HBM Packaging Revenue Share (%), by Types 2025 & 2033
- Figure 10: North America Low-α Ray Spherical Alumina for HBM Packaging Volume Share (%), by Types 2025 & 2033
- Figure 11: North America Low-α Ray Spherical Alumina for HBM Packaging Revenue (undefined), by Country 2025 & 2033
- Figure 12: North America Low-α Ray Spherical Alumina for HBM Packaging Volume (K), by Country 2025 & 2033
- Figure 13: North America Low-α Ray Spherical Alumina for HBM Packaging Revenue Share (%), by Country 2025 & 2033
- Figure 14: North America Low-α Ray Spherical Alumina for HBM Packaging Volume Share (%), by Country 2025 & 2033
- Figure 15: South America Low-α Ray Spherical Alumina for HBM Packaging Revenue (undefined), by Application 2025 & 2033
- Figure 16: South America Low-α Ray Spherical Alumina for HBM Packaging Volume (K), by Application 2025 & 2033
- Figure 17: South America Low-α Ray Spherical Alumina for HBM Packaging Revenue Share (%), by Application 2025 & 2033
- Figure 18: South America Low-α Ray Spherical Alumina for HBM Packaging Volume Share (%), by Application 2025 & 2033
- Figure 19: South America Low-α Ray Spherical Alumina for HBM Packaging Revenue (undefined), by Types 2025 & 2033
- Figure 20: South America Low-α Ray Spherical Alumina for HBM Packaging Volume (K), by Types 2025 & 2033
- Figure 21: South America Low-α Ray Spherical Alumina for HBM Packaging Revenue Share (%), by Types 2025 & 2033
- Figure 22: South America Low-α Ray Spherical Alumina for HBM Packaging Volume Share (%), by Types 2025 & 2033
- Figure 23: South America Low-α Ray Spherical Alumina for HBM Packaging Revenue (undefined), by Country 2025 & 2033
- Figure 24: South America Low-α Ray Spherical Alumina for HBM Packaging Volume (K), by Country 2025 & 2033
- Figure 25: South America Low-α Ray Spherical Alumina for HBM Packaging Revenue Share (%), by Country 2025 & 2033
- Figure 26: South America Low-α Ray Spherical Alumina for HBM Packaging Volume Share (%), by Country 2025 & 2033
- Figure 27: Europe Low-α Ray Spherical Alumina for HBM Packaging Revenue (undefined), by Application 2025 & 2033
- Figure 28: Europe Low-α Ray Spherical Alumina for HBM Packaging Volume (K), by Application 2025 & 2033
- Figure 29: Europe Low-α Ray Spherical Alumina for HBM Packaging Revenue Share (%), by Application 2025 & 2033
- Figure 30: Europe Low-α Ray Spherical Alumina for HBM Packaging Volume Share (%), by Application 2025 & 2033
- Figure 31: Europe Low-α Ray Spherical Alumina for HBM Packaging Revenue (undefined), by Types 2025 & 2033
- Figure 32: Europe Low-α Ray Spherical Alumina for HBM Packaging Volume (K), by Types 2025 & 2033
- Figure 33: Europe Low-α Ray Spherical Alumina for HBM Packaging Revenue Share (%), by Types 2025 & 2033
- Figure 34: Europe Low-α Ray Spherical Alumina for HBM Packaging Volume Share (%), by Types 2025 & 2033
- Figure 35: Europe Low-α Ray Spherical Alumina for HBM Packaging Revenue (undefined), by Country 2025 & 2033
- Figure 36: Europe Low-α Ray Spherical Alumina for HBM Packaging Volume (K), by Country 2025 & 2033
- Figure 37: Europe Low-α Ray Spherical Alumina for HBM Packaging Revenue Share (%), by Country 2025 & 2033
- Figure 38: Europe Low-α Ray Spherical Alumina for HBM Packaging Volume Share (%), by Country 2025 & 2033
- Figure 39: Middle East & Africa Low-α Ray Spherical Alumina for HBM Packaging Revenue (undefined), by Application 2025 & 2033
- Figure 40: Middle East & Africa Low-α Ray Spherical Alumina for HBM Packaging Volume (K), by Application 2025 & 2033
- Figure 41: Middle East & Africa Low-α Ray Spherical Alumina for HBM Packaging Revenue Share (%), by Application 2025 & 2033
- Figure 42: Middle East & Africa Low-α Ray Spherical Alumina for HBM Packaging Volume Share (%), by Application 2025 & 2033
- Figure 43: Middle East & Africa Low-α Ray Spherical Alumina for HBM Packaging Revenue (undefined), by Types 2025 & 2033
- Figure 44: Middle East & Africa Low-α Ray Spherical Alumina for HBM Packaging Volume (K), by Types 2025 & 2033
- Figure 45: Middle East & Africa Low-α Ray Spherical Alumina for HBM Packaging Revenue Share (%), by Types 2025 & 2033
- Figure 46: Middle East & Africa Low-α Ray Spherical Alumina for HBM Packaging Volume Share (%), by Types 2025 & 2033
- Figure 47: Middle East & Africa Low-α Ray Spherical Alumina for HBM Packaging Revenue (undefined), by Country 2025 & 2033
- Figure 48: Middle East & Africa Low-α Ray Spherical Alumina for HBM Packaging Volume (K), by Country 2025 & 2033
- Figure 49: Middle East & Africa Low-α Ray Spherical Alumina for HBM Packaging Revenue Share (%), by Country 2025 & 2033
- Figure 50: Middle East & Africa Low-α Ray Spherical Alumina for HBM Packaging Volume Share (%), by Country 2025 & 2033
- Figure 51: Asia Pacific Low-α Ray Spherical Alumina for HBM Packaging Revenue (undefined), by Application 2025 & 2033
- Figure 52: Asia Pacific Low-α Ray Spherical Alumina for HBM Packaging Volume (K), by Application 2025 & 2033
- Figure 53: Asia Pacific Low-α Ray Spherical Alumina for HBM Packaging Revenue Share (%), by Application 2025 & 2033
- Figure 54: Asia Pacific Low-α Ray Spherical Alumina for HBM Packaging Volume Share (%), by Application 2025 & 2033
- Figure 55: Asia Pacific Low-α Ray Spherical Alumina for HBM Packaging Revenue (undefined), by Types 2025 & 2033
- Figure 56: Asia Pacific Low-α Ray Spherical Alumina for HBM Packaging Volume (K), by Types 2025 & 2033
- Figure 57: Asia Pacific Low-α Ray Spherical Alumina for HBM Packaging Revenue Share (%), by Types 2025 & 2033
- Figure 58: Asia Pacific Low-α Ray Spherical Alumina for HBM Packaging Volume Share (%), by Types 2025 & 2033
- Figure 59: Asia Pacific Low-α Ray Spherical Alumina for HBM Packaging Revenue (undefined), by Country 2025 & 2033
- Figure 60: Asia Pacific Low-α Ray Spherical Alumina for HBM Packaging Volume (K), by Country 2025 & 2033
- Figure 61: Asia Pacific Low-α Ray Spherical Alumina for HBM Packaging Revenue Share (%), by Country 2025 & 2033
- Figure 62: Asia Pacific Low-α Ray Spherical Alumina for HBM Packaging Volume Share (%), by Country 2025 & 2033
List of Tables
- Table 1: Global Low-α Ray Spherical Alumina for HBM Packaging Revenue undefined Forecast, by Application 2020 & 2033
- Table 2: Global Low-α Ray Spherical Alumina for HBM Packaging Volume K Forecast, by Application 2020 & 2033
- Table 3: Global Low-α Ray Spherical Alumina for HBM Packaging Revenue undefined Forecast, by Types 2020 & 2033
- Table 4: Global Low-α Ray Spherical Alumina for HBM Packaging Volume K Forecast, by Types 2020 & 2033
- Table 5: Global Low-α Ray Spherical Alumina for HBM Packaging Revenue undefined Forecast, by Region 2020 & 2033
- Table 6: Global Low-α Ray Spherical Alumina for HBM Packaging Volume K Forecast, by Region 2020 & 2033
- Table 7: Global Low-α Ray Spherical Alumina for HBM Packaging Revenue undefined Forecast, by Application 2020 & 2033
- Table 8: Global Low-α Ray Spherical Alumina for HBM Packaging Volume K Forecast, by Application 2020 & 2033
- Table 9: Global Low-α Ray Spherical Alumina for HBM Packaging Revenue undefined Forecast, by Types 2020 & 2033
- Table 10: Global Low-α Ray Spherical Alumina for HBM Packaging Volume K Forecast, by Types 2020 & 2033
- Table 11: Global Low-α Ray Spherical Alumina for HBM Packaging Revenue undefined Forecast, by Country 2020 & 2033
- Table 12: Global Low-α Ray Spherical Alumina for HBM Packaging Volume K Forecast, by Country 2020 & 2033
- Table 13: United States Low-α Ray Spherical Alumina for HBM Packaging Revenue (undefined) Forecast, by Application 2020 & 2033
- Table 14: United States Low-α Ray Spherical Alumina for HBM Packaging Volume (K) Forecast, by Application 2020 & 2033
- Table 15: Canada Low-α Ray Spherical Alumina for HBM Packaging Revenue (undefined) Forecast, by Application 2020 & 2033
- Table 16: Canada Low-α Ray Spherical Alumina for HBM Packaging Volume (K) Forecast, by Application 2020 & 2033
- Table 17: Mexico Low-α Ray Spherical Alumina for HBM Packaging Revenue (undefined) Forecast, by Application 2020 & 2033
- Table 18: Mexico Low-α Ray Spherical Alumina for HBM Packaging Volume (K) Forecast, by Application 2020 & 2033
- Table 19: Global Low-α Ray Spherical Alumina for HBM Packaging Revenue undefined Forecast, by Application 2020 & 2033
- Table 20: Global Low-α Ray Spherical Alumina for HBM Packaging Volume K Forecast, by Application 2020 & 2033
- Table 21: Global Low-α Ray Spherical Alumina for HBM Packaging Revenue undefined Forecast, by Types 2020 & 2033
- Table 22: Global Low-α Ray Spherical Alumina for HBM Packaging Volume K Forecast, by Types 2020 & 2033
- Table 23: Global Low-α Ray Spherical Alumina for HBM Packaging Revenue undefined Forecast, by Country 2020 & 2033
- Table 24: Global Low-α Ray Spherical Alumina for HBM Packaging Volume K Forecast, by Country 2020 & 2033
- Table 25: Brazil Low-α Ray Spherical Alumina for HBM Packaging Revenue (undefined) Forecast, by Application 2020 & 2033
- Table 26: Brazil Low-α Ray Spherical Alumina for HBM Packaging Volume (K) Forecast, by Application 2020 & 2033
- Table 27: Argentina Low-α Ray Spherical Alumina for HBM Packaging Revenue (undefined) Forecast, by Application 2020 & 2033
- Table 28: Argentina Low-α Ray Spherical Alumina for HBM Packaging Volume (K) Forecast, by Application 2020 & 2033
- Table 29: Rest of South America Low-α Ray Spherical Alumina for HBM Packaging Revenue (undefined) Forecast, by Application 2020 & 2033
- Table 30: Rest of South America Low-α Ray Spherical Alumina for HBM Packaging Volume (K) Forecast, by Application 2020 & 2033
- Table 31: Global Low-α Ray Spherical Alumina for HBM Packaging Revenue undefined Forecast, by Application 2020 & 2033
- Table 32: Global Low-α Ray Spherical Alumina for HBM Packaging Volume K Forecast, by Application 2020 & 2033
- Table 33: Global Low-α Ray Spherical Alumina for HBM Packaging Revenue undefined Forecast, by Types 2020 & 2033
- Table 34: Global Low-α Ray Spherical Alumina for HBM Packaging Volume K Forecast, by Types 2020 & 2033
- Table 35: Global Low-α Ray Spherical Alumina for HBM Packaging Revenue undefined Forecast, by Country 2020 & 2033
- Table 36: Global Low-α Ray Spherical Alumina for HBM Packaging Volume K Forecast, by Country 2020 & 2033
- Table 37: United Kingdom Low-α Ray Spherical Alumina for HBM Packaging Revenue (undefined) Forecast, by Application 2020 & 2033
- Table 38: United Kingdom Low-α Ray Spherical Alumina for HBM Packaging Volume (K) Forecast, by Application 2020 & 2033
- Table 39: Germany Low-α Ray Spherical Alumina for HBM Packaging Revenue (undefined) Forecast, by Application 2020 & 2033
- Table 40: Germany Low-α Ray Spherical Alumina for HBM Packaging Volume (K) Forecast, by Application 2020 & 2033
- Table 41: France Low-α Ray Spherical Alumina for HBM Packaging Revenue (undefined) Forecast, by Application 2020 & 2033
- Table 42: France Low-α Ray Spherical Alumina for HBM Packaging Volume (K) Forecast, by Application 2020 & 2033
- Table 43: Italy Low-α Ray Spherical Alumina for HBM Packaging Revenue (undefined) Forecast, by Application 2020 & 2033
- Table 44: Italy Low-α Ray Spherical Alumina for HBM Packaging Volume (K) Forecast, by Application 2020 & 2033
- Table 45: Spain Low-α Ray Spherical Alumina for HBM Packaging Revenue (undefined) Forecast, by Application 2020 & 2033
- Table 46: Spain Low-α Ray Spherical Alumina for HBM Packaging Volume (K) Forecast, by Application 2020 & 2033
- Table 47: Russia Low-α Ray Spherical Alumina for HBM Packaging Revenue (undefined) Forecast, by Application 2020 & 2033
- Table 48: Russia Low-α Ray Spherical Alumina for HBM Packaging Volume (K) Forecast, by Application 2020 & 2033
- Table 49: Benelux Low-α Ray Spherical Alumina for HBM Packaging Revenue (undefined) Forecast, by Application 2020 & 2033
- Table 50: Benelux Low-α Ray Spherical Alumina for HBM Packaging Volume (K) Forecast, by Application 2020 & 2033
- Table 51: Nordics Low-α Ray Spherical Alumina for HBM Packaging Revenue (undefined) Forecast, by Application 2020 & 2033
- Table 52: Nordics Low-α Ray Spherical Alumina for HBM Packaging Volume (K) Forecast, by Application 2020 & 2033
- Table 53: Rest of Europe Low-α Ray Spherical Alumina for HBM Packaging Revenue (undefined) Forecast, by Application 2020 & 2033
- Table 54: Rest of Europe Low-α Ray Spherical Alumina for HBM Packaging Volume (K) Forecast, by Application 2020 & 2033
- Table 55: Global Low-α Ray Spherical Alumina for HBM Packaging Revenue undefined Forecast, by Application 2020 & 2033
- Table 56: Global Low-α Ray Spherical Alumina for HBM Packaging Volume K Forecast, by Application 2020 & 2033
- Table 57: Global Low-α Ray Spherical Alumina for HBM Packaging Revenue undefined Forecast, by Types 2020 & 2033
- Table 58: Global Low-α Ray Spherical Alumina for HBM Packaging Volume K Forecast, by Types 2020 & 2033
- Table 59: Global Low-α Ray Spherical Alumina for HBM Packaging Revenue undefined Forecast, by Country 2020 & 2033
- Table 60: Global Low-α Ray Spherical Alumina for HBM Packaging Volume K Forecast, by Country 2020 & 2033
- Table 61: Turkey Low-α Ray Spherical Alumina for HBM Packaging Revenue (undefined) Forecast, by Application 2020 & 2033
- Table 62: Turkey Low-α Ray Spherical Alumina for HBM Packaging Volume (K) Forecast, by Application 2020 & 2033
- Table 63: Israel Low-α Ray Spherical Alumina for HBM Packaging Revenue (undefined) Forecast, by Application 2020 & 2033
- Table 64: Israel Low-α Ray Spherical Alumina for HBM Packaging Volume (K) Forecast, by Application 2020 & 2033
- Table 65: GCC Low-α Ray Spherical Alumina for HBM Packaging Revenue (undefined) Forecast, by Application 2020 & 2033
- Table 66: GCC Low-α Ray Spherical Alumina for HBM Packaging Volume (K) Forecast, by Application 2020 & 2033
- Table 67: North Africa Low-α Ray Spherical Alumina for HBM Packaging Revenue (undefined) Forecast, by Application 2020 & 2033
- Table 68: North Africa Low-α Ray Spherical Alumina for HBM Packaging Volume (K) Forecast, by Application 2020 & 2033
- Table 69: South Africa Low-α Ray Spherical Alumina for HBM Packaging Revenue (undefined) Forecast, by Application 2020 & 2033
- Table 70: South Africa Low-α Ray Spherical Alumina for HBM Packaging Volume (K) Forecast, by Application 2020 & 2033
- Table 71: Rest of Middle East & Africa Low-α Ray Spherical Alumina for HBM Packaging Revenue (undefined) Forecast, by Application 2020 & 2033
- Table 72: Rest of Middle East & Africa Low-α Ray Spherical Alumina for HBM Packaging Volume (K) Forecast, by Application 2020 & 2033
- Table 73: Global Low-α Ray Spherical Alumina for HBM Packaging Revenue undefined Forecast, by Application 2020 & 2033
- Table 74: Global Low-α Ray Spherical Alumina for HBM Packaging Volume K Forecast, by Application 2020 & 2033
- Table 75: Global Low-α Ray Spherical Alumina for HBM Packaging Revenue undefined Forecast, by Types 2020 & 2033
- Table 76: Global Low-α Ray Spherical Alumina for HBM Packaging Volume K Forecast, by Types 2020 & 2033
- Table 77: Global Low-α Ray Spherical Alumina for HBM Packaging Revenue undefined Forecast, by Country 2020 & 2033
- Table 78: Global Low-α Ray Spherical Alumina for HBM Packaging Volume K Forecast, by Country 2020 & 2033
- Table 79: China Low-α Ray Spherical Alumina for HBM Packaging Revenue (undefined) Forecast, by Application 2020 & 2033
- Table 80: China Low-α Ray Spherical Alumina for HBM Packaging Volume (K) Forecast, by Application 2020 & 2033
- Table 81: India Low-α Ray Spherical Alumina for HBM Packaging Revenue (undefined) Forecast, by Application 2020 & 2033
- Table 82: India Low-α Ray Spherical Alumina for HBM Packaging Volume (K) Forecast, by Application 2020 & 2033
- Table 83: Japan Low-α Ray Spherical Alumina for HBM Packaging Revenue (undefined) Forecast, by Application 2020 & 2033
- Table 84: Japan Low-α Ray Spherical Alumina for HBM Packaging Volume (K) Forecast, by Application 2020 & 2033
- Table 85: South Korea Low-α Ray Spherical Alumina for HBM Packaging Revenue (undefined) Forecast, by Application 2020 & 2033
- Table 86: South Korea Low-α Ray Spherical Alumina for HBM Packaging Volume (K) Forecast, by Application 2020 & 2033
- Table 87: ASEAN Low-α Ray Spherical Alumina for HBM Packaging Revenue (undefined) Forecast, by Application 2020 & 2033
- Table 88: ASEAN Low-α Ray Spherical Alumina for HBM Packaging Volume (K) Forecast, by Application 2020 & 2033
- Table 89: Oceania Low-α Ray Spherical Alumina for HBM Packaging Revenue (undefined) Forecast, by Application 2020 & 2033
- Table 90: Oceania Low-α Ray Spherical Alumina for HBM Packaging Volume (K) Forecast, by Application 2020 & 2033
- Table 91: Rest of Asia Pacific Low-α Ray Spherical Alumina for HBM Packaging Revenue (undefined) Forecast, by Application 2020 & 2033
- Table 92: Rest of Asia Pacific Low-α Ray Spherical Alumina for HBM Packaging Volume (K) Forecast, by Application 2020 & 2033
Frequently Asked Questions
1. What is the projected Compound Annual Growth Rate (CAGR) of the Low-α Ray Spherical Alumina for HBM Packaging?
The projected CAGR is approximately 9.4%.
2. Which companies are prominent players in the Low-α Ray Spherical Alumina for HBM Packaging?
Key companies in the market include Admatechs, Estone Materials Technology, Novoray Corporation.
3. What are the main segments of the Low-α Ray Spherical Alumina for HBM Packaging?
The market segments include Application, Types.
4. Can you provide details about the market size?
The market size is estimated to be USD XXX N/A as of 2022.
5. What are some drivers contributing to market growth?
N/A
6. What are the notable trends driving market growth?
N/A
7. Are there any restraints impacting market growth?
N/A
8. Can you provide examples of recent developments in the market?
N/A
9. What pricing options are available for accessing the report?
Pricing options include single-user, multi-user, and enterprise licenses priced at USD 4350.00, USD 6525.00, and USD 8700.00 respectively.
10. Is the market size provided in terms of value or volume?
The market size is provided in terms of value, measured in N/A and volume, measured in K.
11. Are there any specific market keywords associated with the report?
Yes, the market keyword associated with the report is "Low-α Ray Spherical Alumina for HBM Packaging," which aids in identifying and referencing the specific market segment covered.
12. How do I determine which pricing option suits my needs best?
The pricing options vary based on user requirements and access needs. Individual users may opt for single-user licenses, while businesses requiring broader access may choose multi-user or enterprise licenses for cost-effective access to the report.
13. Are there any additional resources or data provided in the Low-α Ray Spherical Alumina for HBM Packaging report?
While the report offers comprehensive insights, it's advisable to review the specific contents or supplementary materials provided to ascertain if additional resources or data are available.
14. How can I stay updated on further developments or reports in the Low-α Ray Spherical Alumina for HBM Packaging?
To stay informed about further developments, trends, and reports in the Low-α Ray Spherical Alumina for HBM Packaging, consider subscribing to industry newsletters, following relevant companies and organizations, or regularly checking reputable industry news sources and publications.
Methodology
Step 1 - Identification of Relevant Samples Size from Population Database


Step 2 - Approaches for Defining Global Market Size (Value, Volume* & Price*)

Note*: In applicable scenarios
Step 3 - Data Sources
Primary Research
- Web Analytics
- Survey Reports
- Research Institute
- Latest Research Reports
- Opinion Leaders
Secondary Research
- Annual Reports
- White Paper
- Latest Press Release
- Industry Association
- Paid Database
- Investor Presentations

Step 4 - Data Triangulation
Involves using different sources of information in order to increase the validity of a study
These sources are likely to be stakeholders in a program - participants, other researchers, program staff, other community members, and so on.
Then we put all data in single framework & apply various statistical tools to find out the dynamic on the market.
During the analysis stage, feedback from the stakeholder groups would be compared to determine areas of agreement as well as areas of divergence