

Key Insights
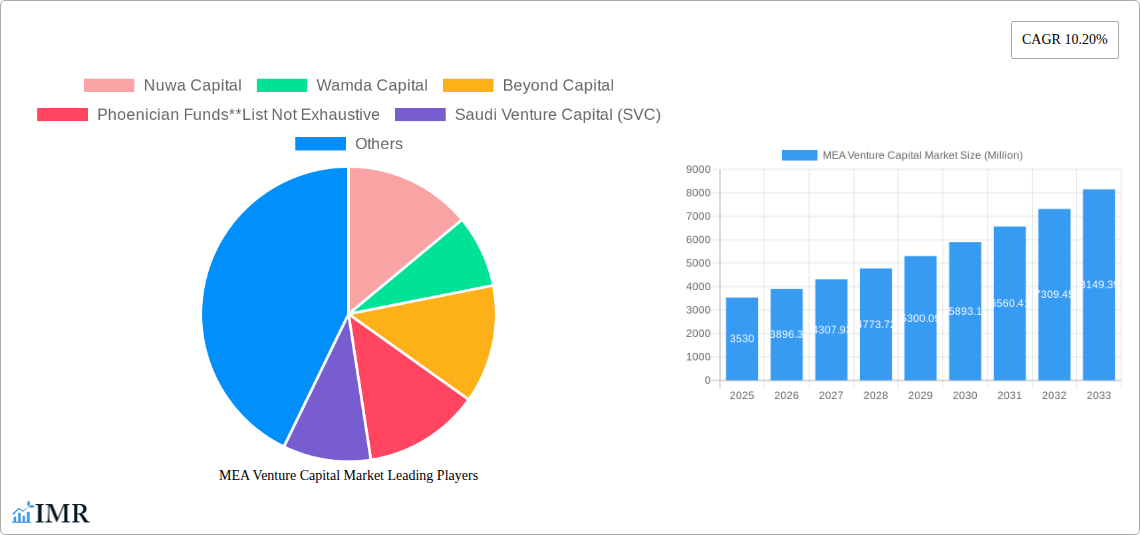
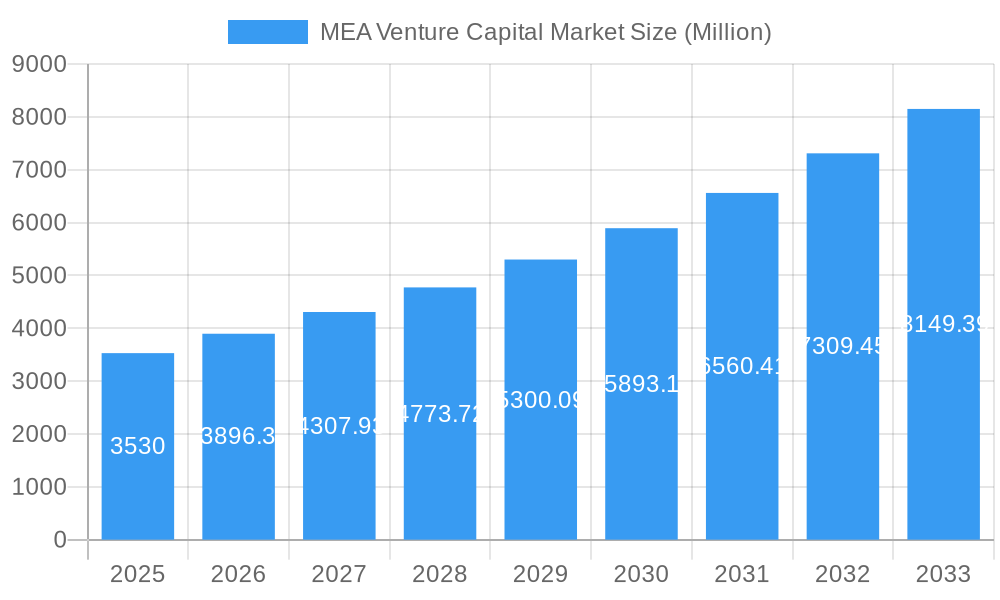
The Middle East & Africa (MEA) venture capital market is experiencing robust growth, projected to reach $3.53 billion in 2025 and maintain a Compound Annual Growth Rate (CAGR) of 10.20% from 2025 to 2033. This expansion is fueled by several key drivers. Firstly, a burgeoning startup ecosystem across the region, particularly in the UAE, Saudi Arabia, and South Africa, is attracting significant investor interest. Government initiatives promoting entrepreneurship and technological innovation are further accelerating this trend. Secondly, the diversification of economies away from traditional oil and gas industries is creating fertile ground for investment in high-growth sectors such as fintech, e-commerce, and healthcare technology. Finally, increased availability of funding from both local and international investors, including prominent firms like Nuwa Capital, Wamda Capital, and 500 Startups, is providing crucial capital for startup development and scaling. The market is segmented by investor type (local and international) and industry, with real estate, financial services, food & beverage, and technology sectors leading investment.
MEA Venture Capital Market Market Size (In Billion)
However, the market also faces certain restraints. Regulatory hurdles and a relatively nascent startup culture in some MEA countries can impede growth. Competition for talent and access to skilled professionals remains a challenge, particularly in certain specialized technological areas. Furthermore, macroeconomic factors such as global economic uncertainty and regional geopolitical instability can influence investor sentiment and investment decisions. Despite these challenges, the long-term outlook for the MEA venture capital market remains positive. Continued economic diversification, supportive government policies, and the growing maturity of the startup ecosystem suggest sustained and substantial growth over the forecast period. The increasing participation of international investors signals a growing confidence in the region's potential, suggesting a bright future for the MEA venture capital landscape.
MEA Venture Capital Market Company Market Share
MEA Venture Capital Market: A Comprehensive Report (2019-2033)
This comprehensive report provides an in-depth analysis of the Middle East and Africa (MEA) Venture Capital market, encompassing market dynamics, growth trends, key players, and future projections. The study period covers 2019-2033, with 2025 as the base and estimated year. The report offers invaluable insights for venture capitalists, investors, startups, and industry professionals seeking to navigate this dynamic market. The report segments the market by Type (Local Investors, International Investors) and Industry (Real Estate, Financial Services, Food & Beverage, Healthcare, Transport and Logistics, IT and ITeS, Education, Other Industries), offering granular analysis of each segment's growth trajectory.
MEA Venture Capital Market Dynamics & Structure
This section analyzes the MEA venture capital market's structure, identifying key dynamics influencing its growth. We delve into market concentration, assessing the dominance of major players and exploring the level of competition. Technological innovation is examined, highlighting the role of disruptive technologies and their impact on investment strategies. The regulatory landscape is explored, analyzing the impact of government policies and regulations on market accessibility and investment flows. We also investigate the presence of competitive product substitutes and their influence on market share. The analysis incorporates end-user demographics, pinpointing target markets and investment preferences. Finally, the report examines mergers and acquisitions (M&A) activity, quantifying deal volumes and analyzing their implications for market consolidation and growth.
- Market Concentration: xx% market share held by top 5 players in 2024.
- M&A Activity: xx deals completed in 2024, indicating a growing trend of consolidation.
- Regulatory Landscape: Increasingly favorable regulatory frameworks in certain MEA countries are driving investment.
- Technological Innovation: Fintech, Edtech, and Healthtech are key areas attracting significant VC investments.
- Innovation Barriers: Access to funding, talent acquisition, and bureaucratic hurdles remain significant challenges.
MEA Venture Capital Market Growth Trends & Insights
This section provides a detailed analysis of the MEA venture capital market's growth trajectory using robust data and advanced analytical techniques. We explore the market size evolution, tracking historical growth and projecting future expansion. Adoption rates for venture capital funding across various industries are analyzed, highlighting sectors exhibiting the strongest growth potential. The impact of technological disruptions on market dynamics is examined, focusing on how innovations shape investor preferences and investment strategies. Finally, consumer behavior shifts are analyzed to determine their effect on market demand and investment opportunities.
- Market Size (2024): xx Million
- Projected Market Size (2033): xx Million
- CAGR (2025-2033): xx%
- Market Penetration (2024): xx%
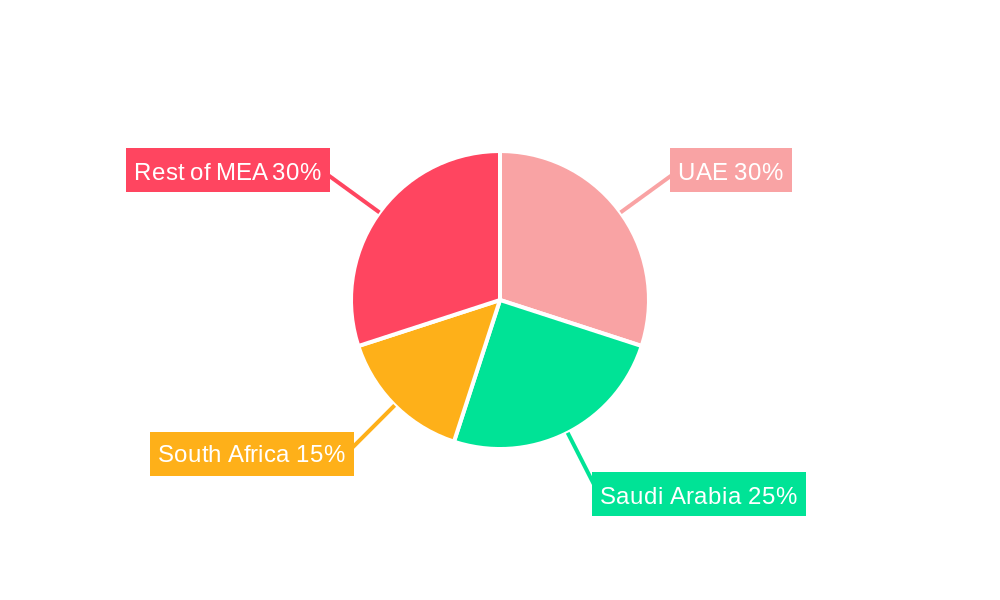
Dominant Regions, Countries, or Segments in MEA Venture Capital Market
This section provides a comprehensive analysis of the leading geographical regions, key countries, and high-growth market segments that are propelling the MEA venture capital landscape. We delve into the underlying factors contributing to their prominence, integrating both quantitative metrics such as market share and historical growth rates, alongside qualitative elements like supportive economic policies, burgeoning startup ecosystems, and advancements in infrastructure development. Furthermore, we dissect the performance and influence of diverse investor categories, distinguishing between local and international players, and examine the specific contributions of various industry sectors to the overall market expansion.
- Dominant Regions: The United Arab Emirates (UAE) and the Kingdom of Saudi Arabia are consistently emerging as the most influential and dominant regions within the MEA venture capital market, attracting significant investment and fostering robust startup activity.
- Leading Industry Segments: The Information Technology (IT) and IT-enabled Services (ITeS) sector is anticipated to maintain its leadership in attracting venture capital investments, driven by digital transformation trends and increasing demand for tech-driven solutions. Other prominent sectors include FinTech, E-commerce, and HealthTech.
- Key Growth Drivers: Several factors are fueling the market's ascendance, including proactive government initiatives aimed at fostering innovation and entrepreneurship, the maturation and increasing sophistication of startup ecosystems across the region, and a rapidly accelerating digital adoption rate among consumers and businesses.
- Projected Market Share (UAE, 2024): [Insert latest available data or projection]%
- Projected Growth Potential (Saudi Arabia, 2025-2033): [Insert latest available data or projection]%
MEA Venture Capital Market Product Landscape
This section offers a detailed exploration of the innovative products, diverse applications, and critical performance indicators that define the MEA venture capital market. We highlight the unique value propositions of various investment vehicles and examine the impact of cutting-edge technological advancements on industry dynamics. Specific examples of successful product innovations and their influence on market trends are elucidated.
The MEA venture capital market is characterized by a remarkably diversified product offering, encompassing a spectrum from early-stage seed funding designed to nurture nascent ideas, to later-stage growth equity investments aimed at scaling established businesses. Emerging technological frontiers, particularly in the realms of advanced data analytics and artificial intelligence (AI), are revolutionizing how deals are sourced and portfolios are managed. This technological integration translates into more precise risk assessments and, consequently, enhanced potential for investor returns.
Key Drivers, Barriers & Challenges in MEA Venture Capital Market
This section identifies the key factors driving the MEA venture capital market's growth and the challenges hindering its expansion. Drivers include technological advancements, supportive government policies, and a burgeoning startup ecosystem. Challenges include regulatory hurdles, limited access to funding for certain sectors, and intense competition among investors.
Key Drivers:
- Technological advancements across various sectors.
- Supportive government initiatives and investment funds.
- Growing number of high-potential startups.
Key Challenges:
- Regulatory uncertainty in some countries.
- Limited access to funding for early-stage startups.
- Competition among VCs for promising investment opportunities.
- Lack of experienced talent in some areas.
Emerging Opportunities in MEA Venture Capital Market
This section shines a spotlight on the most promising and untapped opportunities emerging within the dynamic MEA venture capital market. We identify nascent market segments ripe for disruption, innovative applications of technology poised for rapid adoption, and evolving consumer behaviors that present new avenues for investment. Specific opportunities are detailed, with a focus on their potential for substantial growth and attractive investment returns.
- Geographic Expansion: Significant opportunities lie in expanding into underserved or emerging markets within the broader MEA region, catering to nascent demand and less saturated competitive landscapes.
- Technological Innovation: Strategic investments in disruptive technologies such as Artificial Intelligence (AI), blockchain, the Internet of Things (IoT), and advanced cybersecurity solutions are key to unlocking future growth.
- High-Growth Sectors: A concentrated focus on sectors demonstrating exceptional growth trajectories, including but not limited to Financial Technology (FinTech), Health Technology (HealthTech), and Education Technology (EdTech), presents significant potential. Other sectors like renewable energy and advanced manufacturing are also gaining traction.
Growth Accelerators in the MEA Venture Capital Market Industry
This section identifies the key catalysts driving long-term growth within the MEA venture capital market. This includes technological advancements that create new investment opportunities, strategic partnerships that foster market expansion, and market expansion strategies that broaden the reach of venture capital.
Technological breakthroughs in key sectors are creating significant investment opportunities, while strategic partnerships between governments and private investors are accelerating market growth. The continuous expansion of the startup ecosystem fuels further growth.
Key Players Shaping the MEA Venture Capital Market Market
- Nuwa Capital
- Wamda Capital
- Beyond Capital
- Phoenician Funds
- Saudi Venture Capital (SVC)
- Falt6Labs Bahrain
- Global ventures
- Vision Ventures
- Algebra Ventures
- 500 Startups
Notable Milestones in MEA Venture Capital Market Sector
- February 2023: Saudi Venture Capital Investment Company launches a USD 1 million income growth fund.
- February 2023: Flat6Labs completes the first close of its USD 20 million 'Startup Seed Fund' in Saudi Arabia, with participation from the Saudi Venture Capital Company (SVC) and the 'Jada' Fund of Funds.
In-Depth MEA Venture Capital Market Market Outlook
The MEA venture capital market is poised for significant growth over the next decade, driven by technological advancements, supportive government policies, and a growing number of high-potential startups. Strategic opportunities exist in sectors such as Fintech, HealthTech, and EdTech. The market's continued expansion will be shaped by the increasing adoption of innovative technologies and the strategic partnerships between investors and government entities. The report's findings highlight a promising outlook, emphasizing the potential for substantial returns for investors who capitalize on the region's dynamic and rapidly evolving landscape.
MEA Venture Capital Market Segmentation
-
1. Type
- 1.1. Local Investors
- 1.2. International Investors
-
2. Industry
- 2.1. Real Estate
- 2.2. Financial Services
- 2.3. Food & Beverage
- 2.4. Healthcare
- 2.5. Transport and Logistics
- 2.6. IT and ITeS
- 2.7. Education
- 2.8. Other Industries (Energy, etc.)
MEA Venture Capital Market Segmentation By Geography
-
1. North America
- 1.1. United States
- 1.2. Canada
- 1.3. Mexico
-
2. South America
- 2.1. Brazil
- 2.2. Argentina
- 2.3. Rest of South America
-
3. Europe
- 3.1. United Kingdom
- 3.2. Germany
- 3.3. France
- 3.4. Italy
- 3.5. Spain
- 3.6. Russia
- 3.7. Benelux
- 3.8. Nordics
- 3.9. Rest of Europe
-
4. Middle East & Africa
- 4.1. Turkey
- 4.2. Israel
- 4.3. GCC
- 4.4. North Africa
- 4.5. South Africa
- 4.6. Rest of Middle East & Africa
-
5. Asia Pacific
- 5.1. China
- 5.2. India
- 5.3. Japan
- 5.4. South Korea
- 5.5. ASEAN
- 5.6. Oceania
- 5.7. Rest of Asia Pacific
MEA Venture Capital Market Regional Market Share
Geographic Coverage of MEA Venture Capital Market
MEA Venture Capital Market REPORT HIGHLIGHTS
| Aspects | Details |
|---|---|
| Study Period | 2020-2034 |
| Base Year | 2025 |
| Estimated Year | 2026 |
| Forecast Period | 2026-2034 |
| Historical Period | 2020-2025 |
| Growth Rate | CAGR of 10.20% from 2020-2034 |
| Segmentation |
|
Table of Contents
- 1. Introduction
- 1.1. Research Scope
- 1.2. Market Segmentation
- 1.3. Research Objective
- 1.4. Definitions and Assumptions
- 2. Executive Summary
- 2.1. Market Snapshot
- 3. Market Dynamics
- 3.1. Market Drivers
- 3.2. Market Restrains
- 3.3. Market Trends
- 3.4. Market Opportunities
- 4. Market Factor Analysis
- 4.1. Porters Five Forces
- 4.1.1. Bargaining Power of Suppliers
- 4.1.2. Bargaining Power of Buyers
- 4.1.3. Threat of New Entrants
- 4.1.4. Threat of Substitutes
- 4.1.5. Competitive Rivalry
- 4.2. PESTEL analysis
- 4.3. BCG Analysis
- 4.3.1. Stars (High Growth, High Market Share)
- 4.3.2. Cash Cows (Low Growth, High Market Share)
- 4.3.3. Question Mark (High Growth, Low Market Share)
- 4.3.4. Dogs (Low Growth, Low Market Share)
- 4.4. Ansoff Matrix Analysis
- 4.5. Supply Chain Analysis
- 4.6. Regulatory Landscape
- 4.7. Current Market Potential and Opportunity Assessment (TAM–SAM–SOM Framework)
- 4.8. IMR Analyst Note
- 4.1. Porters Five Forces
- 5. Market Analysis, Insights and Forecast 2021-2033
- 5.1. Market Analysis, Insights and Forecast - by Type
- 5.1.1. Local Investors
- 5.1.2. International Investors
- 5.2. Market Analysis, Insights and Forecast - by Industry
- 5.2.1. Real Estate
- 5.2.2. Financial Services
- 5.2.3. Food & Beverage
- 5.2.4. Healthcare
- 5.2.5. Transport and Logistics
- 5.2.6. IT and ITeS
- 5.2.7. Education
- 5.2.8. Other Industries (Energy, etc.)
- 5.3. Market Analysis, Insights and Forecast - by Region
- 5.3.1. North America
- 5.3.2. South America
- 5.3.3. Europe
- 5.3.4. Middle East & Africa
- 5.3.5. Asia Pacific
- 5.1. Market Analysis, Insights and Forecast - by Type
- 6. Global MEA Venture Capital Market Analysis, Insights and Forecast, 2021-2033
- 6.1. Market Analysis, Insights and Forecast - by Type
- 6.1.1. Local Investors
- 6.1.2. International Investors
- 6.2. Market Analysis, Insights and Forecast - by Industry
- 6.2.1. Real Estate
- 6.2.2. Financial Services
- 6.2.3. Food & Beverage
- 6.2.4. Healthcare
- 6.2.5. Transport and Logistics
- 6.2.6. IT and ITeS
- 6.2.7. Education
- 6.2.8. Other Industries (Energy, etc.)
- 6.1. Market Analysis, Insights and Forecast - by Type
- 7. North America MEA Venture Capital Market Analysis, Insights and Forecast, 2020-2032
- 7.1. Market Analysis, Insights and Forecast - by Type
- 7.1.1. Local Investors
- 7.1.2. International Investors
- 7.2. Market Analysis, Insights and Forecast - by Industry
- 7.2.1. Real Estate
- 7.2.2. Financial Services
- 7.2.3. Food & Beverage
- 7.2.4. Healthcare
- 7.2.5. Transport and Logistics
- 7.2.6. IT and ITeS
- 7.2.7. Education
- 7.2.8. Other Industries (Energy, etc.)
- 7.1. Market Analysis, Insights and Forecast - by Type
- 8. South America MEA Venture Capital Market Analysis, Insights and Forecast, 2020-2032
- 8.1. Market Analysis, Insights and Forecast - by Type
- 8.1.1. Local Investors
- 8.1.2. International Investors
- 8.2. Market Analysis, Insights and Forecast - by Industry
- 8.2.1. Real Estate
- 8.2.2. Financial Services
- 8.2.3. Food & Beverage
- 8.2.4. Healthcare
- 8.2.5. Transport and Logistics
- 8.2.6. IT and ITeS
- 8.2.7. Education
- 8.2.8. Other Industries (Energy, etc.)
- 8.1. Market Analysis, Insights and Forecast - by Type
- 9. Europe MEA Venture Capital Market Analysis, Insights and Forecast, 2020-2032
- 9.1. Market Analysis, Insights and Forecast - by Type
- 9.1.1. Local Investors
- 9.1.2. International Investors
- 9.2. Market Analysis, Insights and Forecast - by Industry
- 9.2.1. Real Estate
- 9.2.2. Financial Services
- 9.2.3. Food & Beverage
- 9.2.4. Healthcare
- 9.2.5. Transport and Logistics
- 9.2.6. IT and ITeS
- 9.2.7. Education
- 9.2.8. Other Industries (Energy, etc.)
- 9.1. Market Analysis, Insights and Forecast - by Type
- 10. Middle East & Africa MEA Venture Capital Market Analysis, Insights and Forecast, 2020-2032
- 10.1. Market Analysis, Insights and Forecast - by Type
- 10.1.1. Local Investors
- 10.1.2. International Investors
- 10.2. Market Analysis, Insights and Forecast - by Industry
- 10.2.1. Real Estate
- 10.2.2. Financial Services
- 10.2.3. Food & Beverage
- 10.2.4. Healthcare
- 10.2.5. Transport and Logistics
- 10.2.6. IT and ITeS
- 10.2.7. Education
- 10.2.8. Other Industries (Energy, etc.)
- 10.1. Market Analysis, Insights and Forecast - by Type
- 11. Asia Pacific MEA Venture Capital Market Analysis, Insights and Forecast, 2020-2032
- 11.1. Market Analysis, Insights and Forecast - by Type
- 11.1.1. Local Investors
- 11.1.2. International Investors
- 11.2. Market Analysis, Insights and Forecast - by Industry
- 11.2.1. Real Estate
- 11.2.2. Financial Services
- 11.2.3. Food & Beverage
- 11.2.4. Healthcare
- 11.2.5. Transport and Logistics
- 11.2.6. IT and ITeS
- 11.2.7. Education
- 11.2.8. Other Industries (Energy, etc.)
- 11.1. Market Analysis, Insights and Forecast - by Type
- 12. Competitive Analysis
- 12.1. Company Profiles
- 12.1.1 Nuwa Capital
- 12.1.1.1. Company Overview
- 12.1.1.2. Products
- 12.1.1.3. Company Financials
- 12.1.1.4. SWOT Analysis
- 12.1.2 Wamda Capital
- 12.1.2.1. Company Overview
- 12.1.2.2. Products
- 12.1.2.3. Company Financials
- 12.1.2.4. SWOT Analysis
- 12.1.3 Beyond Capital
- 12.1.3.1. Company Overview
- 12.1.3.2. Products
- 12.1.3.3. Company Financials
- 12.1.3.4. SWOT Analysis
- 12.1.4 Phoenician Funds**List Not Exhaustive
- 12.1.4.1. Company Overview
- 12.1.4.2. Products
- 12.1.4.3. Company Financials
- 12.1.4.4. SWOT Analysis
- 12.1.5 Saudi Venture Capital (SVC)
- 12.1.5.1. Company Overview
- 12.1.5.2. Products
- 12.1.5.3. Company Financials
- 12.1.5.4. SWOT Analysis
- 12.1.6 Falt6Labs Bahrain
- 12.1.6.1. Company Overview
- 12.1.6.2. Products
- 12.1.6.3. Company Financials
- 12.1.6.4. SWOT Analysis
- 12.1.7 Global ventures
- 12.1.7.1. Company Overview
- 12.1.7.2. Products
- 12.1.7.3. Company Financials
- 12.1.7.4. SWOT Analysis
- 12.1.8 Vision Ventures
- 12.1.8.1. Company Overview
- 12.1.8.2. Products
- 12.1.8.3. Company Financials
- 12.1.8.4. SWOT Analysis
- 12.1.9 Algebra Ventures
- 12.1.9.1. Company Overview
- 12.1.9.2. Products
- 12.1.9.3. Company Financials
- 12.1.9.4. SWOT Analysis
- 12.1.10 500 Startups
- 12.1.10.1. Company Overview
- 12.1.10.2. Products
- 12.1.10.3. Company Financials
- 12.1.10.4. SWOT Analysis
- 12.1.1 Nuwa Capital
- 12.2. Market Entropy
- 12.2.1 Company's Key Areas Served
- 12.2.2 Recent Developments
- 12.3. Company Market Share Analysis 2025
- 12.3.1 Top 5 Companies Market Share Analysis
- 12.3.2 Top 3 Companies Market Share Analysis
- 12.4. List of Potential Customers
- 13. Research Methodology
List of Figures
- Figure 1: Global MEA Venture Capital Market Revenue Breakdown (Million, %) by Region 2025 & 2033
- Figure 2: North America MEA Venture Capital Market Revenue (Million), by Type 2025 & 2033
- Figure 3: North America MEA Venture Capital Market Revenue Share (%), by Type 2025 & 2033
- Figure 4: North America MEA Venture Capital Market Revenue (Million), by Industry 2025 & 2033
- Figure 5: North America MEA Venture Capital Market Revenue Share (%), by Industry 2025 & 2033
- Figure 6: North America MEA Venture Capital Market Revenue (Million), by Country 2025 & 2033
- Figure 7: North America MEA Venture Capital Market Revenue Share (%), by Country 2025 & 2033
- Figure 8: South America MEA Venture Capital Market Revenue (Million), by Type 2025 & 2033
- Figure 9: South America MEA Venture Capital Market Revenue Share (%), by Type 2025 & 2033
- Figure 10: South America MEA Venture Capital Market Revenue (Million), by Industry 2025 & 2033
- Figure 11: South America MEA Venture Capital Market Revenue Share (%), by Industry 2025 & 2033
- Figure 12: South America MEA Venture Capital Market Revenue (Million), by Country 2025 & 2033
- Figure 13: South America MEA Venture Capital Market Revenue Share (%), by Country 2025 & 2033
- Figure 14: Europe MEA Venture Capital Market Revenue (Million), by Type 2025 & 2033
- Figure 15: Europe MEA Venture Capital Market Revenue Share (%), by Type 2025 & 2033
- Figure 16: Europe MEA Venture Capital Market Revenue (Million), by Industry 2025 & 2033
- Figure 17: Europe MEA Venture Capital Market Revenue Share (%), by Industry 2025 & 2033
- Figure 18: Europe MEA Venture Capital Market Revenue (Million), by Country 2025 & 2033
- Figure 19: Europe MEA Venture Capital Market Revenue Share (%), by Country 2025 & 2033
- Figure 20: Middle East & Africa MEA Venture Capital Market Revenue (Million), by Type 2025 & 2033
- Figure 21: Middle East & Africa MEA Venture Capital Market Revenue Share (%), by Type 2025 & 2033
- Figure 22: Middle East & Africa MEA Venture Capital Market Revenue (Million), by Industry 2025 & 2033
- Figure 23: Middle East & Africa MEA Venture Capital Market Revenue Share (%), by Industry 2025 & 2033
- Figure 24: Middle East & Africa MEA Venture Capital Market Revenue (Million), by Country 2025 & 2033
- Figure 25: Middle East & Africa MEA Venture Capital Market Revenue Share (%), by Country 2025 & 2033
- Figure 26: Asia Pacific MEA Venture Capital Market Revenue (Million), by Type 2025 & 2033
- Figure 27: Asia Pacific MEA Venture Capital Market Revenue Share (%), by Type 2025 & 2033
- Figure 28: Asia Pacific MEA Venture Capital Market Revenue (Million), by Industry 2025 & 2033
- Figure 29: Asia Pacific MEA Venture Capital Market Revenue Share (%), by Industry 2025 & 2033
- Figure 30: Asia Pacific MEA Venture Capital Market Revenue (Million), by Country 2025 & 2033
- Figure 31: Asia Pacific MEA Venture Capital Market Revenue Share (%), by Country 2025 & 2033
List of Tables
- Table 1: Global MEA Venture Capital Market Revenue Million Forecast, by Type 2020 & 2033
- Table 2: Global MEA Venture Capital Market Revenue Million Forecast, by Industry 2020 & 2033
- Table 3: Global MEA Venture Capital Market Revenue Million Forecast, by Region 2020 & 2033
- Table 4: Global MEA Venture Capital Market Revenue Million Forecast, by Type 2020 & 2033
- Table 5: Global MEA Venture Capital Market Revenue Million Forecast, by Industry 2020 & 2033
- Table 6: Global MEA Venture Capital Market Revenue Million Forecast, by Country 2020 & 2033
- Table 7: United States MEA Venture Capital Market Revenue (Million) Forecast, by Application 2020 & 2033
- Table 8: Canada MEA Venture Capital Market Revenue (Million) Forecast, by Application 2020 & 2033
- Table 9: Mexico MEA Venture Capital Market Revenue (Million) Forecast, by Application 2020 & 2033
- Table 10: Global MEA Venture Capital Market Revenue Million Forecast, by Type 2020 & 2033
- Table 11: Global MEA Venture Capital Market Revenue Million Forecast, by Industry 2020 & 2033
- Table 12: Global MEA Venture Capital Market Revenue Million Forecast, by Country 2020 & 2033
- Table 13: Brazil MEA Venture Capital Market Revenue (Million) Forecast, by Application 2020 & 2033
- Table 14: Argentina MEA Venture Capital Market Revenue (Million) Forecast, by Application 2020 & 2033
- Table 15: Rest of South America MEA Venture Capital Market Revenue (Million) Forecast, by Application 2020 & 2033
- Table 16: Global MEA Venture Capital Market Revenue Million Forecast, by Type 2020 & 2033
- Table 17: Global MEA Venture Capital Market Revenue Million Forecast, by Industry 2020 & 2033
- Table 18: Global MEA Venture Capital Market Revenue Million Forecast, by Country 2020 & 2033
- Table 19: United Kingdom MEA Venture Capital Market Revenue (Million) Forecast, by Application 2020 & 2033
- Table 20: Germany MEA Venture Capital Market Revenue (Million) Forecast, by Application 2020 & 2033
- Table 21: France MEA Venture Capital Market Revenue (Million) Forecast, by Application 2020 & 2033
- Table 22: Italy MEA Venture Capital Market Revenue (Million) Forecast, by Application 2020 & 2033
- Table 23: Spain MEA Venture Capital Market Revenue (Million) Forecast, by Application 2020 & 2033
- Table 24: Russia MEA Venture Capital Market Revenue (Million) Forecast, by Application 2020 & 2033
- Table 25: Benelux MEA Venture Capital Market Revenue (Million) Forecast, by Application 2020 & 2033
- Table 26: Nordics MEA Venture Capital Market Revenue (Million) Forecast, by Application 2020 & 2033
- Table 27: Rest of Europe MEA Venture Capital Market Revenue (Million) Forecast, by Application 2020 & 2033
- Table 28: Global MEA Venture Capital Market Revenue Million Forecast, by Type 2020 & 2033
- Table 29: Global MEA Venture Capital Market Revenue Million Forecast, by Industry 2020 & 2033
- Table 30: Global MEA Venture Capital Market Revenue Million Forecast, by Country 2020 & 2033
- Table 31: Turkey MEA Venture Capital Market Revenue (Million) Forecast, by Application 2020 & 2033
- Table 32: Israel MEA Venture Capital Market Revenue (Million) Forecast, by Application 2020 & 2033
- Table 33: GCC MEA Venture Capital Market Revenue (Million) Forecast, by Application 2020 & 2033
- Table 34: North Africa MEA Venture Capital Market Revenue (Million) Forecast, by Application 2020 & 2033
- Table 35: South Africa MEA Venture Capital Market Revenue (Million) Forecast, by Application 2020 & 2033
- Table 36: Rest of Middle East & Africa MEA Venture Capital Market Revenue (Million) Forecast, by Application 2020 & 2033
- Table 37: Global MEA Venture Capital Market Revenue Million Forecast, by Type 2020 & 2033
- Table 38: Global MEA Venture Capital Market Revenue Million Forecast, by Industry 2020 & 2033
- Table 39: Global MEA Venture Capital Market Revenue Million Forecast, by Country 2020 & 2033
- Table 40: China MEA Venture Capital Market Revenue (Million) Forecast, by Application 2020 & 2033
- Table 41: India MEA Venture Capital Market Revenue (Million) Forecast, by Application 2020 & 2033
- Table 42: Japan MEA Venture Capital Market Revenue (Million) Forecast, by Application 2020 & 2033
- Table 43: South Korea MEA Venture Capital Market Revenue (Million) Forecast, by Application 2020 & 2033
- Table 44: ASEAN MEA Venture Capital Market Revenue (Million) Forecast, by Application 2020 & 2033
- Table 45: Oceania MEA Venture Capital Market Revenue (Million) Forecast, by Application 2020 & 2033
- Table 46: Rest of Asia Pacific MEA Venture Capital Market Revenue (Million) Forecast, by Application 2020 & 2033
Frequently Asked Questions
1. What is the projected Compound Annual Growth Rate (CAGR) of the MEA Venture Capital Market?
The projected CAGR is approximately 10.20%.
2. Which companies are prominent players in the MEA Venture Capital Market?
Key companies in the market include Nuwa Capital, Wamda Capital, Beyond Capital, Phoenician Funds**List Not Exhaustive, Saudi Venture Capital (SVC), Falt6Labs Bahrain, Global ventures, Vision Ventures, Algebra Ventures, 500 Startups.
3. What are the main segments of the MEA Venture Capital Market?
The market segments include Type, Industry.
4. Can you provide details about the market size?
The market size is estimated to be USD 3.53 Million as of 2022.
5. What are some drivers contributing to market growth?
Leading Share of Passenger Vehicles in Car Sales; Quick Processing of Loan through Digital Banking.
6. What are the notable trends driving market growth?
The United Arab Emirates Attracts Higher Investments in the region.
7. Are there any restraints impacting market growth?
Rising Interest Rates Affecting New Auto Buyers Demand for Loan.
8. Can you provide examples of recent developments in the market?
February 2023: Saudi Venture Capital Investment Company launches a USD 1 million income growth fund. The Company launched a close-ended income and capital growth fund - SVC Sukuk Fund.
9. What pricing options are available for accessing the report?
Pricing options include single-user, multi-user, and enterprise licenses priced at USD 4750, USD 4950, and USD 6800 respectively.
10. Is the market size provided in terms of value or volume?
The market size is provided in terms of value, measured in Million.
11. Are there any specific market keywords associated with the report?
Yes, the market keyword associated with the report is "MEA Venture Capital Market," which aids in identifying and referencing the specific market segment covered.
12. How do I determine which pricing option suits my needs best?
The pricing options vary based on user requirements and access needs. Individual users may opt for single-user licenses, while businesses requiring broader access may choose multi-user or enterprise licenses for cost-effective access to the report.
13. Are there any additional resources or data provided in the MEA Venture Capital Market report?
While the report offers comprehensive insights, it's advisable to review the specific contents or supplementary materials provided to ascertain if additional resources or data are available.
14. How can I stay updated on further developments or reports in the MEA Venture Capital Market?
To stay informed about further developments, trends, and reports in the MEA Venture Capital Market, consider subscribing to industry newsletters, following relevant companies and organizations, or regularly checking reputable industry news sources and publications.
Methodology
Step 1 - Identification of Relevant Samples Size from Population Database


Step 2 - Approaches for Defining Global Market Size (Value, Volume* & Price*)

Note*: In applicable scenarios
Step 3 - Data Sources
Primary Research
- Web Analytics
- Survey Reports
- Research Institute
- Latest Research Reports
- Opinion Leaders
Secondary Research
- Annual Reports
- White Paper
- Latest Press Release
- Industry Association
- Paid Database
- Investor Presentations

Step 4 - Data Triangulation
Involves using different sources of information in order to increase the validity of a study
These sources are likely to be stakeholders in a program - participants, other researchers, program staff, other community members, and so on.
Then we put all data in single framework & apply various statistical tools to find out the dynamic on the market.
During the analysis stage, feedback from the stakeholder groups would be compared to determine areas of agreement as well as areas of divergence