

Key Insights
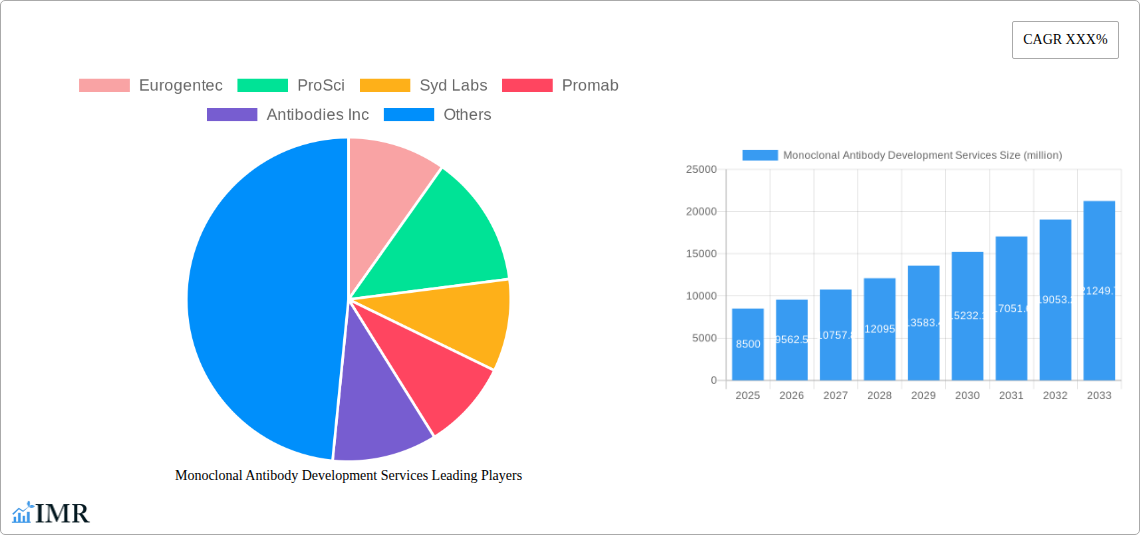
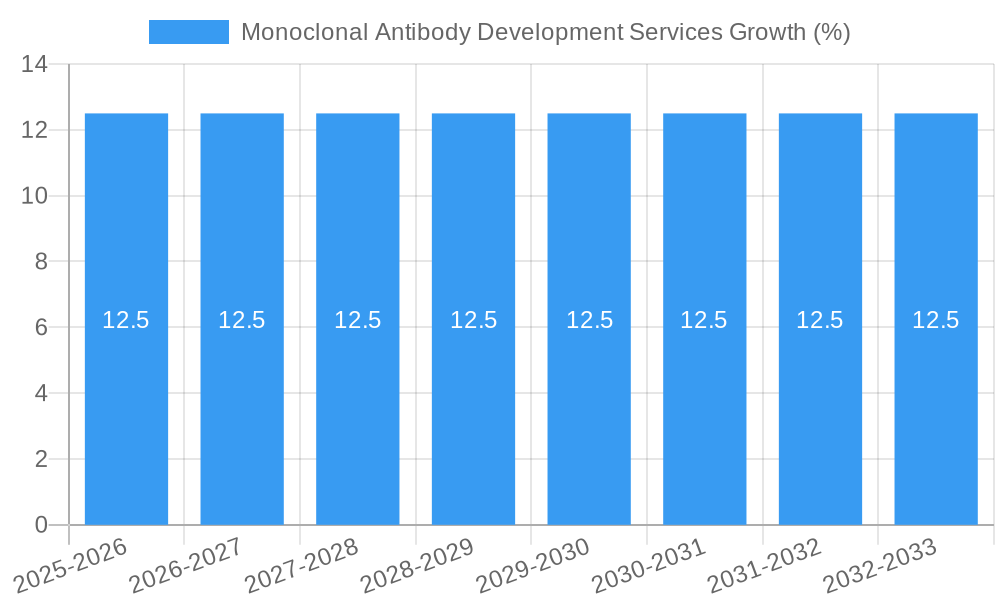
The Monoclonal Antibody Development Services market is poised for substantial growth, projected to reach an estimated $8,500 million by 2025, with a Compound Annual Growth Rate (CAGR) of 12.5% through 2033. This robust expansion is primarily fueled by the escalating demand for targeted therapies in biopharmaceuticals, revolutionizing medical treatments and diagnostic capabilities. The increasing prevalence of chronic diseases, coupled with significant investments in research and development by leading pharmaceutical and biotechnology companies, are key drivers. Furthermore, advancements in antibody engineering technologies, including recombinant DNA technology and phage display, are enabling the creation of more potent and specific monoclonal antibodies, thereby accelerating their adoption across various applications. The growing need for early disease detection and personalized medicine is also propelling the market forward, as monoclonal antibodies play a crucial role in both diagnostics and treatment strategies.
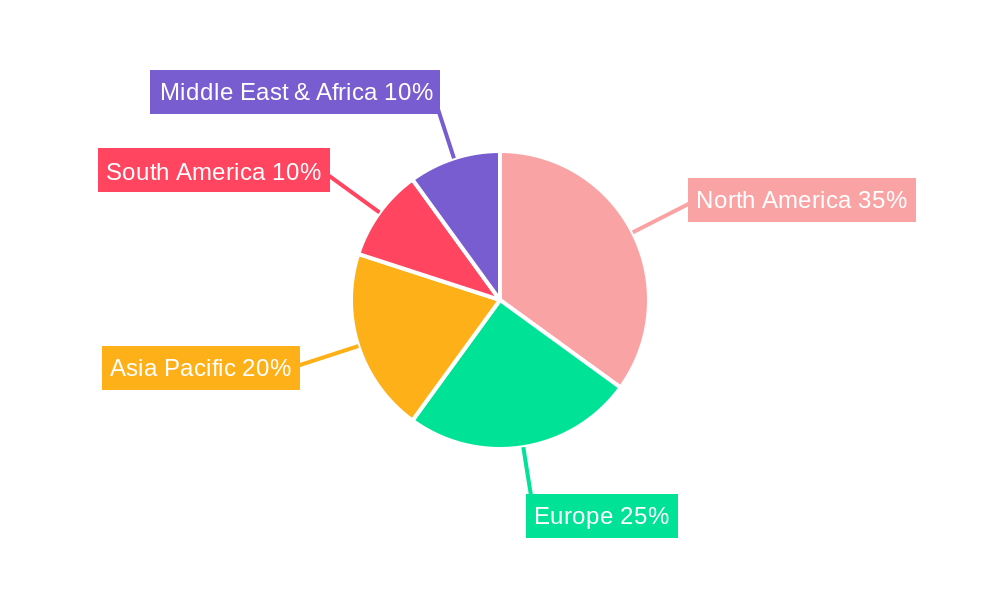
The market is segmented into small-scale, medium-scale, and large-scale types, catering to diverse research and production needs. Applications span biopharmaceuticals, medical diagnosis, agriculture, medical treatment, and environmental monitoring, highlighting the versatile utility of monoclonal antibodies. Geographically, North America is expected to lead the market, driven by a strong presence of biopharmaceutical companies and a high level of R&D expenditure. Asia Pacific, however, is anticipated to exhibit the fastest growth due to expanding healthcare infrastructure, increasing government support for biotechnology research, and a growing pool of skilled professionals. While the market offers immense opportunities, challenges such as high development costs and stringent regulatory hurdles can pose restraints. Nevertheless, continuous innovation and strategic collaborations among key players like Thermo Fisher Scientific, Eurogentec, and Promab are expected to overcome these obstacles and sustain the market's upward trajectory.
Monoclonal Antibody Development Services: Market Report 2025-2033
This comprehensive report provides an in-depth analysis of the global Monoclonal Antibody Development Services market, offering critical insights into market dynamics, growth trends, regional dominance, product landscape, key drivers, challenges, emerging opportunities, and the competitive environment. Designed for industry professionals, researchers, and investors, this report leverages high-traffic keywords like "monoclonal antibody development," "antibody services," "biologics manufacturing," "therapeutic antibodies," and "diagnostic antibodies" to ensure maximum search engine visibility. We meticulously analyze the parent market (Biotechnology Services) and child markets (e.g., Antibody Production Services) to offer a holistic view. All quantitative data is presented in millions of units where applicable.
Monoclonal Antibody Development Services Market Dynamics & Structure
The Monoclonal Antibody Development Services market is characterized by moderate concentration, with a blend of large, established players and agile, specialized service providers. Technological innovation is the primary driver, fueled by advancements in recombinant DNA technology, high-throughput screening, and bio-manufacturing processes. These innovations are crucial for developing more targeted and effective therapeutic and diagnostic antibodies. The regulatory framework, particularly stringent guidelines from agencies like the FDA and EMA, significantly influences market entry and product development cycles, emphasizing quality, safety, and efficacy. Competitive product substitutes, while present in the broader therapeutic landscape (e.g., small molecule drugs), are less direct within the specialized antibody development niche. End-user demographics are expanding, driven by the growing prevalence of chronic diseases, an aging global population, and increased investment in personalized medicine. Mergers and Acquisitions (M&A) trends indicate a strategic consolidation, with larger pharmaceutical companies acquiring or partnering with specialized CDMOs to enhance their in-house capabilities and pipeline.
- Market Concentration: Moderate, with key players holding significant shares, but ample room for specialized niche providers.
- Technological Innovation: Driven by genetic engineering, cell line development, process optimization, and analytical characterization techniques.
- Regulatory Framework: FDA, EMA, and other regional health authorities mandate rigorous quality control and validation processes.
- Competitive Product Substitutes: Emerging therapies like gene therapy and small molecule inhibitors, but monoclonal antibodies remain a cornerstone for many indications.
- End-User Demographics: Growing demand from oncology, immunology, and infectious disease research and treatment sectors.
- M&A Trends: Strategic acquisitions of CDMOs by large pharma and biotechs, aimed at securing development and manufacturing capacity.
Monoclonal Antibody Development Services Growth Trends & Insights
The Monoclonal Antibody Development Services market has witnessed substantial growth, driven by an ever-increasing demand for targeted therapies and diagnostics. The market size is projected to expand significantly throughout the forecast period. Adoption rates for antibody-based treatments, particularly in oncology and autoimmune diseases, continue to climb, reflecting their efficacy and improved safety profiles compared to traditional treatments. Technological disruptions, such as the development of bispecific antibodies, antibody-drug conjugates (ADCs), and novel delivery mechanisms, are reshaping the therapeutic landscape and accelerating market growth. Consumer behavior, influenced by patient advocacy groups and a greater understanding of personalized medicine, is increasingly favoring treatments with higher specificity and fewer side effects, thereby boosting the demand for monoclonal antibody development.
The market is experiencing robust expansion, with a projected Compound Annual Growth Rate (CAGR) of xx% during the forecast period. This growth is underpinned by a confluence of factors, including the expanding pipeline of antibody-based drugs in clinical trials, the increasing prevalence of chronic diseases globally, and the continuous technological advancements in antibody engineering and production. The shift towards personalized medicine has also significantly contributed, as monoclonal antibodies offer a high degree of specificity in targeting disease mechanisms. Furthermore, the growing outsourcing trend among pharmaceutical and biotechnology companies to specialized Contract Development and Manufacturing Organizations (CDMOs) for their antibody development needs provides a significant boost to the services market.
- Market Size Evolution: From an estimated market size of $xx million in the base year 2025, the market is projected to reach $xx million by 2033.
- Adoption Rates: Increasing adoption of therapeutic monoclonal antibodies in oncology, immunology, and neurology indications.
- Technological Disruptions: Rise of antibody-drug conjugates (ADCs), bispecific antibodies, and fragment-based antibody therapies.
- Consumer Behavior Shifts: Growing patient demand for targeted therapies with improved efficacy and reduced side effects.
- Market Penetration: Deepening penetration in established markets and significant growth potential in emerging economies.
- Investment Trends: Increased venture capital funding and strategic partnerships in the antibody development space.
Dominant Regions, Countries, or Segments in Monoclonal Antibody Development Services
The Biopharmaceuticals segment, within the Application category, is the dominant force driving growth in the Monoclonal Antibody Development Services market. This is primarily attributed to the extensive research and development activities focused on creating novel antibody-based therapeutics for a wide range of diseases, including cancer, autoimmune disorders, and infectious diseases. North America, particularly the United States, emerges as the leading region, fueled by a robust biopharmaceutical industry, substantial government funding for R&D, and a well-established regulatory framework that encourages innovation.
Key Drivers for Biopharmaceuticals Dominance:
- High R&D Investment: Significant financial commitment from pharmaceutical and biotechnology companies towards developing new antibody therapies.
- Prevalence of Target Diseases: Rising incidence of cancer, autoimmune diseases, and neurological disorders that are effectively treated with monoclonal antibodies.
- Biologics Manufacturing Infrastructure: Extensive presence of specialized CDMOs and advanced manufacturing facilities.
- Favorable Regulatory Environment: Streamlined approval processes for novel biologics and a supportive ecosystem for clinical trials.
- Technological Advancements: Continuous innovation in antibody engineering, including bispecific antibodies and ADCs, expands therapeutic possibilities.
Regional Dominance (North America):
- Economic Policies: Government initiatives supporting biopharmaceutical innovation and manufacturing, such as tax incentives and grants.
- Infrastructure: Advanced research institutions, a skilled workforce, and well-developed supply chains for raw materials and specialized services.
- Market Share: North America accounts for approximately xx% of the global monoclonal antibody development services market.
- Growth Potential: Continued strong growth driven by an aging population and the relentless pursuit of novel disease treatments.
Within the Type segment, Large-scale development and manufacturing services are experiencing significant demand, driven by the commercialization of successful antibody drugs and the need for high-volume production. However, Medium-scale services are also crucial, supporting the progression of candidates through clinical trials and catering to niche therapeutic areas. The Small-scale segment remains vital for early-stage research, preclinical development, and the production of antibodies for diagnostic assays.
Monoclonal Antibody Development Services Product Landscape
The product landscape in monoclonal antibody development services is characterized by a relentless pursuit of enhanced efficacy, specificity, and reduced immunogenicity. Innovations include the development of bispecific antibodies capable of targeting multiple antigens simultaneously, thereby offering more potent therapeutic effects. Antibody-drug conjugates (ADCs), which link potent cytotoxic drugs to antibodies, represent another significant advancement, enabling targeted delivery of chemotherapy to cancer cells. Furthermore, advancements in protein engineering and display technologies have led to the creation of antibody fragments and engineered proteins with improved binding affinities and pharmacokinetic properties. These innovations are driving the development of novel biologics for a wide array of medical applications.
Key Drivers, Barriers & Challenges in Monoclonal Antibody Development Services
Key Drivers:
- Rising Prevalence of Chronic Diseases: Increasing incidence of cancer, autoimmune disorders, and neurodegenerative diseases fuels demand for targeted therapies.
- Advancements in Biotechnology: Continuous innovation in genetic engineering, cell line development, and bioprocessing technologies.
- Growing Pharmaceutical R&D Investment: Significant global investment in drug discovery and development, with a strong focus on biologics.
- Personalized Medicine Trend: Demand for highly specific and tailored treatments, a forte of monoclonal antibodies.
- Outsourcing to CDMOs: Pharmaceutical companies increasingly rely on specialized service providers for development and manufacturing expertise.
Barriers & Challenges:
- High Development Costs: The lengthy and expensive process of antibody discovery, development, and clinical trials presents a significant financial hurdle.
- Stringent Regulatory Hurdles: Navigating complex and evolving regulatory pathways for biologics approval requires substantial expertise and resources.
- Manufacturing Complexity: Ensuring consistent quality, scalability, and cost-effectiveness in large-scale antibody production.
- Immunogenicity Concerns: Potential for adverse immune responses in patients, necessitating careful antibody design and engineering.
- Competition from Alternative Therapies: Emerging therapeutic modalities like gene therapy and cell therapy present competitive pressures.
- Supply Chain Disruptions: Vulnerability of global supply chains for critical raw materials and reagents, impacting production timelines.
- Intellectual Property Protection: Navigating patent landscapes and ensuring robust IP protection for novel antibody constructs.
Emerging Opportunities in Monoclonal Antibody Development Services
Emerging opportunities lie in the development of novel antibody formats, such as bispecific and trispecific antibodies, for tackling complex diseases and overcoming resistance mechanisms. The expanding application of monoclonal antibodies in non-oncology indications, including infectious diseases, neurological disorders, and rare genetic conditions, presents significant untapped markets. The growing demand for companion diagnostics, which identify patient populations most likely to respond to specific antibody therapies, also opens new avenues. Furthermore, advancements in artificial intelligence and machine learning are revolutionizing antibody design, discovery, and optimization, creating opportunities for faster and more efficient development cycles. The increasing focus on biosimil development for established antibody drugs also presents a growing segment.
Growth Accelerators in the Monoclonal Antibody Development Services Industry
Several key catalysts are accelerating long-term growth in the Monoclonal Antibody Development Services industry. Technological breakthroughs in antibody engineering, such as phage display, hybridoma technology, and recombinant DNA technologies, continue to enhance the discovery and optimization of therapeutic candidates. Strategic partnerships between biopharmaceutical companies and specialized Contract Development and Manufacturing Organizations (CDMOs) are crucial for leveraging expertise, sharing risks, and expanding manufacturing capacities. Market expansion into emerging economies, driven by rising healthcare expenditure and increasing access to advanced medical treatments, also plays a vital role. Furthermore, the continuous pipeline of promising antibody-based drugs in clinical trials, particularly for oncology and autoimmune diseases, ensures a sustained demand for development and manufacturing services.
Key Players Shaping the Monoclonal Antibody Development Services Market
- Eurogentec
- ProSci
- Syd Labs
- Promab
- Antibodies Inc
- Bhat Biotech
- Synaptic Systems
- Covalab
- CePower
- Lampire Biological Laboratories
- Leinco Technologies
- Medimabs
- Davids Bioengineering
- Scantibodies
- Abwiz Bio
- Thermo Fisher Scientific
Notable Milestones in Monoclonal Antibody Development Services Sector
- 2019: Launch of a new generation of bispecific antibodies with enhanced efficacy in cancer treatment.
- 2020: Significant advancements in antibody-drug conjugate (ADC) technologies, leading to more targeted cancer therapies.
- 2021: Increased regulatory approvals for antibody biosimil products, expanding treatment options and reducing healthcare costs.
- 2022: Major investment in AI-driven antibody discovery platforms, accelerating the identification of novel therapeutic candidates.
- 2023: Expansion of CDMO capabilities to meet the growing demand for large-scale antibody manufacturing for commercial products.
- 2024: Emergence of novel antibody formats targeting rare diseases and previously untreatable conditions.
In-Depth Monoclonal Antibody Development Services Market Outlook
The future market outlook for Monoclonal Antibody Development Services is exceptionally promising, driven by a robust pipeline of innovative therapies and a growing global demand for targeted medical treatments. Key growth accelerators include continuous technological advancements in antibody engineering, such as the development of novel antibody formats like bispecific and trispecific antibodies, which offer enhanced therapeutic potential and the ability to overcome treatment resistance. Strategic collaborations and partnerships between biopharmaceutical giants and specialized contract development and manufacturing organizations (CDMOs) will continue to be pivotal, ensuring access to cutting-edge expertise and scalable manufacturing capacities. Furthermore, the expanding reach of monoclonal antibody applications into non-oncology indications, including infectious diseases, autoimmune disorders, and neurological conditions, signifies substantial untapped market potential. The increasing investment in personalized medicine and the growing recognition of biosimilar opportunities further solidify the long-term growth trajectory of this dynamic sector.
Monoclonal Antibody Development Services Segmentation
-
1. Application
- 1.1. Biopharmaceuticals
- 1.2. Medical Diagnosis
- 1.3. Agricultural
- 1.4. Medical Treatment
- 1.5. Environmental monitoring
- 1.6. Others
-
2. Type
- 2.1. Small-scale
- 2.2. Medium-sclae
- 2.3. Large-scale
Monoclonal Antibody Development Services Segmentation By Geography
-
1. North America
- 1.1. United States
- 1.2. Canada
- 1.3. Mexico
-
2. South America
- 2.1. Brazil
- 2.2. Argentina
- 2.3. Rest of South America
-
3. Europe
- 3.1. United Kingdom
- 3.2. Germany
- 3.3. France
- 3.4. Italy
- 3.5. Spain
- 3.6. Russia
- 3.7. Benelux
- 3.8. Nordics
- 3.9. Rest of Europe
-
4. Middle East & Africa
- 4.1. Turkey
- 4.2. Israel
- 4.3. GCC
- 4.4. North Africa
- 4.5. South Africa
- 4.6. Rest of Middle East & Africa
-
5. Asia Pacific
- 5.1. China
- 5.2. India
- 5.3. Japan
- 5.4. South Korea
- 5.5. ASEAN
- 5.6. Oceania
- 5.7. Rest of Asia Pacific
Monoclonal Antibody Development Services REPORT HIGHLIGHTS
| Aspects | Details |
|---|---|
| Study Period | 2019-2033 |
| Base Year | 2024 |
| Estimated Year | 2025 |
| Forecast Period | 2025-2033 |
| Historical Period | 2019-2024 |
| Growth Rate | CAGR of XXX% from 2019-2033 |
| Segmentation |
|
Table of Contents
- 1. Introduction
- 1.1. Research Scope
- 1.2. Market Segmentation
- 1.3. Research Methodology
- 1.4. Definitions and Assumptions
- 2. Executive Summary
- 2.1. Introduction
- 3. Market Dynamics
- 3.1. Introduction
- 3.2. Market Drivers
- 3.3. Market Restrains
- 3.4. Market Trends
- 4. Market Factor Analysis
- 4.1. Porters Five Forces
- 4.2. Supply/Value Chain
- 4.3. PESTEL analysis
- 4.4. Market Entropy
- 4.5. Patent/Trademark Analysis
- 5. Global Monoclonal Antibody Development Services Analysis, Insights and Forecast, 2019-2031
- 5.1. Market Analysis, Insights and Forecast - by Application
- 5.1.1. Biopharmaceuticals
- 5.1.2. Medical Diagnosis
- 5.1.3. Agricultural
- 5.1.4. Medical Treatment
- 5.1.5. Environmental monitoring
- 5.1.6. Others
- 5.2. Market Analysis, Insights and Forecast - by Type
- 5.2.1. Small-scale
- 5.2.2. Medium-sclae
- 5.2.3. Large-scale
- 5.3. Market Analysis, Insights and Forecast - by Region
- 5.3.1. North America
- 5.3.2. South America
- 5.3.3. Europe
- 5.3.4. Middle East & Africa
- 5.3.5. Asia Pacific
- 5.1. Market Analysis, Insights and Forecast - by Application
- 6. North America Monoclonal Antibody Development Services Analysis, Insights and Forecast, 2019-2031
- 6.1. Market Analysis, Insights and Forecast - by Application
- 6.1.1. Biopharmaceuticals
- 6.1.2. Medical Diagnosis
- 6.1.3. Agricultural
- 6.1.4. Medical Treatment
- 6.1.5. Environmental monitoring
- 6.1.6. Others
- 6.2. Market Analysis, Insights and Forecast - by Type
- 6.2.1. Small-scale
- 6.2.2. Medium-sclae
- 6.2.3. Large-scale
- 6.1. Market Analysis, Insights and Forecast - by Application
- 7. South America Monoclonal Antibody Development Services Analysis, Insights and Forecast, 2019-2031
- 7.1. Market Analysis, Insights and Forecast - by Application
- 7.1.1. Biopharmaceuticals
- 7.1.2. Medical Diagnosis
- 7.1.3. Agricultural
- 7.1.4. Medical Treatment
- 7.1.5. Environmental monitoring
- 7.1.6. Others
- 7.2. Market Analysis, Insights and Forecast - by Type
- 7.2.1. Small-scale
- 7.2.2. Medium-sclae
- 7.2.3. Large-scale
- 7.1. Market Analysis, Insights and Forecast - by Application
- 8. Europe Monoclonal Antibody Development Services Analysis, Insights and Forecast, 2019-2031
- 8.1. Market Analysis, Insights and Forecast - by Application
- 8.1.1. Biopharmaceuticals
- 8.1.2. Medical Diagnosis
- 8.1.3. Agricultural
- 8.1.4. Medical Treatment
- 8.1.5. Environmental monitoring
- 8.1.6. Others
- 8.2. Market Analysis, Insights and Forecast - by Type
- 8.2.1. Small-scale
- 8.2.2. Medium-sclae
- 8.2.3. Large-scale
- 8.1. Market Analysis, Insights and Forecast - by Application
- 9. Middle East & Africa Monoclonal Antibody Development Services Analysis, Insights and Forecast, 2019-2031
- 9.1. Market Analysis, Insights and Forecast - by Application
- 9.1.1. Biopharmaceuticals
- 9.1.2. Medical Diagnosis
- 9.1.3. Agricultural
- 9.1.4. Medical Treatment
- 9.1.5. Environmental monitoring
- 9.1.6. Others
- 9.2. Market Analysis, Insights and Forecast - by Type
- 9.2.1. Small-scale
- 9.2.2. Medium-sclae
- 9.2.3. Large-scale
- 9.1. Market Analysis, Insights and Forecast - by Application
- 10. Asia Pacific Monoclonal Antibody Development Services Analysis, Insights and Forecast, 2019-2031
- 10.1. Market Analysis, Insights and Forecast - by Application
- 10.1.1. Biopharmaceuticals
- 10.1.2. Medical Diagnosis
- 10.1.3. Agricultural
- 10.1.4. Medical Treatment
- 10.1.5. Environmental monitoring
- 10.1.6. Others
- 10.2. Market Analysis, Insights and Forecast - by Type
- 10.2.1. Small-scale
- 10.2.2. Medium-sclae
- 10.2.3. Large-scale
- 10.1. Market Analysis, Insights and Forecast - by Application
- 11. Competitive Analysis
- 11.1. Global Market Share Analysis 2024
- 11.2. Company Profiles
- 11.2.1 Eurogentec
- 11.2.1.1. Overview
- 11.2.1.2. Products
- 11.2.1.3. SWOT Analysis
- 11.2.1.4. Recent Developments
- 11.2.1.5. Financials (Based on Availability)
- 11.2.2 ProSci
- 11.2.2.1. Overview
- 11.2.2.2. Products
- 11.2.2.3. SWOT Analysis
- 11.2.2.4. Recent Developments
- 11.2.2.5. Financials (Based on Availability)
- 11.2.3 Syd Labs
- 11.2.3.1. Overview
- 11.2.3.2. Products
- 11.2.3.3. SWOT Analysis
- 11.2.3.4. Recent Developments
- 11.2.3.5. Financials (Based on Availability)
- 11.2.4 Promab
- 11.2.4.1. Overview
- 11.2.4.2. Products
- 11.2.4.3. SWOT Analysis
- 11.2.4.4. Recent Developments
- 11.2.4.5. Financials (Based on Availability)
- 11.2.5 Antibodies Inc
- 11.2.5.1. Overview
- 11.2.5.2. Products
- 11.2.5.3. SWOT Analysis
- 11.2.5.4. Recent Developments
- 11.2.5.5. Financials (Based on Availability)
- 11.2.6 Bhat Biotech
- 11.2.6.1. Overview
- 11.2.6.2. Products
- 11.2.6.3. SWOT Analysis
- 11.2.6.4. Recent Developments
- 11.2.6.5. Financials (Based on Availability)
- 11.2.7 Synaptic Systems
- 11.2.7.1. Overview
- 11.2.7.2. Products
- 11.2.7.3. SWOT Analysis
- 11.2.7.4. Recent Developments
- 11.2.7.5. Financials (Based on Availability)
- 11.2.8 Covalab
- 11.2.8.1. Overview
- 11.2.8.2. Products
- 11.2.8.3. SWOT Analysis
- 11.2.8.4. Recent Developments
- 11.2.8.5. Financials (Based on Availability)
- 11.2.9 CePower
- 11.2.9.1. Overview
- 11.2.9.2. Products
- 11.2.9.3. SWOT Analysis
- 11.2.9.4. Recent Developments
- 11.2.9.5. Financials (Based on Availability)
- 11.2.10 Lampire Biological Laboratories
- 11.2.10.1. Overview
- 11.2.10.2. Products
- 11.2.10.3. SWOT Analysis
- 11.2.10.4. Recent Developments
- 11.2.10.5. Financials (Based on Availability)
- 11.2.11 Leinco Technologies
- 11.2.11.1. Overview
- 11.2.11.2. Products
- 11.2.11.3. SWOT Analysis
- 11.2.11.4. Recent Developments
- 11.2.11.5. Financials (Based on Availability)
- 11.2.12 Medimabs
- 11.2.12.1. Overview
- 11.2.12.2. Products
- 11.2.12.3. SWOT Analysis
- 11.2.12.4. Recent Developments
- 11.2.12.5. Financials (Based on Availability)
- 11.2.13 Davids Bioengineering
- 11.2.13.1. Overview
- 11.2.13.2. Products
- 11.2.13.3. SWOT Analysis
- 11.2.13.4. Recent Developments
- 11.2.13.5. Financials (Based on Availability)
- 11.2.14 Scantibodies
- 11.2.14.1. Overview
- 11.2.14.2. Products
- 11.2.14.3. SWOT Analysis
- 11.2.14.4. Recent Developments
- 11.2.14.5. Financials (Based on Availability)
- 11.2.15 Abwiz Bio
- 11.2.15.1. Overview
- 11.2.15.2. Products
- 11.2.15.3. SWOT Analysis
- 11.2.15.4. Recent Developments
- 11.2.15.5. Financials (Based on Availability)
- 11.2.16 Thermo Fisher Scientific
- 11.2.16.1. Overview
- 11.2.16.2. Products
- 11.2.16.3. SWOT Analysis
- 11.2.16.4. Recent Developments
- 11.2.16.5. Financials (Based on Availability)
- 11.2.1 Eurogentec
List of Figures
- Figure 1: Global Monoclonal Antibody Development Services Revenue Breakdown (million, %) by Region 2024 & 2032
- Figure 2: North America Monoclonal Antibody Development Services Revenue (million), by Application 2024 & 2032
- Figure 3: North America Monoclonal Antibody Development Services Revenue Share (%), by Application 2024 & 2032
- Figure 4: North America Monoclonal Antibody Development Services Revenue (million), by Type 2024 & 2032
- Figure 5: North America Monoclonal Antibody Development Services Revenue Share (%), by Type 2024 & 2032
- Figure 6: North America Monoclonal Antibody Development Services Revenue (million), by Country 2024 & 2032
- Figure 7: North America Monoclonal Antibody Development Services Revenue Share (%), by Country 2024 & 2032
- Figure 8: South America Monoclonal Antibody Development Services Revenue (million), by Application 2024 & 2032
- Figure 9: South America Monoclonal Antibody Development Services Revenue Share (%), by Application 2024 & 2032
- Figure 10: South America Monoclonal Antibody Development Services Revenue (million), by Type 2024 & 2032
- Figure 11: South America Monoclonal Antibody Development Services Revenue Share (%), by Type 2024 & 2032
- Figure 12: South America Monoclonal Antibody Development Services Revenue (million), by Country 2024 & 2032
- Figure 13: South America Monoclonal Antibody Development Services Revenue Share (%), by Country 2024 & 2032
- Figure 14: Europe Monoclonal Antibody Development Services Revenue (million), by Application 2024 & 2032
- Figure 15: Europe Monoclonal Antibody Development Services Revenue Share (%), by Application 2024 & 2032
- Figure 16: Europe Monoclonal Antibody Development Services Revenue (million), by Type 2024 & 2032
- Figure 17: Europe Monoclonal Antibody Development Services Revenue Share (%), by Type 2024 & 2032
- Figure 18: Europe Monoclonal Antibody Development Services Revenue (million), by Country 2024 & 2032
- Figure 19: Europe Monoclonal Antibody Development Services Revenue Share (%), by Country 2024 & 2032
- Figure 20: Middle East & Africa Monoclonal Antibody Development Services Revenue (million), by Application 2024 & 2032
- Figure 21: Middle East & Africa Monoclonal Antibody Development Services Revenue Share (%), by Application 2024 & 2032
- Figure 22: Middle East & Africa Monoclonal Antibody Development Services Revenue (million), by Type 2024 & 2032
- Figure 23: Middle East & Africa Monoclonal Antibody Development Services Revenue Share (%), by Type 2024 & 2032
- Figure 24: Middle East & Africa Monoclonal Antibody Development Services Revenue (million), by Country 2024 & 2032
- Figure 25: Middle East & Africa Monoclonal Antibody Development Services Revenue Share (%), by Country 2024 & 2032
- Figure 26: Asia Pacific Monoclonal Antibody Development Services Revenue (million), by Application 2024 & 2032
- Figure 27: Asia Pacific Monoclonal Antibody Development Services Revenue Share (%), by Application 2024 & 2032
- Figure 28: Asia Pacific Monoclonal Antibody Development Services Revenue (million), by Type 2024 & 2032
- Figure 29: Asia Pacific Monoclonal Antibody Development Services Revenue Share (%), by Type 2024 & 2032
- Figure 30: Asia Pacific Monoclonal Antibody Development Services Revenue (million), by Country 2024 & 2032
- Figure 31: Asia Pacific Monoclonal Antibody Development Services Revenue Share (%), by Country 2024 & 2032
List of Tables
- Table 1: Global Monoclonal Antibody Development Services Revenue million Forecast, by Region 2019 & 2032
- Table 2: Global Monoclonal Antibody Development Services Revenue million Forecast, by Application 2019 & 2032
- Table 3: Global Monoclonal Antibody Development Services Revenue million Forecast, by Type 2019 & 2032
- Table 4: Global Monoclonal Antibody Development Services Revenue million Forecast, by Region 2019 & 2032
- Table 5: Global Monoclonal Antibody Development Services Revenue million Forecast, by Application 2019 & 2032
- Table 6: Global Monoclonal Antibody Development Services Revenue million Forecast, by Type 2019 & 2032
- Table 7: Global Monoclonal Antibody Development Services Revenue million Forecast, by Country 2019 & 2032
- Table 8: United States Monoclonal Antibody Development Services Revenue (million) Forecast, by Application 2019 & 2032
- Table 9: Canada Monoclonal Antibody Development Services Revenue (million) Forecast, by Application 2019 & 2032
- Table 10: Mexico Monoclonal Antibody Development Services Revenue (million) Forecast, by Application 2019 & 2032
- Table 11: Global Monoclonal Antibody Development Services Revenue million Forecast, by Application 2019 & 2032
- Table 12: Global Monoclonal Antibody Development Services Revenue million Forecast, by Type 2019 & 2032
- Table 13: Global Monoclonal Antibody Development Services Revenue million Forecast, by Country 2019 & 2032
- Table 14: Brazil Monoclonal Antibody Development Services Revenue (million) Forecast, by Application 2019 & 2032
- Table 15: Argentina Monoclonal Antibody Development Services Revenue (million) Forecast, by Application 2019 & 2032
- Table 16: Rest of South America Monoclonal Antibody Development Services Revenue (million) Forecast, by Application 2019 & 2032
- Table 17: Global Monoclonal Antibody Development Services Revenue million Forecast, by Application 2019 & 2032
- Table 18: Global Monoclonal Antibody Development Services Revenue million Forecast, by Type 2019 & 2032
- Table 19: Global Monoclonal Antibody Development Services Revenue million Forecast, by Country 2019 & 2032
- Table 20: United Kingdom Monoclonal Antibody Development Services Revenue (million) Forecast, by Application 2019 & 2032
- Table 21: Germany Monoclonal Antibody Development Services Revenue (million) Forecast, by Application 2019 & 2032
- Table 22: France Monoclonal Antibody Development Services Revenue (million) Forecast, by Application 2019 & 2032
- Table 23: Italy Monoclonal Antibody Development Services Revenue (million) Forecast, by Application 2019 & 2032
- Table 24: Spain Monoclonal Antibody Development Services Revenue (million) Forecast, by Application 2019 & 2032
- Table 25: Russia Monoclonal Antibody Development Services Revenue (million) Forecast, by Application 2019 & 2032
- Table 26: Benelux Monoclonal Antibody Development Services Revenue (million) Forecast, by Application 2019 & 2032
- Table 27: Nordics Monoclonal Antibody Development Services Revenue (million) Forecast, by Application 2019 & 2032
- Table 28: Rest of Europe Monoclonal Antibody Development Services Revenue (million) Forecast, by Application 2019 & 2032
- Table 29: Global Monoclonal Antibody Development Services Revenue million Forecast, by Application 2019 & 2032
- Table 30: Global Monoclonal Antibody Development Services Revenue million Forecast, by Type 2019 & 2032
- Table 31: Global Monoclonal Antibody Development Services Revenue million Forecast, by Country 2019 & 2032
- Table 32: Turkey Monoclonal Antibody Development Services Revenue (million) Forecast, by Application 2019 & 2032
- Table 33: Israel Monoclonal Antibody Development Services Revenue (million) Forecast, by Application 2019 & 2032
- Table 34: GCC Monoclonal Antibody Development Services Revenue (million) Forecast, by Application 2019 & 2032
- Table 35: North Africa Monoclonal Antibody Development Services Revenue (million) Forecast, by Application 2019 & 2032
- Table 36: South Africa Monoclonal Antibody Development Services Revenue (million) Forecast, by Application 2019 & 2032
- Table 37: Rest of Middle East & Africa Monoclonal Antibody Development Services Revenue (million) Forecast, by Application 2019 & 2032
- Table 38: Global Monoclonal Antibody Development Services Revenue million Forecast, by Application 2019 & 2032
- Table 39: Global Monoclonal Antibody Development Services Revenue million Forecast, by Type 2019 & 2032
- Table 40: Global Monoclonal Antibody Development Services Revenue million Forecast, by Country 2019 & 2032
- Table 41: China Monoclonal Antibody Development Services Revenue (million) Forecast, by Application 2019 & 2032
- Table 42: India Monoclonal Antibody Development Services Revenue (million) Forecast, by Application 2019 & 2032
- Table 43: Japan Monoclonal Antibody Development Services Revenue (million) Forecast, by Application 2019 & 2032
- Table 44: South Korea Monoclonal Antibody Development Services Revenue (million) Forecast, by Application 2019 & 2032
- Table 45: ASEAN Monoclonal Antibody Development Services Revenue (million) Forecast, by Application 2019 & 2032
- Table 46: Oceania Monoclonal Antibody Development Services Revenue (million) Forecast, by Application 2019 & 2032
- Table 47: Rest of Asia Pacific Monoclonal Antibody Development Services Revenue (million) Forecast, by Application 2019 & 2032
Frequently Asked Questions
1. What is the projected Compound Annual Growth Rate (CAGR) of the Monoclonal Antibody Development Services?
The projected CAGR is approximately XXX%.
2. Which companies are prominent players in the Monoclonal Antibody Development Services?
Key companies in the market include Eurogentec, ProSci, Syd Labs, Promab, Antibodies Inc, Bhat Biotech, Synaptic Systems, Covalab, CePower, Lampire Biological Laboratories, Leinco Technologies, Medimabs, Davids Bioengineering, Scantibodies, Abwiz Bio, Thermo Fisher Scientific.
3. What are the main segments of the Monoclonal Antibody Development Services?
The market segments include Application, Type.
4. Can you provide details about the market size?
The market size is estimated to be USD XXX million as of 2022.
5. What are some drivers contributing to market growth?
N/A
6. What are the notable trends driving market growth?
N/A
7. Are there any restraints impacting market growth?
N/A
8. Can you provide examples of recent developments in the market?
N/A
9. What pricing options are available for accessing the report?
Pricing options include single-user, multi-user, and enterprise licenses priced at USD 3950.00, USD 5925.00, and USD 7900.00 respectively.
10. Is the market size provided in terms of value or volume?
The market size is provided in terms of value, measured in million.
11. Are there any specific market keywords associated with the report?
Yes, the market keyword associated with the report is "Monoclonal Antibody Development Services," which aids in identifying and referencing the specific market segment covered.
12. How do I determine which pricing option suits my needs best?
The pricing options vary based on user requirements and access needs. Individual users may opt for single-user licenses, while businesses requiring broader access may choose multi-user or enterprise licenses for cost-effective access to the report.
13. Are there any additional resources or data provided in the Monoclonal Antibody Development Services report?
While the report offers comprehensive insights, it's advisable to review the specific contents or supplementary materials provided to ascertain if additional resources or data are available.
14. How can I stay updated on further developments or reports in the Monoclonal Antibody Development Services?
To stay informed about further developments, trends, and reports in the Monoclonal Antibody Development Services, consider subscribing to industry newsletters, following relevant companies and organizations, or regularly checking reputable industry news sources and publications.
Methodology
Step 1 - Identification of Relevant Samples Size from Population Database


Step 2 - Approaches for Defining Global Market Size (Value, Volume* & Price*)

Note*: In applicable scenarios
Step 3 - Data Sources
Primary Research
- Web Analytics
- Survey Reports
- Research Institute
- Latest Research Reports
- Opinion Leaders
Secondary Research
- Annual Reports
- White Paper
- Latest Press Release
- Industry Association
- Paid Database
- Investor Presentations

Step 4 - Data Triangulation
Involves using different sources of information in order to increase the validity of a study
These sources are likely to be stakeholders in a program - participants, other researchers, program staff, other community members, and so on.
Then we put all data in single framework & apply various statistical tools to find out the dynamic on the market.
During the analysis stage, feedback from the stakeholder groups would be compared to determine areas of agreement as well as areas of divergence
