

Key Insights
The global peritoneal dialysis (PD) solutions market is experiencing robust growth, driven by an increasing prevalence of chronic kidney disease (CKD) and end-stage renal disease (ESRD), particularly in aging populations worldwide. Technological advancements in PD solutions, such as automated PD systems and improved dialysate formulations, are enhancing treatment efficacy and patient convenience, fueling market expansion. The preference for home-based dialysis therapies, offering greater patient autonomy and reduced healthcare costs compared to hemodialysis, further boosts market demand. Key players like Baxter, Fresenius, B. Braun, and Terumo are strategically investing in research and development, expanding their product portfolios, and forging strategic partnerships to consolidate their market positions. The market is segmented based on product type (solutions, equipment, and accessories), modality (continuous ambulatory peritoneal dialysis (CAPD) and automated peritoneal dialysis (APD)), and end-user (hospitals, clinics, and homecare settings). Competition is intense, with established players facing challenges from emerging regional manufacturers. However, the overall market outlook remains positive, with substantial growth opportunities projected over the forecast period due to continued innovation and increasing healthcare spending globally.
Despite the positive trajectory, challenges persist. High treatment costs, coupled with complexities associated with PD therapy, especially regarding infection risks and patient adherence, may hinder market growth in certain regions. Moreover, variations in healthcare infrastructure and reimbursement policies across different countries create regional disparities in market penetration. Addressing these challenges through improved patient education, streamlined treatment protocols, and increased affordability initiatives will be crucial for maximizing market potential. Future growth will likely be influenced by the adoption of novel technologies, such as biocompatible dialysate solutions and integrated monitoring systems, aimed at enhancing patient safety and outcomes. The market's future success relies on a multi-pronged approach that addresses both the technological and accessibility aspects of PD therapy.
Peritoneal Dialysis Solutions Market Report: 2019-2033
This comprehensive report provides a detailed analysis of the global peritoneal dialysis solutions market, encompassing market dynamics, growth trends, regional segmentation, competitive landscape, and future outlook. The study period covers 2019-2033, with 2025 as the base and estimated year. The forecast period spans 2025-2033, and the historical period is 2019-2024. This report is invaluable for industry professionals, investors, and researchers seeking a deep understanding of this vital sector of the healthcare industry (Parent Market: Renal Care; Child Market: Dialysis Solutions). The market size is valued in million units.
Peritoneal Dialysis Solutions Market Dynamics & Structure
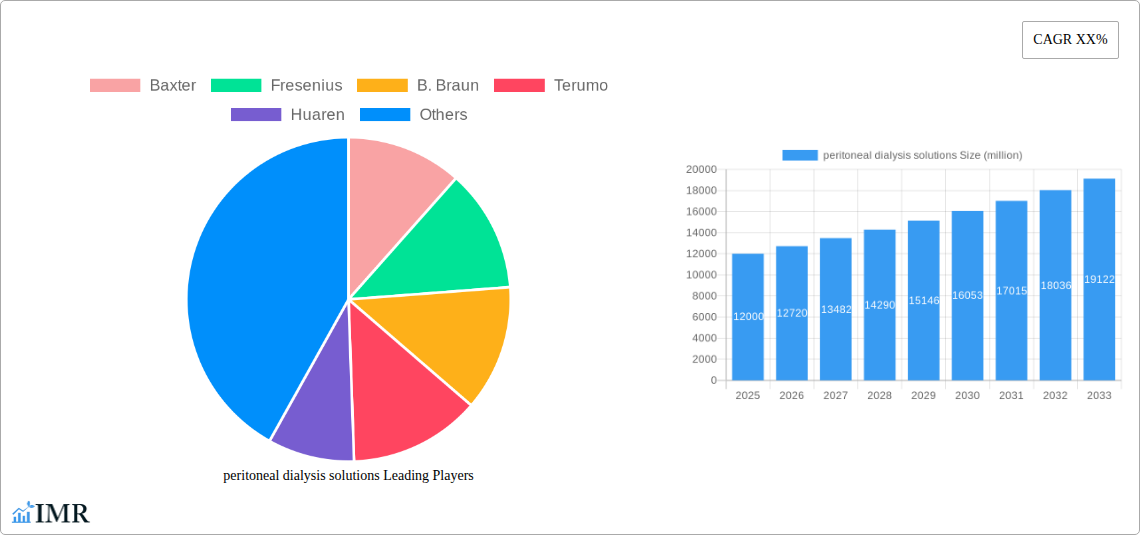
The peritoneal dialysis solutions market is characterized by moderate concentration, with key players like Baxter, Fresenius, B. Braun, and Terumo holding significant market share. Technological innovation, particularly in automated systems and biocompatible solutions, is a key driver. Regulatory frameworks vary across regions, impacting market access and pricing. Competitive substitutes include hemodialysis, but peritoneal dialysis offers advantages in convenience and home-based treatment. End-user demographics are shifting towards an older population with higher prevalence of chronic kidney disease. M&A activity has been relatively limited in recent years, with xx deals recorded between 2019 and 2024.
- Market Concentration: Moderately concentrated, with top 4 players holding approximately xx% market share in 2024.
- Technological Innovation: Focus on automated systems, improved biocompatibility, and simplified solutions.
- Regulatory Landscape: Varying regulations across regions impacting market access and pricing strategies.
- Competitive Substitutes: Primarily hemodialysis; peritoneal dialysis offers convenience and home-based treatment.
- End-User Demographics: Aging population with increasing prevalence of chronic kidney disease driving market growth.
- M&A Activity: xx deals between 2019 and 2024, indicating consolidation opportunities. Further M&A is predicted for the next decade.
Peritoneal Dialysis Solutions Growth Trends & Insights
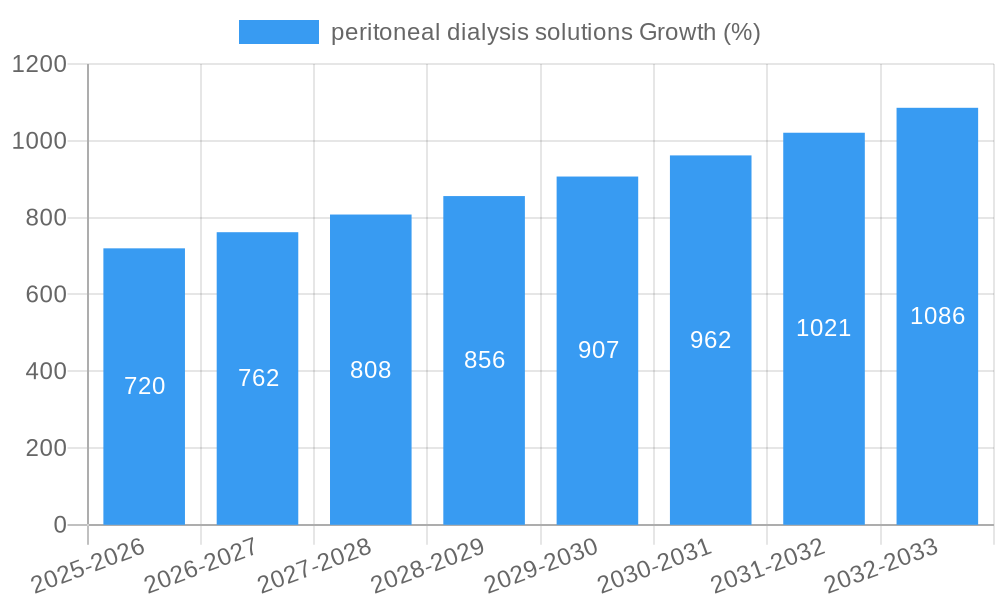
The global peritoneal dialysis solutions market witnessed a CAGR of xx% during the historical period (2019-2024), reaching a market size of xx million units in 2024. Adoption rates vary significantly across regions, influenced by factors such as healthcare infrastructure, reimbursement policies, and physician preferences. Technological advancements, particularly in automated peritoneal dialysis (APD) systems, have significantly impacted market growth. Consumer behavior shifts towards greater patient empowerment and preference for home-based treatments are further boosting demand. The market is projected to experience continued growth, with a forecasted CAGR of xx% from 2025 to 2033, reaching xx million units by 2033. Market penetration is expected to increase, particularly in emerging markets.
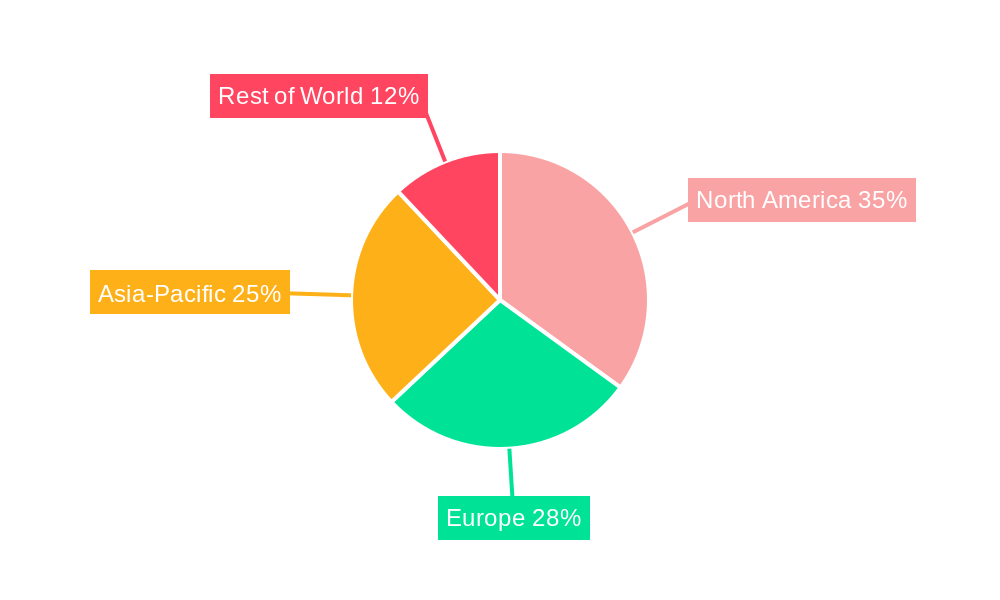
Dominant Regions, Countries, or Segments in Peritoneal Dialysis Solutions
North America currently holds the largest market share in peritoneal dialysis solutions, driven by high prevalence of chronic kidney disease, advanced healthcare infrastructure, and robust reimbursement policies. However, Asia-Pacific is projected to witness the fastest growth rate during the forecast period, fueled by rising incidence of chronic kidney disease, increasing healthcare expenditure, and expanding access to dialysis treatments. Within Asia-Pacific, China and India are expected to be key growth drivers.
- North America: High prevalence of CKD, advanced healthcare infrastructure, and robust reimbursement.
- Europe: Established market with moderate growth, driven by technological advancements and aging population.
- Asia-Pacific: Fastest-growing region, driven by rising CKD incidence, increasing healthcare expenditure, and expanding access to dialysis treatments.
- Latin America: Moderate growth potential, influenced by improving healthcare infrastructure and increasing awareness of CKD.
- Middle East & Africa: Relatively smaller market with significant growth potential, challenged by limited access to healthcare and high cost of treatment.
Peritoneal Dialysis Solutions Product Landscape
The market offers a range of solutions, including automated peritoneal dialysis (APD) systems, cycler machines, and various dialysis solutions. Recent innovations focus on improving biocompatibility, reducing infection rates, and enhancing patient convenience. Key selling propositions include ease of use, portability, and cost-effectiveness compared to hemodialysis in specific scenarios. Technological advancements like smart sensors and remote monitoring capabilities are transforming the patient experience.
Key Drivers, Barriers & Challenges in Peritoneal Dialysis Solutions
Key Drivers:
- Rising prevalence of chronic kidney disease globally.
- Increasing adoption of home-based dialysis treatments.
- Technological advancements in APD systems and dialysis solutions.
- Favorable reimbursement policies in certain regions.
Key Challenges:
- High cost of treatment limiting access in several regions.
- Risk of peritonitis and other complications.
- Need for skilled healthcare professionals for training and support.
- Stringent regulatory hurdles for new product approvals. This has resulted in a xx% decrease in new product launches between 2022 and 2024.
Emerging Opportunities in Peritoneal Dialysis Solutions
- Expansion into untapped markets in developing countries.
- Development of novel biocompatible dialysis solutions.
- Integration of digital health technologies for remote patient monitoring.
- Personalized treatment approaches based on individual patient needs.
Growth Accelerators in the Peritoneal Dialysis Solutions Industry
Technological breakthroughs in APD systems, coupled with strategic partnerships between manufacturers and healthcare providers, are key catalysts for long-term market growth. Expanding access to dialysis services in underserved regions, driven by governmental initiatives and private investments, will further propel market expansion. Innovations in biocompatible materials and improved patient education programs will also contribute to market growth.
Key Players Shaping the Peritoneal Dialysis Solutions Market
- Baxter
- Fresenius Medical Care
- B. Braun
- Terumo
- Huaren
- CR Double-Crane
- Qingshan Likang
- Tj Tianan
Notable Milestones in Peritoneal Dialysis Solutions Sector
- 2021: Baxter launched a new automated peritoneal dialysis system with enhanced features.
- 2022: Fresenius Medical Care acquired a smaller dialysis solutions provider, expanding its product portfolio.
- 2023: New regulatory approvals for biocompatible dialysis solutions in key markets.
- 2024: Increased investment in research and development of novel dialysis technologies.
In-Depth Peritoneal Dialysis Solutions Market Outlook
The peritoneal dialysis solutions market is poised for continued growth, driven by several factors including the rising prevalence of chronic kidney disease, technological advancements, and increasing adoption of home-based dialysis. Strategic partnerships, expansion into new markets, and further technological innovations will create significant opportunities for market players. The market's future potential is substantial, offering lucrative prospects for investors and stakeholders alike.
peritoneal dialysis solutions Segmentation
-
1. Application
- 1.1. CAPD
- 1.2. APD
-
2. Types
- 2.1. Containing 1.5% Glucose Type
- 2.2. Containing 2.5% Glucose Type
- 2.3. Containing 4.25% Glucose Type
peritoneal dialysis solutions Segmentation By Geography
-
1. North America
- 1.1. United States
- 1.2. Canada
- 1.3. Mexico
-
2. South America
- 2.1. Brazil
- 2.2. Argentina
- 2.3. Rest of South America
-
3. Europe
- 3.1. United Kingdom
- 3.2. Germany
- 3.3. France
- 3.4. Italy
- 3.5. Spain
- 3.6. Russia
- 3.7. Benelux
- 3.8. Nordics
- 3.9. Rest of Europe
-
4. Middle East & Africa
- 4.1. Turkey
- 4.2. Israel
- 4.3. GCC
- 4.4. North Africa
- 4.5. South Africa
- 4.6. Rest of Middle East & Africa
-
5. Asia Pacific
- 5.1. China
- 5.2. India
- 5.3. Japan
- 5.4. South Korea
- 5.5. ASEAN
- 5.6. Oceania
- 5.7. Rest of Asia Pacific
peritoneal dialysis solutions REPORT HIGHLIGHTS
| Aspects | Details |
|---|---|
| Study Period | 2019-2033 |
| Base Year | 2024 |
| Estimated Year | 2025 |
| Forecast Period | 2025-2033 |
| Historical Period | 2019-2024 |
| Growth Rate | CAGR of XX% from 2019-2033 |
| Segmentation |
|
Table of Contents
- 1. Introduction
- 1.1. Research Scope
- 1.2. Market Segmentation
- 1.3. Research Methodology
- 1.4. Definitions and Assumptions
- 2. Executive Summary
- 2.1. Introduction
- 3. Market Dynamics
- 3.1. Introduction
- 3.2. Market Drivers
- 3.3. Market Restrains
- 3.4. Market Trends
- 4. Market Factor Analysis
- 4.1. Porters Five Forces
- 4.2. Supply/Value Chain
- 4.3. PESTEL analysis
- 4.4. Market Entropy
- 4.5. Patent/Trademark Analysis
- 5. Global peritoneal dialysis solutions Analysis, Insights and Forecast, 2019-2031
- 5.1. Market Analysis, Insights and Forecast - by Application
- 5.1.1. CAPD
- 5.1.2. APD
- 5.2. Market Analysis, Insights and Forecast - by Types
- 5.2.1. Containing 1.5% Glucose Type
- 5.2.2. Containing 2.5% Glucose Type
- 5.2.3. Containing 4.25% Glucose Type
- 5.3. Market Analysis, Insights and Forecast - by Region
- 5.3.1. North America
- 5.3.2. South America
- 5.3.3. Europe
- 5.3.4. Middle East & Africa
- 5.3.5. Asia Pacific
- 5.1. Market Analysis, Insights and Forecast - by Application
- 6. North America peritoneal dialysis solutions Analysis, Insights and Forecast, 2019-2031
- 6.1. Market Analysis, Insights and Forecast - by Application
- 6.1.1. CAPD
- 6.1.2. APD
- 6.2. Market Analysis, Insights and Forecast - by Types
- 6.2.1. Containing 1.5% Glucose Type
- 6.2.2. Containing 2.5% Glucose Type
- 6.2.3. Containing 4.25% Glucose Type
- 6.1. Market Analysis, Insights and Forecast - by Application
- 7. South America peritoneal dialysis solutions Analysis, Insights and Forecast, 2019-2031
- 7.1. Market Analysis, Insights and Forecast - by Application
- 7.1.1. CAPD
- 7.1.2. APD
- 7.2. Market Analysis, Insights and Forecast - by Types
- 7.2.1. Containing 1.5% Glucose Type
- 7.2.2. Containing 2.5% Glucose Type
- 7.2.3. Containing 4.25% Glucose Type
- 7.1. Market Analysis, Insights and Forecast - by Application
- 8. Europe peritoneal dialysis solutions Analysis, Insights and Forecast, 2019-2031
- 8.1. Market Analysis, Insights and Forecast - by Application
- 8.1.1. CAPD
- 8.1.2. APD
- 8.2. Market Analysis, Insights and Forecast - by Types
- 8.2.1. Containing 1.5% Glucose Type
- 8.2.2. Containing 2.5% Glucose Type
- 8.2.3. Containing 4.25% Glucose Type
- 8.1. Market Analysis, Insights and Forecast - by Application
- 9. Middle East & Africa peritoneal dialysis solutions Analysis, Insights and Forecast, 2019-2031
- 9.1. Market Analysis, Insights and Forecast - by Application
- 9.1.1. CAPD
- 9.1.2. APD
- 9.2. Market Analysis, Insights and Forecast - by Types
- 9.2.1. Containing 1.5% Glucose Type
- 9.2.2. Containing 2.5% Glucose Type
- 9.2.3. Containing 4.25% Glucose Type
- 9.1. Market Analysis, Insights and Forecast - by Application
- 10. Asia Pacific peritoneal dialysis solutions Analysis, Insights and Forecast, 2019-2031
- 10.1. Market Analysis, Insights and Forecast - by Application
- 10.1.1. CAPD
- 10.1.2. APD
- 10.2. Market Analysis, Insights and Forecast - by Types
- 10.2.1. Containing 1.5% Glucose Type
- 10.2.2. Containing 2.5% Glucose Type
- 10.2.3. Containing 4.25% Glucose Type
- 10.1. Market Analysis, Insights and Forecast - by Application
- 11. Competitive Analysis
- 11.1. Global Market Share Analysis 2024
- 11.2. Company Profiles
- 11.2.1 Baxter
- 11.2.1.1. Overview
- 11.2.1.2. Products
- 11.2.1.3. SWOT Analysis
- 11.2.1.4. Recent Developments
- 11.2.1.5. Financials (Based on Availability)
- 11.2.2 Fresenius
- 11.2.2.1. Overview
- 11.2.2.2. Products
- 11.2.2.3. SWOT Analysis
- 11.2.2.4. Recent Developments
- 11.2.2.5. Financials (Based on Availability)
- 11.2.3 B. Braun
- 11.2.3.1. Overview
- 11.2.3.2. Products
- 11.2.3.3. SWOT Analysis
- 11.2.3.4. Recent Developments
- 11.2.3.5. Financials (Based on Availability)
- 11.2.4 Terumo
- 11.2.4.1. Overview
- 11.2.4.2. Products
- 11.2.4.3. SWOT Analysis
- 11.2.4.4. Recent Developments
- 11.2.4.5. Financials (Based on Availability)
- 11.2.5 Huaren
- 11.2.5.1. Overview
- 11.2.5.2. Products
- 11.2.5.3. SWOT Analysis
- 11.2.5.4. Recent Developments
- 11.2.5.5. Financials (Based on Availability)
- 11.2.6 CR Double-Crane
- 11.2.6.1. Overview
- 11.2.6.2. Products
- 11.2.6.3. SWOT Analysis
- 11.2.6.4. Recent Developments
- 11.2.6.5. Financials (Based on Availability)
- 11.2.7 Qingshan Likang
- 11.2.7.1. Overview
- 11.2.7.2. Products
- 11.2.7.3. SWOT Analysis
- 11.2.7.4. Recent Developments
- 11.2.7.5. Financials (Based on Availability)
- 11.2.8 Tj Tianan
- 11.2.8.1. Overview
- 11.2.8.2. Products
- 11.2.8.3. SWOT Analysis
- 11.2.8.4. Recent Developments
- 11.2.8.5. Financials (Based on Availability)
- 11.2.1 Baxter
List of Figures
- Figure 1: Global peritoneal dialysis solutions Revenue Breakdown (million, %) by Region 2024 & 2032
- Figure 2: Global peritoneal dialysis solutions Volume Breakdown (K, %) by Region 2024 & 2032
- Figure 3: North America peritoneal dialysis solutions Revenue (million), by Application 2024 & 2032
- Figure 4: North America peritoneal dialysis solutions Volume (K), by Application 2024 & 2032
- Figure 5: North America peritoneal dialysis solutions Revenue Share (%), by Application 2024 & 2032
- Figure 6: North America peritoneal dialysis solutions Volume Share (%), by Application 2024 & 2032
- Figure 7: North America peritoneal dialysis solutions Revenue (million), by Types 2024 & 2032
- Figure 8: North America peritoneal dialysis solutions Volume (K), by Types 2024 & 2032
- Figure 9: North America peritoneal dialysis solutions Revenue Share (%), by Types 2024 & 2032
- Figure 10: North America peritoneal dialysis solutions Volume Share (%), by Types 2024 & 2032
- Figure 11: North America peritoneal dialysis solutions Revenue (million), by Country 2024 & 2032
- Figure 12: North America peritoneal dialysis solutions Volume (K), by Country 2024 & 2032
- Figure 13: North America peritoneal dialysis solutions Revenue Share (%), by Country 2024 & 2032
- Figure 14: North America peritoneal dialysis solutions Volume Share (%), by Country 2024 & 2032
- Figure 15: South America peritoneal dialysis solutions Revenue (million), by Application 2024 & 2032
- Figure 16: South America peritoneal dialysis solutions Volume (K), by Application 2024 & 2032
- Figure 17: South America peritoneal dialysis solutions Revenue Share (%), by Application 2024 & 2032
- Figure 18: South America peritoneal dialysis solutions Volume Share (%), by Application 2024 & 2032
- Figure 19: South America peritoneal dialysis solutions Revenue (million), by Types 2024 & 2032
- Figure 20: South America peritoneal dialysis solutions Volume (K), by Types 2024 & 2032
- Figure 21: South America peritoneal dialysis solutions Revenue Share (%), by Types 2024 & 2032
- Figure 22: South America peritoneal dialysis solutions Volume Share (%), by Types 2024 & 2032
- Figure 23: South America peritoneal dialysis solutions Revenue (million), by Country 2024 & 2032
- Figure 24: South America peritoneal dialysis solutions Volume (K), by Country 2024 & 2032
- Figure 25: South America peritoneal dialysis solutions Revenue Share (%), by Country 2024 & 2032
- Figure 26: South America peritoneal dialysis solutions Volume Share (%), by Country 2024 & 2032
- Figure 27: Europe peritoneal dialysis solutions Revenue (million), by Application 2024 & 2032
- Figure 28: Europe peritoneal dialysis solutions Volume (K), by Application 2024 & 2032
- Figure 29: Europe peritoneal dialysis solutions Revenue Share (%), by Application 2024 & 2032
- Figure 30: Europe peritoneal dialysis solutions Volume Share (%), by Application 2024 & 2032
- Figure 31: Europe peritoneal dialysis solutions Revenue (million), by Types 2024 & 2032
- Figure 32: Europe peritoneal dialysis solutions Volume (K), by Types 2024 & 2032
- Figure 33: Europe peritoneal dialysis solutions Revenue Share (%), by Types 2024 & 2032
- Figure 34: Europe peritoneal dialysis solutions Volume Share (%), by Types 2024 & 2032
- Figure 35: Europe peritoneal dialysis solutions Revenue (million), by Country 2024 & 2032
- Figure 36: Europe peritoneal dialysis solutions Volume (K), by Country 2024 & 2032
- Figure 37: Europe peritoneal dialysis solutions Revenue Share (%), by Country 2024 & 2032
- Figure 38: Europe peritoneal dialysis solutions Volume Share (%), by Country 2024 & 2032
- Figure 39: Middle East & Africa peritoneal dialysis solutions Revenue (million), by Application 2024 & 2032
- Figure 40: Middle East & Africa peritoneal dialysis solutions Volume (K), by Application 2024 & 2032
- Figure 41: Middle East & Africa peritoneal dialysis solutions Revenue Share (%), by Application 2024 & 2032
- Figure 42: Middle East & Africa peritoneal dialysis solutions Volume Share (%), by Application 2024 & 2032
- Figure 43: Middle East & Africa peritoneal dialysis solutions Revenue (million), by Types 2024 & 2032
- Figure 44: Middle East & Africa peritoneal dialysis solutions Volume (K), by Types 2024 & 2032
- Figure 45: Middle East & Africa peritoneal dialysis solutions Revenue Share (%), by Types 2024 & 2032
- Figure 46: Middle East & Africa peritoneal dialysis solutions Volume Share (%), by Types 2024 & 2032
- Figure 47: Middle East & Africa peritoneal dialysis solutions Revenue (million), by Country 2024 & 2032
- Figure 48: Middle East & Africa peritoneal dialysis solutions Volume (K), by Country 2024 & 2032
- Figure 49: Middle East & Africa peritoneal dialysis solutions Revenue Share (%), by Country 2024 & 2032
- Figure 50: Middle East & Africa peritoneal dialysis solutions Volume Share (%), by Country 2024 & 2032
- Figure 51: Asia Pacific peritoneal dialysis solutions Revenue (million), by Application 2024 & 2032
- Figure 52: Asia Pacific peritoneal dialysis solutions Volume (K), by Application 2024 & 2032
- Figure 53: Asia Pacific peritoneal dialysis solutions Revenue Share (%), by Application 2024 & 2032
- Figure 54: Asia Pacific peritoneal dialysis solutions Volume Share (%), by Application 2024 & 2032
- Figure 55: Asia Pacific peritoneal dialysis solutions Revenue (million), by Types 2024 & 2032
- Figure 56: Asia Pacific peritoneal dialysis solutions Volume (K), by Types 2024 & 2032
- Figure 57: Asia Pacific peritoneal dialysis solutions Revenue Share (%), by Types 2024 & 2032
- Figure 58: Asia Pacific peritoneal dialysis solutions Volume Share (%), by Types 2024 & 2032
- Figure 59: Asia Pacific peritoneal dialysis solutions Revenue (million), by Country 2024 & 2032
- Figure 60: Asia Pacific peritoneal dialysis solutions Volume (K), by Country 2024 & 2032
- Figure 61: Asia Pacific peritoneal dialysis solutions Revenue Share (%), by Country 2024 & 2032
- Figure 62: Asia Pacific peritoneal dialysis solutions Volume Share (%), by Country 2024 & 2032
List of Tables
- Table 1: Global peritoneal dialysis solutions Revenue million Forecast, by Region 2019 & 2032
- Table 2: Global peritoneal dialysis solutions Volume K Forecast, by Region 2019 & 2032
- Table 3: Global peritoneal dialysis solutions Revenue million Forecast, by Application 2019 & 2032
- Table 4: Global peritoneal dialysis solutions Volume K Forecast, by Application 2019 & 2032
- Table 5: Global peritoneal dialysis solutions Revenue million Forecast, by Types 2019 & 2032
- Table 6: Global peritoneal dialysis solutions Volume K Forecast, by Types 2019 & 2032
- Table 7: Global peritoneal dialysis solutions Revenue million Forecast, by Region 2019 & 2032
- Table 8: Global peritoneal dialysis solutions Volume K Forecast, by Region 2019 & 2032
- Table 9: Global peritoneal dialysis solutions Revenue million Forecast, by Application 2019 & 2032
- Table 10: Global peritoneal dialysis solutions Volume K Forecast, by Application 2019 & 2032
- Table 11: Global peritoneal dialysis solutions Revenue million Forecast, by Types 2019 & 2032
- Table 12: Global peritoneal dialysis solutions Volume K Forecast, by Types 2019 & 2032
- Table 13: Global peritoneal dialysis solutions Revenue million Forecast, by Country 2019 & 2032
- Table 14: Global peritoneal dialysis solutions Volume K Forecast, by Country 2019 & 2032
- Table 15: United States peritoneal dialysis solutions Revenue (million) Forecast, by Application 2019 & 2032
- Table 16: United States peritoneal dialysis solutions Volume (K) Forecast, by Application 2019 & 2032
- Table 17: Canada peritoneal dialysis solutions Revenue (million) Forecast, by Application 2019 & 2032
- Table 18: Canada peritoneal dialysis solutions Volume (K) Forecast, by Application 2019 & 2032
- Table 19: Mexico peritoneal dialysis solutions Revenue (million) Forecast, by Application 2019 & 2032
- Table 20: Mexico peritoneal dialysis solutions Volume (K) Forecast, by Application 2019 & 2032
- Table 21: Global peritoneal dialysis solutions Revenue million Forecast, by Application 2019 & 2032
- Table 22: Global peritoneal dialysis solutions Volume K Forecast, by Application 2019 & 2032
- Table 23: Global peritoneal dialysis solutions Revenue million Forecast, by Types 2019 & 2032
- Table 24: Global peritoneal dialysis solutions Volume K Forecast, by Types 2019 & 2032
- Table 25: Global peritoneal dialysis solutions Revenue million Forecast, by Country 2019 & 2032
- Table 26: Global peritoneal dialysis solutions Volume K Forecast, by Country 2019 & 2032
- Table 27: Brazil peritoneal dialysis solutions Revenue (million) Forecast, by Application 2019 & 2032
- Table 28: Brazil peritoneal dialysis solutions Volume (K) Forecast, by Application 2019 & 2032
- Table 29: Argentina peritoneal dialysis solutions Revenue (million) Forecast, by Application 2019 & 2032
- Table 30: Argentina peritoneal dialysis solutions Volume (K) Forecast, by Application 2019 & 2032
- Table 31: Rest of South America peritoneal dialysis solutions Revenue (million) Forecast, by Application 2019 & 2032
- Table 32: Rest of South America peritoneal dialysis solutions Volume (K) Forecast, by Application 2019 & 2032
- Table 33: Global peritoneal dialysis solutions Revenue million Forecast, by Application 2019 & 2032
- Table 34: Global peritoneal dialysis solutions Volume K Forecast, by Application 2019 & 2032
- Table 35: Global peritoneal dialysis solutions Revenue million Forecast, by Types 2019 & 2032
- Table 36: Global peritoneal dialysis solutions Volume K Forecast, by Types 2019 & 2032
- Table 37: Global peritoneal dialysis solutions Revenue million Forecast, by Country 2019 & 2032
- Table 38: Global peritoneal dialysis solutions Volume K Forecast, by Country 2019 & 2032
- Table 39: United Kingdom peritoneal dialysis solutions Revenue (million) Forecast, by Application 2019 & 2032
- Table 40: United Kingdom peritoneal dialysis solutions Volume (K) Forecast, by Application 2019 & 2032
- Table 41: Germany peritoneal dialysis solutions Revenue (million) Forecast, by Application 2019 & 2032
- Table 42: Germany peritoneal dialysis solutions Volume (K) Forecast, by Application 2019 & 2032
- Table 43: France peritoneal dialysis solutions Revenue (million) Forecast, by Application 2019 & 2032
- Table 44: France peritoneal dialysis solutions Volume (K) Forecast, by Application 2019 & 2032
- Table 45: Italy peritoneal dialysis solutions Revenue (million) Forecast, by Application 2019 & 2032
- Table 46: Italy peritoneal dialysis solutions Volume (K) Forecast, by Application 2019 & 2032
- Table 47: Spain peritoneal dialysis solutions Revenue (million) Forecast, by Application 2019 & 2032
- Table 48: Spain peritoneal dialysis solutions Volume (K) Forecast, by Application 2019 & 2032
- Table 49: Russia peritoneal dialysis solutions Revenue (million) Forecast, by Application 2019 & 2032
- Table 50: Russia peritoneal dialysis solutions Volume (K) Forecast, by Application 2019 & 2032
- Table 51: Benelux peritoneal dialysis solutions Revenue (million) Forecast, by Application 2019 & 2032
- Table 52: Benelux peritoneal dialysis solutions Volume (K) Forecast, by Application 2019 & 2032
- Table 53: Nordics peritoneal dialysis solutions Revenue (million) Forecast, by Application 2019 & 2032
- Table 54: Nordics peritoneal dialysis solutions Volume (K) Forecast, by Application 2019 & 2032
- Table 55: Rest of Europe peritoneal dialysis solutions Revenue (million) Forecast, by Application 2019 & 2032
- Table 56: Rest of Europe peritoneal dialysis solutions Volume (K) Forecast, by Application 2019 & 2032
- Table 57: Global peritoneal dialysis solutions Revenue million Forecast, by Application 2019 & 2032
- Table 58: Global peritoneal dialysis solutions Volume K Forecast, by Application 2019 & 2032
- Table 59: Global peritoneal dialysis solutions Revenue million Forecast, by Types 2019 & 2032
- Table 60: Global peritoneal dialysis solutions Volume K Forecast, by Types 2019 & 2032
- Table 61: Global peritoneal dialysis solutions Revenue million Forecast, by Country 2019 & 2032
- Table 62: Global peritoneal dialysis solutions Volume K Forecast, by Country 2019 & 2032
- Table 63: Turkey peritoneal dialysis solutions Revenue (million) Forecast, by Application 2019 & 2032
- Table 64: Turkey peritoneal dialysis solutions Volume (K) Forecast, by Application 2019 & 2032
- Table 65: Israel peritoneal dialysis solutions Revenue (million) Forecast, by Application 2019 & 2032
- Table 66: Israel peritoneal dialysis solutions Volume (K) Forecast, by Application 2019 & 2032
- Table 67: GCC peritoneal dialysis solutions Revenue (million) Forecast, by Application 2019 & 2032
- Table 68: GCC peritoneal dialysis solutions Volume (K) Forecast, by Application 2019 & 2032
- Table 69: North Africa peritoneal dialysis solutions Revenue (million) Forecast, by Application 2019 & 2032
- Table 70: North Africa peritoneal dialysis solutions Volume (K) Forecast, by Application 2019 & 2032
- Table 71: South Africa peritoneal dialysis solutions Revenue (million) Forecast, by Application 2019 & 2032
- Table 72: South Africa peritoneal dialysis solutions Volume (K) Forecast, by Application 2019 & 2032
- Table 73: Rest of Middle East & Africa peritoneal dialysis solutions Revenue (million) Forecast, by Application 2019 & 2032
- Table 74: Rest of Middle East & Africa peritoneal dialysis solutions Volume (K) Forecast, by Application 2019 & 2032
- Table 75: Global peritoneal dialysis solutions Revenue million Forecast, by Application 2019 & 2032
- Table 76: Global peritoneal dialysis solutions Volume K Forecast, by Application 2019 & 2032
- Table 77: Global peritoneal dialysis solutions Revenue million Forecast, by Types 2019 & 2032
- Table 78: Global peritoneal dialysis solutions Volume K Forecast, by Types 2019 & 2032
- Table 79: Global peritoneal dialysis solutions Revenue million Forecast, by Country 2019 & 2032
- Table 80: Global peritoneal dialysis solutions Volume K Forecast, by Country 2019 & 2032
- Table 81: China peritoneal dialysis solutions Revenue (million) Forecast, by Application 2019 & 2032
- Table 82: China peritoneal dialysis solutions Volume (K) Forecast, by Application 2019 & 2032
- Table 83: India peritoneal dialysis solutions Revenue (million) Forecast, by Application 2019 & 2032
- Table 84: India peritoneal dialysis solutions Volume (K) Forecast, by Application 2019 & 2032
- Table 85: Japan peritoneal dialysis solutions Revenue (million) Forecast, by Application 2019 & 2032
- Table 86: Japan peritoneal dialysis solutions Volume (K) Forecast, by Application 2019 & 2032
- Table 87: South Korea peritoneal dialysis solutions Revenue (million) Forecast, by Application 2019 & 2032
- Table 88: South Korea peritoneal dialysis solutions Volume (K) Forecast, by Application 2019 & 2032
- Table 89: ASEAN peritoneal dialysis solutions Revenue (million) Forecast, by Application 2019 & 2032
- Table 90: ASEAN peritoneal dialysis solutions Volume (K) Forecast, by Application 2019 & 2032
- Table 91: Oceania peritoneal dialysis solutions Revenue (million) Forecast, by Application 2019 & 2032
- Table 92: Oceania peritoneal dialysis solutions Volume (K) Forecast, by Application 2019 & 2032
- Table 93: Rest of Asia Pacific peritoneal dialysis solutions Revenue (million) Forecast, by Application 2019 & 2032
- Table 94: Rest of Asia Pacific peritoneal dialysis solutions Volume (K) Forecast, by Application 2019 & 2032
Frequently Asked Questions
1. What is the projected Compound Annual Growth Rate (CAGR) of the peritoneal dialysis solutions?
The projected CAGR is approximately XX%.
2. Which companies are prominent players in the peritoneal dialysis solutions?
Key companies in the market include Baxter, Fresenius, B. Braun, Terumo, Huaren, CR Double-Crane, Qingshan Likang, Tj Tianan.
3. What are the main segments of the peritoneal dialysis solutions?
The market segments include Application, Types.
4. Can you provide details about the market size?
The market size is estimated to be USD XXX million as of 2022.
5. What are some drivers contributing to market growth?
N/A
6. What are the notable trends driving market growth?
N/A
7. Are there any restraints impacting market growth?
N/A
8. Can you provide examples of recent developments in the market?
N/A
9. What pricing options are available for accessing the report?
Pricing options include single-user, multi-user, and enterprise licenses priced at USD 4350.00, USD 6525.00, and USD 8700.00 respectively.
10. Is the market size provided in terms of value or volume?
The market size is provided in terms of value, measured in million and volume, measured in K.
11. Are there any specific market keywords associated with the report?
Yes, the market keyword associated with the report is "peritoneal dialysis solutions," which aids in identifying and referencing the specific market segment covered.
12. How do I determine which pricing option suits my needs best?
The pricing options vary based on user requirements and access needs. Individual users may opt for single-user licenses, while businesses requiring broader access may choose multi-user or enterprise licenses for cost-effective access to the report.
13. Are there any additional resources or data provided in the peritoneal dialysis solutions report?
While the report offers comprehensive insights, it's advisable to review the specific contents or supplementary materials provided to ascertain if additional resources or data are available.
14. How can I stay updated on further developments or reports in the peritoneal dialysis solutions?
To stay informed about further developments, trends, and reports in the peritoneal dialysis solutions, consider subscribing to industry newsletters, following relevant companies and organizations, or regularly checking reputable industry news sources and publications.
Methodology
Step 1 - Identification of Relevant Samples Size from Population Database


Step 2 - Approaches for Defining Global Market Size (Value, Volume* & Price*)

Note*: In applicable scenarios
Step 3 - Data Sources
Primary Research
- Web Analytics
- Survey Reports
- Research Institute
- Latest Research Reports
- Opinion Leaders
Secondary Research
- Annual Reports
- White Paper
- Latest Press Release
- Industry Association
- Paid Database
- Investor Presentations

Step 4 - Data Triangulation
Involves using different sources of information in order to increase the validity of a study
These sources are likely to be stakeholders in a program - participants, other researchers, program staff, other community members, and so on.
Then we put all data in single framework & apply various statistical tools to find out the dynamic on the market.
During the analysis stage, feedback from the stakeholder groups would be compared to determine areas of agreement as well as areas of divergence
