

Key Insights
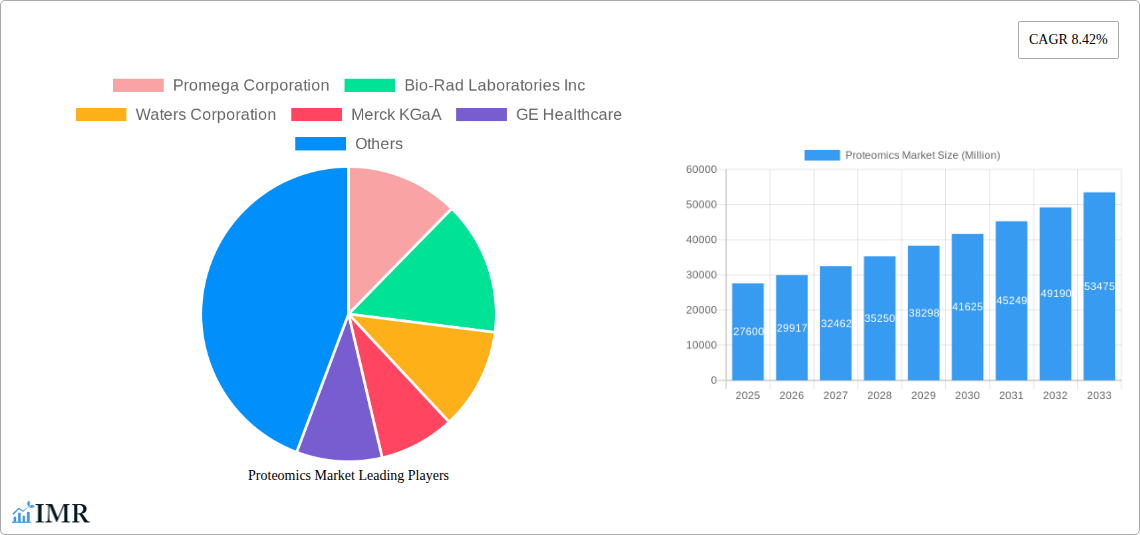
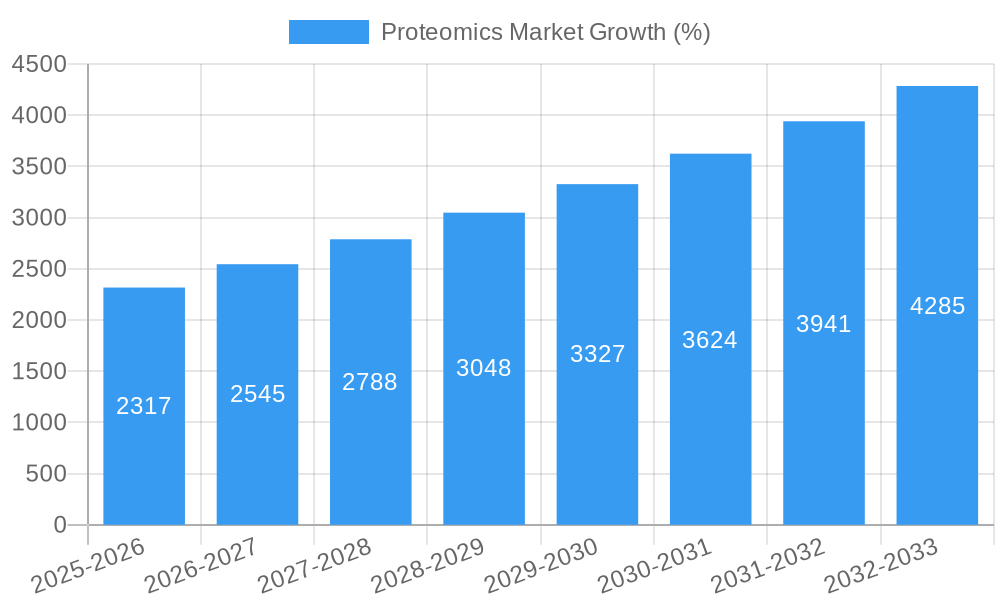
The global proteomics market, valued at $27.60 billion in 2025, is projected to experience robust growth, exhibiting a Compound Annual Growth Rate (CAGR) of 8.42% from 2025 to 2033. This expansion is driven by several key factors. Advancements in mass spectrometry technologies are enabling higher throughput and more sensitive proteomic analyses, leading to faster and more accurate identification and quantification of proteins. The increasing prevalence of chronic diseases, such as cancer and diabetes, is fueling demand for improved diagnostic tools and personalized medicine approaches, where proteomics plays a crucial role. Furthermore, the growing adoption of proteomics in drug discovery and development, particularly in biomarker identification and target validation, is significantly contributing to market growth. Increased funding for research and development in life sciences, coupled with the rising adoption of cloud-based data analysis platforms for managing the large datasets generated in proteomics studies, further bolsters market expansion.
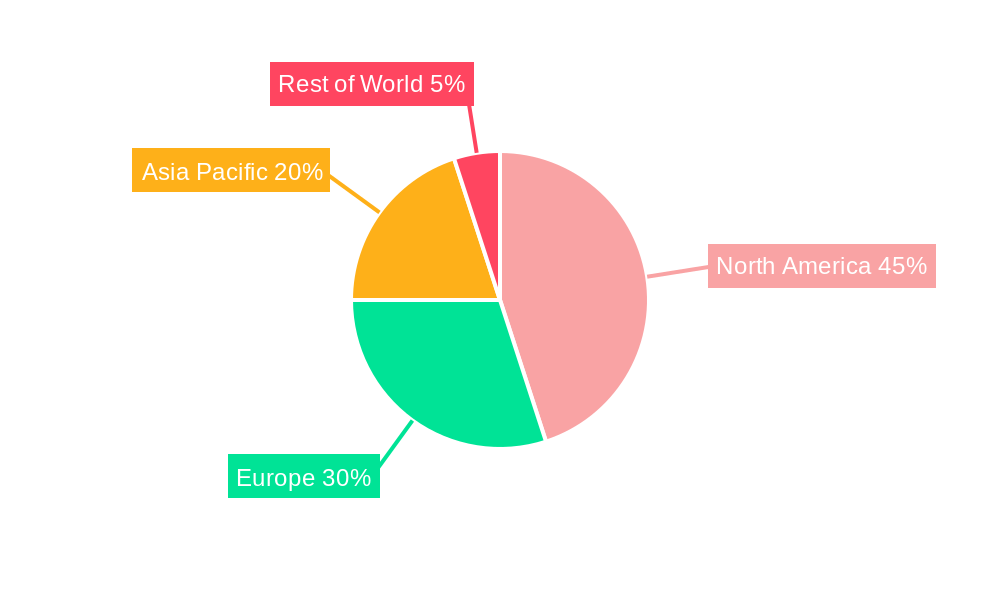
The market segmentation reveals a significant contribution from instrumentation technologies, including mass spectrometers and related equipment. Reagents, software, and services are also vital components, supporting the entire workflow of proteomic experiments. Clinical diagnostics represents a major application area, followed by drug discovery and other research applications. North America currently holds a substantial market share, driven by robust research infrastructure and high healthcare spending. However, Asia-Pacific is expected to witness significant growth in the coming years, fueled by rising investments in healthcare and biotechnology within countries like China and India. Competitive landscape analysis shows a diverse mix of established players, including Promega, Bio-Rad, Waters, Merck KGaA, and Thermo Fisher Scientific, who are constantly innovating and expanding their product portfolios to maintain their market position. The continued evolution of proteomics technologies and their increasing integration into various healthcare and research applications ensures the market's promising trajectory.
Proteomics Market Report: 2019-2033
This comprehensive report provides an in-depth analysis of the global Proteomics Market, offering invaluable insights for industry professionals, investors, and researchers. The study period spans from 2019 to 2033, with 2025 serving as the base year and estimated year. The report forecasts market trends from 2025 to 2033, while leveraging historical data from 2019 to 2024. The market is segmented by Product & Services (Instrumentation Technology, Reagents, Software and Services) and Application (Clinical Diagnostics, Drug Discovery, Other Applications). The report values are presented in million units.
Proteomics Market Dynamics & Structure
The global proteomics market is characterized by a moderately concentrated structure, with key players like Thermo Fisher Scientific, Danaher, and Agilent Technologies holding significant market share (estimated at xx% collectively in 2025). Technological innovation, particularly in mass spectrometry and bioinformatics, is a primary driver, fostering the development of high-throughput and sensitive proteomic technologies. Stringent regulatory frameworks, particularly in the clinical diagnostics segment, influence market growth. Competitive pressures arise from substitutes like genomics and transcriptomics, which offer alternative approaches to biological research. The end-user demographic encompasses pharmaceutical companies, academic research institutions, and clinical diagnostic laboratories. M&A activity in the proteomics sector has been robust in recent years, with xx major deals recorded between 2019-2024, primarily driven by the need to expand product portfolios and access new technologies.
- Market Concentration: Moderately concentrated, with top players holding xx% market share in 2025.
- Technological Innovation: Mass spectrometry advancements, improved bioinformatics tools, and miniaturization are key drivers.
- Regulatory Landscape: Stringent regulations in clinical diagnostics influence market entry and product development.
- Competitive Substitutes: Genomics and transcriptomics pose competitive challenges.
- End-User Demographics: Pharmaceutical & Biotech companies, academic research, and clinical diagnostics labs.
- M&A Trends: xx major deals (2019-2024), driven by portfolio expansion and technology acquisition.
- Innovation Barriers: High R&D costs, complex data analysis, and skilled workforce requirements.
Proteomics Market Growth Trends & Insights
The global proteomics market has witnessed substantial growth over the past five years, with a CAGR of xx% during the historical period (2019-2024). This growth is projected to continue during the forecast period (2025-2033), driven by increased adoption of proteomics technologies in drug discovery, clinical diagnostics, and personalized medicine. Market penetration is relatively high in developed regions like North America and Europe, while significant growth potential exists in emerging markets. Technological disruptions, such as the emergence of advanced mass spectrometry techniques and sophisticated bioinformatics software, are continually expanding the applications and capabilities of proteomics. Shifting consumer preferences towards personalized medicine are also boosting demand for proteomics-based diagnostic and therapeutic solutions. The market size is estimated at $xx million in 2025 and is projected to reach $xx million by 2033.
Dominant Regions, Countries, or Segments in Proteomics Market
North America currently dominates the proteomics market, holding the largest market share (estimated at xx% in 2025), driven by substantial investments in research and development, a strong presence of key players, and well-established healthcare infrastructure. Within the segments, Instrumentation Technology holds the largest market share, followed by reagents and software & services. In terms of applications, drug discovery leads the market with a significant share (estimated at xx% in 2025), owing to the increasing application of proteomics in biomarker discovery and therapeutic target identification.
- North America Dominance: Strong R&D investments, leading players, and advanced healthcare infrastructure.
- Europe and Asia-Pacific: High growth potential, driven by increasing healthcare spending and rising adoption rates.
- Instrumentation Technology: Largest market share driven by demand for advanced mass spectrometry and related equipment.
- Drug Discovery: Highest market share among applications, fueled by biomarker identification and target validation.
- Clinical Diagnostics: Growing segment, driven by increasing demand for precise and sensitive diagnostics.
Proteomics Market Product Landscape
The proteomics market features a wide range of products, including advanced mass spectrometers, sophisticated software for data analysis, and various reagents for sample preparation and protein analysis. Recent product innovations focus on improving sensitivity, throughput, and automation. Miniaturized and portable devices are gaining traction for point-of-care diagnostics. Unique selling propositions encompass higher sensitivity, faster analysis times, and user-friendly software interfaces. Continuous technological advancements drive the development of innovative solutions for a broad spectrum of proteomics applications.
Key Drivers, Barriers & Challenges in Proteomics Market
Key Drivers:
- Rising prevalence of chronic diseases driving demand for advanced diagnostics.
- Increased funding for proteomics research in both the public and private sectors.
- Technological advancements in mass spectrometry and bioinformatics.
- Growing adoption of personalized medicine approaches.
Key Challenges & Restraints:
- High cost of instrumentation and reagents limiting access for smaller labs.
- Complex data analysis requiring specialized expertise.
- Regulatory hurdles related to clinical diagnostic applications.
- Intense competition among established players and emerging startups. This leads to price pressures and margin compression, impacting the profitability of some players. (estimated impact xx% reduction in profit margin for smaller players)
Emerging Opportunities in Proteomics Market
The proteomics market presents several emerging opportunities, including expansion into untapped markets in developing countries, innovative applications in disease diagnostics (e.g., early cancer detection), and the development of novel therapeutic strategies based on proteomic insights. The increasing integration of proteomics with other 'omics' technologies, like genomics and metabolomics, opens avenues for more comprehensive biological analysis. Growth in personalized medicine and advancements in biomarker discovery will continue to drive market expansion.
Growth Accelerators in the Proteomics Market Industry
Long-term growth in the proteomics market will be fueled by continuous technological breakthroughs, particularly in high-resolution mass spectrometry and advanced bioinformatics algorithms. Strategic partnerships between instrument manufacturers, software developers, and research institutions will play a crucial role in accelerating innovation and market penetration. Expansion into new application areas, like environmental monitoring and food safety, holds significant growth potential.
Key Players Shaping the Proteomics Market Market
- Promega Corporation
- Bio-Rad Laboratories Inc
- Waters Corporation
- Merck KGaA
- GE Healthcare
- Thermo Fisher Scientific Inc
- Danaher Corporation
- Agilent Technologies Inc
- Bruker Corporation
Notable Milestones in Proteomics Market Sector
- 2020: Launch of next-generation mass spectrometer by Thermo Fisher Scientific.
- 2021: Acquisition of a proteomics software company by Danaher Corporation.
- 2022: Publication of landmark study demonstrating the use of proteomics in early cancer detection.
- 2023: Strategic partnership between a major pharmaceutical company and a proteomics service provider.
In-Depth Proteomics Market Market Outlook
The proteomics market is poised for significant growth in the coming years, driven by continued technological innovation, expanding applications, and increasing investment in research and development. Strategic partnerships and collaborations will be critical for driving innovation and market penetration. The development of more user-friendly and cost-effective proteomics technologies will enhance accessibility, fostering growth in both developed and emerging markets. The integration of proteomics with artificial intelligence (AI) and machine learning (ML) will further unlock new opportunities for data analysis and biomarker discovery. Focusing on early disease detection and personalized medicine will present lucrative opportunities for companies operating in this dynamic market.
Proteomics Market Segmentation
-
1. Product & Services
-
1.1. Instrumentation Technology
- 1.1.1. Spectroscopy
- 1.1.2. Chromatography
- 1.1.3. Electrophoresis
- 1.1.4. Protein Microarrays
- 1.1.5. X-Ray Crystallography
- 1.1.6. Other Instrumentation Technologies
- 1.2. Reagents
- 1.3. Software and Services
-
1.1. Instrumentation Technology
-
2. Application
- 2.1. Clinical Diagnostics
- 2.2. Drug Discovery
- 2.3. Other Applications
Proteomics Market Segmentation By Geography
-
1. North America
- 1.1. United States
- 1.2. Canada
- 1.3. Mexico
-
2. Europe
- 2.1. Germany
- 2.2. United Kingdom
- 2.3. France
- 2.4. Italy
- 2.5. Spain
- 2.6. Rest of Europe
-
3. Asia Pacific
- 3.1. China
- 3.2. Japan
- 3.3. India
- 3.4. Australia
- 3.5. South Korea
- 3.6. Rest of Asia Pacific
- 4. Middle East
-
5. GCC
- 5.1. South Africa
- 5.2. Rest of Middle East
-
6. South America
- 6.1. Brazil
- 6.2. Argentina
- 6.3. Rest of South America
Proteomics Market REPORT HIGHLIGHTS
| Aspects | Details |
|---|---|
| Study Period | 2019-2033 |
| Base Year | 2024 |
| Estimated Year | 2025 |
| Forecast Period | 2025-2033 |
| Historical Period | 2019-2024 |
| Growth Rate | CAGR of 8.42% from 2019-2033 |
| Segmentation |
|
Table of Contents
- 1. Introduction
- 1.1. Research Scope
- 1.2. Market Segmentation
- 1.3. Research Methodology
- 1.4. Definitions and Assumptions
- 2. Executive Summary
- 2.1. Introduction
- 3. Market Dynamics
- 3.1. Introduction
- 3.2. Market Drivers
- 3.2.1. Rising Demand for Personalized Medicine; Increasing R&D Expenditure and Government Funding for Proteomics; Technological Advancements
- 3.3. Market Restrains
- 3.3.1. High Cost of Instruments
- 3.4. Market Trends
- 3.4.1. Drug Discovery is Expected to Witness Healthy CAGR in Future
- 4. Market Factor Analysis
- 4.1. Porters Five Forces
- 4.2. Supply/Value Chain
- 4.3. PESTEL analysis
- 4.4. Market Entropy
- 4.5. Patent/Trademark Analysis
- 5. Global Proteomics Market Analysis, Insights and Forecast, 2019-2031
- 5.1. Market Analysis, Insights and Forecast - by Product & Services
- 5.1.1. Instrumentation Technology
- 5.1.1.1. Spectroscopy
- 5.1.1.2. Chromatography
- 5.1.1.3. Electrophoresis
- 5.1.1.4. Protein Microarrays
- 5.1.1.5. X-Ray Crystallography
- 5.1.1.6. Other Instrumentation Technologies
- 5.1.2. Reagents
- 5.1.3. Software and Services
- 5.1.1. Instrumentation Technology
- 5.2. Market Analysis, Insights and Forecast - by Application
- 5.2.1. Clinical Diagnostics
- 5.2.2. Drug Discovery
- 5.2.3. Other Applications
- 5.3. Market Analysis, Insights and Forecast - by Region
- 5.3.1. North America
- 5.3.2. Europe
- 5.3.3. Asia Pacific
- 5.3.4. Middle East
- 5.3.5. GCC
- 5.3.6. South America
- 5.1. Market Analysis, Insights and Forecast - by Product & Services
- 6. North America Proteomics Market Analysis, Insights and Forecast, 2019-2031
- 6.1. Market Analysis, Insights and Forecast - by Product & Services
- 6.1.1. Instrumentation Technology
- 6.1.1.1. Spectroscopy
- 6.1.1.2. Chromatography
- 6.1.1.3. Electrophoresis
- 6.1.1.4. Protein Microarrays
- 6.1.1.5. X-Ray Crystallography
- 6.1.1.6. Other Instrumentation Technologies
- 6.1.2. Reagents
- 6.1.3. Software and Services
- 6.1.1. Instrumentation Technology
- 6.2. Market Analysis, Insights and Forecast - by Application
- 6.2.1. Clinical Diagnostics
- 6.2.2. Drug Discovery
- 6.2.3. Other Applications
- 6.1. Market Analysis, Insights and Forecast - by Product & Services
- 7. Europe Proteomics Market Analysis, Insights and Forecast, 2019-2031
- 7.1. Market Analysis, Insights and Forecast - by Product & Services
- 7.1.1. Instrumentation Technology
- 7.1.1.1. Spectroscopy
- 7.1.1.2. Chromatography
- 7.1.1.3. Electrophoresis
- 7.1.1.4. Protein Microarrays
- 7.1.1.5. X-Ray Crystallography
- 7.1.1.6. Other Instrumentation Technologies
- 7.1.2. Reagents
- 7.1.3. Software and Services
- 7.1.1. Instrumentation Technology
- 7.2. Market Analysis, Insights and Forecast - by Application
- 7.2.1. Clinical Diagnostics
- 7.2.2. Drug Discovery
- 7.2.3. Other Applications
- 7.1. Market Analysis, Insights and Forecast - by Product & Services
- 8. Asia Pacific Proteomics Market Analysis, Insights and Forecast, 2019-2031
- 8.1. Market Analysis, Insights and Forecast - by Product & Services
- 8.1.1. Instrumentation Technology
- 8.1.1.1. Spectroscopy
- 8.1.1.2. Chromatography
- 8.1.1.3. Electrophoresis
- 8.1.1.4. Protein Microarrays
- 8.1.1.5. X-Ray Crystallography
- 8.1.1.6. Other Instrumentation Technologies
- 8.1.2. Reagents
- 8.1.3. Software and Services
- 8.1.1. Instrumentation Technology
- 8.2. Market Analysis, Insights and Forecast - by Application
- 8.2.1. Clinical Diagnostics
- 8.2.2. Drug Discovery
- 8.2.3. Other Applications
- 8.1. Market Analysis, Insights and Forecast - by Product & Services
- 9. Middle East Proteomics Market Analysis, Insights and Forecast, 2019-2031
- 9.1. Market Analysis, Insights and Forecast - by Product & Services
- 9.1.1. Instrumentation Technology
- 9.1.1.1. Spectroscopy
- 9.1.1.2. Chromatography
- 9.1.1.3. Electrophoresis
- 9.1.1.4. Protein Microarrays
- 9.1.1.5. X-Ray Crystallography
- 9.1.1.6. Other Instrumentation Technologies
- 9.1.2. Reagents
- 9.1.3. Software and Services
- 9.1.1. Instrumentation Technology
- 9.2. Market Analysis, Insights and Forecast - by Application
- 9.2.1. Clinical Diagnostics
- 9.2.2. Drug Discovery
- 9.2.3. Other Applications
- 9.1. Market Analysis, Insights and Forecast - by Product & Services
- 10. GCC Proteomics Market Analysis, Insights and Forecast, 2019-2031
- 10.1. Market Analysis, Insights and Forecast - by Product & Services
- 10.1.1. Instrumentation Technology
- 10.1.1.1. Spectroscopy
- 10.1.1.2. Chromatography
- 10.1.1.3. Electrophoresis
- 10.1.1.4. Protein Microarrays
- 10.1.1.5. X-Ray Crystallography
- 10.1.1.6. Other Instrumentation Technologies
- 10.1.2. Reagents
- 10.1.3. Software and Services
- 10.1.1. Instrumentation Technology
- 10.2. Market Analysis, Insights and Forecast - by Application
- 10.2.1. Clinical Diagnostics
- 10.2.2. Drug Discovery
- 10.2.3. Other Applications
- 10.1. Market Analysis, Insights and Forecast - by Product & Services
- 11. South America Proteomics Market Analysis, Insights and Forecast, 2019-2031
- 11.1. Market Analysis, Insights and Forecast - by Product & Services
- 11.1.1. Instrumentation Technology
- 11.1.1.1. Spectroscopy
- 11.1.1.2. Chromatography
- 11.1.1.3. Electrophoresis
- 11.1.1.4. Protein Microarrays
- 11.1.1.5. X-Ray Crystallography
- 11.1.1.6. Other Instrumentation Technologies
- 11.1.2. Reagents
- 11.1.3. Software and Services
- 11.1.1. Instrumentation Technology
- 11.2. Market Analysis, Insights and Forecast - by Application
- 11.2.1. Clinical Diagnostics
- 11.2.2. Drug Discovery
- 11.2.3. Other Applications
- 11.1. Market Analysis, Insights and Forecast - by Product & Services
- 12. North America Proteomics Market Analysis, Insights and Forecast, 2019-2031
- 12.1. Market Analysis, Insights and Forecast - By Country/Sub-region
- 12.1.1 United States
- 12.1.2 Canada
- 12.1.3 Mexico
- 13. Europe Proteomics Market Analysis, Insights and Forecast, 2019-2031
- 13.1. Market Analysis, Insights and Forecast - By Country/Sub-region
- 13.1.1 Germany
- 13.1.2 United Kingdom
- 13.1.3 France
- 13.1.4 Italy
- 13.1.5 Spain
- 13.1.6 Rest of Europe
- 14. Asia Pacific Proteomics Market Analysis, Insights and Forecast, 2019-2031
- 14.1. Market Analysis, Insights and Forecast - By Country/Sub-region
- 14.1.1 China
- 14.1.2 Japan
- 14.1.3 India
- 14.1.4 Australia
- 14.1.5 South Korea
- 14.1.6 Rest of Asia Pacific
- 15. Middle East Proteomics Market Analysis, Insights and Forecast, 2019-2031
- 15.1. Market Analysis, Insights and Forecast - By Country/Sub-region
- 15.1.1.
- 16. GCC Proteomics Market Analysis, Insights and Forecast, 2019-2031
- 16.1. Market Analysis, Insights and Forecast - By Country/Sub-region
- 16.1.1 South Africa
- 16.1.2 Rest of Middle East
- 17. South America Proteomics Market Analysis, Insights and Forecast, 2019-2031
- 17.1. Market Analysis, Insights and Forecast - By Country/Sub-region
- 17.1.1 Brazil
- 17.1.2 Argentina
- 17.1.3 Rest of South America
- 18. Competitive Analysis
- 18.1. Global Market Share Analysis 2024
- 18.2. Company Profiles
- 18.2.1 Promega Corporation
- 18.2.1.1. Overview
- 18.2.1.2. Products
- 18.2.1.3. SWOT Analysis
- 18.2.1.4. Recent Developments
- 18.2.1.5. Financials (Based on Availability)
- 18.2.2 Bio-Rad Laboratories Inc
- 18.2.2.1. Overview
- 18.2.2.2. Products
- 18.2.2.3. SWOT Analysis
- 18.2.2.4. Recent Developments
- 18.2.2.5. Financials (Based on Availability)
- 18.2.3 Waters Corporation
- 18.2.3.1. Overview
- 18.2.3.2. Products
- 18.2.3.3. SWOT Analysis
- 18.2.3.4. Recent Developments
- 18.2.3.5. Financials (Based on Availability)
- 18.2.4 Merck KGaA
- 18.2.4.1. Overview
- 18.2.4.2. Products
- 18.2.4.3. SWOT Analysis
- 18.2.4.4. Recent Developments
- 18.2.4.5. Financials (Based on Availability)
- 18.2.5 GE Healthcare
- 18.2.5.1. Overview
- 18.2.5.2. Products
- 18.2.5.3. SWOT Analysis
- 18.2.5.4. Recent Developments
- 18.2.5.5. Financials (Based on Availability)
- 18.2.6 Thermo Fisher Scientific Inc
- 18.2.6.1. Overview
- 18.2.6.2. Products
- 18.2.6.3. SWOT Analysis
- 18.2.6.4. Recent Developments
- 18.2.6.5. Financials (Based on Availability)
- 18.2.7 Danaher Corporation
- 18.2.7.1. Overview
- 18.2.7.2. Products
- 18.2.7.3. SWOT Analysis
- 18.2.7.4. Recent Developments
- 18.2.7.5. Financials (Based on Availability)
- 18.2.8 Agilent Technologies Inc
- 18.2.8.1. Overview
- 18.2.8.2. Products
- 18.2.8.3. SWOT Analysis
- 18.2.8.4. Recent Developments
- 18.2.8.5. Financials (Based on Availability)
- 18.2.9 Bruker Corporation
- 18.2.9.1. Overview
- 18.2.9.2. Products
- 18.2.9.3. SWOT Analysis
- 18.2.9.4. Recent Developments
- 18.2.9.5. Financials (Based on Availability)
- 18.2.1 Promega Corporation
List of Figures
- Figure 1: Global Proteomics Market Revenue Breakdown (Million, %) by Region 2024 & 2032
- Figure 2: Global Proteomics Market Volume Breakdown (K Unit, %) by Region 2024 & 2032
- Figure 3: North America Proteomics Market Revenue (Million), by Country 2024 & 2032
- Figure 4: North America Proteomics Market Volume (K Unit), by Country 2024 & 2032
- Figure 5: North America Proteomics Market Revenue Share (%), by Country 2024 & 2032
- Figure 6: North America Proteomics Market Volume Share (%), by Country 2024 & 2032
- Figure 7: Europe Proteomics Market Revenue (Million), by Country 2024 & 2032
- Figure 8: Europe Proteomics Market Volume (K Unit), by Country 2024 & 2032
- Figure 9: Europe Proteomics Market Revenue Share (%), by Country 2024 & 2032
- Figure 10: Europe Proteomics Market Volume Share (%), by Country 2024 & 2032
- Figure 11: Asia Pacific Proteomics Market Revenue (Million), by Country 2024 & 2032
- Figure 12: Asia Pacific Proteomics Market Volume (K Unit), by Country 2024 & 2032
- Figure 13: Asia Pacific Proteomics Market Revenue Share (%), by Country 2024 & 2032
- Figure 14: Asia Pacific Proteomics Market Volume Share (%), by Country 2024 & 2032
- Figure 15: Middle East Proteomics Market Revenue (Million), by Country 2024 & 2032
- Figure 16: Middle East Proteomics Market Volume (K Unit), by Country 2024 & 2032
- Figure 17: Middle East Proteomics Market Revenue Share (%), by Country 2024 & 2032
- Figure 18: Middle East Proteomics Market Volume Share (%), by Country 2024 & 2032
- Figure 19: GCC Proteomics Market Revenue (Million), by Country 2024 & 2032
- Figure 20: GCC Proteomics Market Volume (K Unit), by Country 2024 & 2032
- Figure 21: GCC Proteomics Market Revenue Share (%), by Country 2024 & 2032
- Figure 22: GCC Proteomics Market Volume Share (%), by Country 2024 & 2032
- Figure 23: South America Proteomics Market Revenue (Million), by Country 2024 & 2032
- Figure 24: South America Proteomics Market Volume (K Unit), by Country 2024 & 2032
- Figure 25: South America Proteomics Market Revenue Share (%), by Country 2024 & 2032
- Figure 26: South America Proteomics Market Volume Share (%), by Country 2024 & 2032
- Figure 27: North America Proteomics Market Revenue (Million), by Product & Services 2024 & 2032
- Figure 28: North America Proteomics Market Volume (K Unit), by Product & Services 2024 & 2032
- Figure 29: North America Proteomics Market Revenue Share (%), by Product & Services 2024 & 2032
- Figure 30: North America Proteomics Market Volume Share (%), by Product & Services 2024 & 2032
- Figure 31: North America Proteomics Market Revenue (Million), by Application 2024 & 2032
- Figure 32: North America Proteomics Market Volume (K Unit), by Application 2024 & 2032
- Figure 33: North America Proteomics Market Revenue Share (%), by Application 2024 & 2032
- Figure 34: North America Proteomics Market Volume Share (%), by Application 2024 & 2032
- Figure 35: North America Proteomics Market Revenue (Million), by Country 2024 & 2032
- Figure 36: North America Proteomics Market Volume (K Unit), by Country 2024 & 2032
- Figure 37: North America Proteomics Market Revenue Share (%), by Country 2024 & 2032
- Figure 38: North America Proteomics Market Volume Share (%), by Country 2024 & 2032
- Figure 39: Europe Proteomics Market Revenue (Million), by Product & Services 2024 & 2032
- Figure 40: Europe Proteomics Market Volume (K Unit), by Product & Services 2024 & 2032
- Figure 41: Europe Proteomics Market Revenue Share (%), by Product & Services 2024 & 2032
- Figure 42: Europe Proteomics Market Volume Share (%), by Product & Services 2024 & 2032
- Figure 43: Europe Proteomics Market Revenue (Million), by Application 2024 & 2032
- Figure 44: Europe Proteomics Market Volume (K Unit), by Application 2024 & 2032
- Figure 45: Europe Proteomics Market Revenue Share (%), by Application 2024 & 2032
- Figure 46: Europe Proteomics Market Volume Share (%), by Application 2024 & 2032
- Figure 47: Europe Proteomics Market Revenue (Million), by Country 2024 & 2032
- Figure 48: Europe Proteomics Market Volume (K Unit), by Country 2024 & 2032
- Figure 49: Europe Proteomics Market Revenue Share (%), by Country 2024 & 2032
- Figure 50: Europe Proteomics Market Volume Share (%), by Country 2024 & 2032
- Figure 51: Asia Pacific Proteomics Market Revenue (Million), by Product & Services 2024 & 2032
- Figure 52: Asia Pacific Proteomics Market Volume (K Unit), by Product & Services 2024 & 2032
- Figure 53: Asia Pacific Proteomics Market Revenue Share (%), by Product & Services 2024 & 2032
- Figure 54: Asia Pacific Proteomics Market Volume Share (%), by Product & Services 2024 & 2032
- Figure 55: Asia Pacific Proteomics Market Revenue (Million), by Application 2024 & 2032
- Figure 56: Asia Pacific Proteomics Market Volume (K Unit), by Application 2024 & 2032
- Figure 57: Asia Pacific Proteomics Market Revenue Share (%), by Application 2024 & 2032
- Figure 58: Asia Pacific Proteomics Market Volume Share (%), by Application 2024 & 2032
- Figure 59: Asia Pacific Proteomics Market Revenue (Million), by Country 2024 & 2032
- Figure 60: Asia Pacific Proteomics Market Volume (K Unit), by Country 2024 & 2032
- Figure 61: Asia Pacific Proteomics Market Revenue Share (%), by Country 2024 & 2032
- Figure 62: Asia Pacific Proteomics Market Volume Share (%), by Country 2024 & 2032
- Figure 63: Middle East Proteomics Market Revenue (Million), by Product & Services 2024 & 2032
- Figure 64: Middle East Proteomics Market Volume (K Unit), by Product & Services 2024 & 2032
- Figure 65: Middle East Proteomics Market Revenue Share (%), by Product & Services 2024 & 2032
- Figure 66: Middle East Proteomics Market Volume Share (%), by Product & Services 2024 & 2032
- Figure 67: Middle East Proteomics Market Revenue (Million), by Application 2024 & 2032
- Figure 68: Middle East Proteomics Market Volume (K Unit), by Application 2024 & 2032
- Figure 69: Middle East Proteomics Market Revenue Share (%), by Application 2024 & 2032
- Figure 70: Middle East Proteomics Market Volume Share (%), by Application 2024 & 2032
- Figure 71: Middle East Proteomics Market Revenue (Million), by Country 2024 & 2032
- Figure 72: Middle East Proteomics Market Volume (K Unit), by Country 2024 & 2032
- Figure 73: Middle East Proteomics Market Revenue Share (%), by Country 2024 & 2032
- Figure 74: Middle East Proteomics Market Volume Share (%), by Country 2024 & 2032
- Figure 75: GCC Proteomics Market Revenue (Million), by Product & Services 2024 & 2032
- Figure 76: GCC Proteomics Market Volume (K Unit), by Product & Services 2024 & 2032
- Figure 77: GCC Proteomics Market Revenue Share (%), by Product & Services 2024 & 2032
- Figure 78: GCC Proteomics Market Volume Share (%), by Product & Services 2024 & 2032
- Figure 79: GCC Proteomics Market Revenue (Million), by Application 2024 & 2032
- Figure 80: GCC Proteomics Market Volume (K Unit), by Application 2024 & 2032
- Figure 81: GCC Proteomics Market Revenue Share (%), by Application 2024 & 2032
- Figure 82: GCC Proteomics Market Volume Share (%), by Application 2024 & 2032
- Figure 83: GCC Proteomics Market Revenue (Million), by Country 2024 & 2032
- Figure 84: GCC Proteomics Market Volume (K Unit), by Country 2024 & 2032
- Figure 85: GCC Proteomics Market Revenue Share (%), by Country 2024 & 2032
- Figure 86: GCC Proteomics Market Volume Share (%), by Country 2024 & 2032
- Figure 87: South America Proteomics Market Revenue (Million), by Product & Services 2024 & 2032
- Figure 88: South America Proteomics Market Volume (K Unit), by Product & Services 2024 & 2032
- Figure 89: South America Proteomics Market Revenue Share (%), by Product & Services 2024 & 2032
- Figure 90: South America Proteomics Market Volume Share (%), by Product & Services 2024 & 2032
- Figure 91: South America Proteomics Market Revenue (Million), by Application 2024 & 2032
- Figure 92: South America Proteomics Market Volume (K Unit), by Application 2024 & 2032
- Figure 93: South America Proteomics Market Revenue Share (%), by Application 2024 & 2032
- Figure 94: South America Proteomics Market Volume Share (%), by Application 2024 & 2032
- Figure 95: South America Proteomics Market Revenue (Million), by Country 2024 & 2032
- Figure 96: South America Proteomics Market Volume (K Unit), by Country 2024 & 2032
- Figure 97: South America Proteomics Market Revenue Share (%), by Country 2024 & 2032
- Figure 98: South America Proteomics Market Volume Share (%), by Country 2024 & 2032
List of Tables
- Table 1: Global Proteomics Market Revenue Million Forecast, by Region 2019 & 2032
- Table 2: Global Proteomics Market Volume K Unit Forecast, by Region 2019 & 2032
- Table 3: Global Proteomics Market Revenue Million Forecast, by Product & Services 2019 & 2032
- Table 4: Global Proteomics Market Volume K Unit Forecast, by Product & Services 2019 & 2032
- Table 5: Global Proteomics Market Revenue Million Forecast, by Application 2019 & 2032
- Table 6: Global Proteomics Market Volume K Unit Forecast, by Application 2019 & 2032
- Table 7: Global Proteomics Market Revenue Million Forecast, by Region 2019 & 2032
- Table 8: Global Proteomics Market Volume K Unit Forecast, by Region 2019 & 2032
- Table 9: Global Proteomics Market Revenue Million Forecast, by Country 2019 & 2032
- Table 10: Global Proteomics Market Volume K Unit Forecast, by Country 2019 & 2032
- Table 11: United States Proteomics Market Revenue (Million) Forecast, by Application 2019 & 2032
- Table 12: United States Proteomics Market Volume (K Unit) Forecast, by Application 2019 & 2032
- Table 13: Canada Proteomics Market Revenue (Million) Forecast, by Application 2019 & 2032
- Table 14: Canada Proteomics Market Volume (K Unit) Forecast, by Application 2019 & 2032
- Table 15: Mexico Proteomics Market Revenue (Million) Forecast, by Application 2019 & 2032
- Table 16: Mexico Proteomics Market Volume (K Unit) Forecast, by Application 2019 & 2032
- Table 17: Global Proteomics Market Revenue Million Forecast, by Country 2019 & 2032
- Table 18: Global Proteomics Market Volume K Unit Forecast, by Country 2019 & 2032
- Table 19: Germany Proteomics Market Revenue (Million) Forecast, by Application 2019 & 2032
- Table 20: Germany Proteomics Market Volume (K Unit) Forecast, by Application 2019 & 2032
- Table 21: United Kingdom Proteomics Market Revenue (Million) Forecast, by Application 2019 & 2032
- Table 22: United Kingdom Proteomics Market Volume (K Unit) Forecast, by Application 2019 & 2032
- Table 23: France Proteomics Market Revenue (Million) Forecast, by Application 2019 & 2032
- Table 24: France Proteomics Market Volume (K Unit) Forecast, by Application 2019 & 2032
- Table 25: Italy Proteomics Market Revenue (Million) Forecast, by Application 2019 & 2032
- Table 26: Italy Proteomics Market Volume (K Unit) Forecast, by Application 2019 & 2032
- Table 27: Spain Proteomics Market Revenue (Million) Forecast, by Application 2019 & 2032
- Table 28: Spain Proteomics Market Volume (K Unit) Forecast, by Application 2019 & 2032
- Table 29: Rest of Europe Proteomics Market Revenue (Million) Forecast, by Application 2019 & 2032
- Table 30: Rest of Europe Proteomics Market Volume (K Unit) Forecast, by Application 2019 & 2032
- Table 31: Global Proteomics Market Revenue Million Forecast, by Country 2019 & 2032
- Table 32: Global Proteomics Market Volume K Unit Forecast, by Country 2019 & 2032
- Table 33: China Proteomics Market Revenue (Million) Forecast, by Application 2019 & 2032
- Table 34: China Proteomics Market Volume (K Unit) Forecast, by Application 2019 & 2032
- Table 35: Japan Proteomics Market Revenue (Million) Forecast, by Application 2019 & 2032
- Table 36: Japan Proteomics Market Volume (K Unit) Forecast, by Application 2019 & 2032
- Table 37: India Proteomics Market Revenue (Million) Forecast, by Application 2019 & 2032
- Table 38: India Proteomics Market Volume (K Unit) Forecast, by Application 2019 & 2032
- Table 39: Australia Proteomics Market Revenue (Million) Forecast, by Application 2019 & 2032
- Table 40: Australia Proteomics Market Volume (K Unit) Forecast, by Application 2019 & 2032
- Table 41: South Korea Proteomics Market Revenue (Million) Forecast, by Application 2019 & 2032
- Table 42: South Korea Proteomics Market Volume (K Unit) Forecast, by Application 2019 & 2032
- Table 43: Rest of Asia Pacific Proteomics Market Revenue (Million) Forecast, by Application 2019 & 2032
- Table 44: Rest of Asia Pacific Proteomics Market Volume (K Unit) Forecast, by Application 2019 & 2032
- Table 45: Global Proteomics Market Revenue Million Forecast, by Country 2019 & 2032
- Table 46: Global Proteomics Market Volume K Unit Forecast, by Country 2019 & 2032
- Table 47: Proteomics Market Revenue (Million) Forecast, by Application 2019 & 2032
- Table 48: Proteomics Market Volume (K Unit) Forecast, by Application 2019 & 2032
- Table 49: Global Proteomics Market Revenue Million Forecast, by Country 2019 & 2032
- Table 50: Global Proteomics Market Volume K Unit Forecast, by Country 2019 & 2032
- Table 51: South Africa Proteomics Market Revenue (Million) Forecast, by Application 2019 & 2032
- Table 52: South Africa Proteomics Market Volume (K Unit) Forecast, by Application 2019 & 2032
- Table 53: Rest of Middle East Proteomics Market Revenue (Million) Forecast, by Application 2019 & 2032
- Table 54: Rest of Middle East Proteomics Market Volume (K Unit) Forecast, by Application 2019 & 2032
- Table 55: Global Proteomics Market Revenue Million Forecast, by Country 2019 & 2032
- Table 56: Global Proteomics Market Volume K Unit Forecast, by Country 2019 & 2032
- Table 57: Brazil Proteomics Market Revenue (Million) Forecast, by Application 2019 & 2032
- Table 58: Brazil Proteomics Market Volume (K Unit) Forecast, by Application 2019 & 2032
- Table 59: Argentina Proteomics Market Revenue (Million) Forecast, by Application 2019 & 2032
- Table 60: Argentina Proteomics Market Volume (K Unit) Forecast, by Application 2019 & 2032
- Table 61: Rest of South America Proteomics Market Revenue (Million) Forecast, by Application 2019 & 2032
- Table 62: Rest of South America Proteomics Market Volume (K Unit) Forecast, by Application 2019 & 2032
- Table 63: Global Proteomics Market Revenue Million Forecast, by Product & Services 2019 & 2032
- Table 64: Global Proteomics Market Volume K Unit Forecast, by Product & Services 2019 & 2032
- Table 65: Global Proteomics Market Revenue Million Forecast, by Application 2019 & 2032
- Table 66: Global Proteomics Market Volume K Unit Forecast, by Application 2019 & 2032
- Table 67: Global Proteomics Market Revenue Million Forecast, by Country 2019 & 2032
- Table 68: Global Proteomics Market Volume K Unit Forecast, by Country 2019 & 2032
- Table 69: United States Proteomics Market Revenue (Million) Forecast, by Application 2019 & 2032
- Table 70: United States Proteomics Market Volume (K Unit) Forecast, by Application 2019 & 2032
- Table 71: Canada Proteomics Market Revenue (Million) Forecast, by Application 2019 & 2032
- Table 72: Canada Proteomics Market Volume (K Unit) Forecast, by Application 2019 & 2032
- Table 73: Mexico Proteomics Market Revenue (Million) Forecast, by Application 2019 & 2032
- Table 74: Mexico Proteomics Market Volume (K Unit) Forecast, by Application 2019 & 2032
- Table 75: Global Proteomics Market Revenue Million Forecast, by Product & Services 2019 & 2032
- Table 76: Global Proteomics Market Volume K Unit Forecast, by Product & Services 2019 & 2032
- Table 77: Global Proteomics Market Revenue Million Forecast, by Application 2019 & 2032
- Table 78: Global Proteomics Market Volume K Unit Forecast, by Application 2019 & 2032
- Table 79: Global Proteomics Market Revenue Million Forecast, by Country 2019 & 2032
- Table 80: Global Proteomics Market Volume K Unit Forecast, by Country 2019 & 2032
- Table 81: Germany Proteomics Market Revenue (Million) Forecast, by Application 2019 & 2032
- Table 82: Germany Proteomics Market Volume (K Unit) Forecast, by Application 2019 & 2032
- Table 83: United Kingdom Proteomics Market Revenue (Million) Forecast, by Application 2019 & 2032
- Table 84: United Kingdom Proteomics Market Volume (K Unit) Forecast, by Application 2019 & 2032
- Table 85: France Proteomics Market Revenue (Million) Forecast, by Application 2019 & 2032
- Table 86: France Proteomics Market Volume (K Unit) Forecast, by Application 2019 & 2032
- Table 87: Italy Proteomics Market Revenue (Million) Forecast, by Application 2019 & 2032
- Table 88: Italy Proteomics Market Volume (K Unit) Forecast, by Application 2019 & 2032
- Table 89: Spain Proteomics Market Revenue (Million) Forecast, by Application 2019 & 2032
- Table 90: Spain Proteomics Market Volume (K Unit) Forecast, by Application 2019 & 2032
- Table 91: Rest of Europe Proteomics Market Revenue (Million) Forecast, by Application 2019 & 2032
- Table 92: Rest of Europe Proteomics Market Volume (K Unit) Forecast, by Application 2019 & 2032
- Table 93: Global Proteomics Market Revenue Million Forecast, by Product & Services 2019 & 2032
- Table 94: Global Proteomics Market Volume K Unit Forecast, by Product & Services 2019 & 2032
- Table 95: Global Proteomics Market Revenue Million Forecast, by Application 2019 & 2032
- Table 96: Global Proteomics Market Volume K Unit Forecast, by Application 2019 & 2032
- Table 97: Global Proteomics Market Revenue Million Forecast, by Country 2019 & 2032
- Table 98: Global Proteomics Market Volume K Unit Forecast, by Country 2019 & 2032
- Table 99: China Proteomics Market Revenue (Million) Forecast, by Application 2019 & 2032
- Table 100: China Proteomics Market Volume (K Unit) Forecast, by Application 2019 & 2032
- Table 101: Japan Proteomics Market Revenue (Million) Forecast, by Application 2019 & 2032
- Table 102: Japan Proteomics Market Volume (K Unit) Forecast, by Application 2019 & 2032
- Table 103: India Proteomics Market Revenue (Million) Forecast, by Application 2019 & 2032
- Table 104: India Proteomics Market Volume (K Unit) Forecast, by Application 2019 & 2032
- Table 105: Australia Proteomics Market Revenue (Million) Forecast, by Application 2019 & 2032
- Table 106: Australia Proteomics Market Volume (K Unit) Forecast, by Application 2019 & 2032
- Table 107: South Korea Proteomics Market Revenue (Million) Forecast, by Application 2019 & 2032
- Table 108: South Korea Proteomics Market Volume (K Unit) Forecast, by Application 2019 & 2032
- Table 109: Rest of Asia Pacific Proteomics Market Revenue (Million) Forecast, by Application 2019 & 2032
- Table 110: Rest of Asia Pacific Proteomics Market Volume (K Unit) Forecast, by Application 2019 & 2032
- Table 111: Global Proteomics Market Revenue Million Forecast, by Product & Services 2019 & 2032
- Table 112: Global Proteomics Market Volume K Unit Forecast, by Product & Services 2019 & 2032
- Table 113: Global Proteomics Market Revenue Million Forecast, by Application 2019 & 2032
- Table 114: Global Proteomics Market Volume K Unit Forecast, by Application 2019 & 2032
- Table 115: Global Proteomics Market Revenue Million Forecast, by Country 2019 & 2032
- Table 116: Global Proteomics Market Volume K Unit Forecast, by Country 2019 & 2032
- Table 117: Global Proteomics Market Revenue Million Forecast, by Product & Services 2019 & 2032
- Table 118: Global Proteomics Market Volume K Unit Forecast, by Product & Services 2019 & 2032
- Table 119: Global Proteomics Market Revenue Million Forecast, by Application 2019 & 2032
- Table 120: Global Proteomics Market Volume K Unit Forecast, by Application 2019 & 2032
- Table 121: Global Proteomics Market Revenue Million Forecast, by Country 2019 & 2032
- Table 122: Global Proteomics Market Volume K Unit Forecast, by Country 2019 & 2032
- Table 123: South Africa Proteomics Market Revenue (Million) Forecast, by Application 2019 & 2032
- Table 124: South Africa Proteomics Market Volume (K Unit) Forecast, by Application 2019 & 2032
- Table 125: Rest of Middle East Proteomics Market Revenue (Million) Forecast, by Application 2019 & 2032
- Table 126: Rest of Middle East Proteomics Market Volume (K Unit) Forecast, by Application 2019 & 2032
- Table 127: Global Proteomics Market Revenue Million Forecast, by Product & Services 2019 & 2032
- Table 128: Global Proteomics Market Volume K Unit Forecast, by Product & Services 2019 & 2032
- Table 129: Global Proteomics Market Revenue Million Forecast, by Application 2019 & 2032
- Table 130: Global Proteomics Market Volume K Unit Forecast, by Application 2019 & 2032
- Table 131: Global Proteomics Market Revenue Million Forecast, by Country 2019 & 2032
- Table 132: Global Proteomics Market Volume K Unit Forecast, by Country 2019 & 2032
- Table 133: Brazil Proteomics Market Revenue (Million) Forecast, by Application 2019 & 2032
- Table 134: Brazil Proteomics Market Volume (K Unit) Forecast, by Application 2019 & 2032
- Table 135: Argentina Proteomics Market Revenue (Million) Forecast, by Application 2019 & 2032
- Table 136: Argentina Proteomics Market Volume (K Unit) Forecast, by Application 2019 & 2032
- Table 137: Rest of South America Proteomics Market Revenue (Million) Forecast, by Application 2019 & 2032
- Table 138: Rest of South America Proteomics Market Volume (K Unit) Forecast, by Application 2019 & 2032
Frequently Asked Questions
1. What is the projected Compound Annual Growth Rate (CAGR) of the Proteomics Market?
The projected CAGR is approximately 8.42%.
2. Which companies are prominent players in the Proteomics Market?
Key companies in the market include Promega Corporation, Bio-Rad Laboratories Inc, Waters Corporation, Merck KGaA, GE Healthcare, Thermo Fisher Scientific Inc, Danaher Corporation, Agilent Technologies Inc, Bruker Corporation.
3. What are the main segments of the Proteomics Market?
The market segments include Product & Services, Application.
4. Can you provide details about the market size?
The market size is estimated to be USD 27.60 Million as of 2022.
5. What are some drivers contributing to market growth?
Rising Demand for Personalized Medicine; Increasing R&D Expenditure and Government Funding for Proteomics; Technological Advancements.
6. What are the notable trends driving market growth?
Drug Discovery is Expected to Witness Healthy CAGR in Future.
7. Are there any restraints impacting market growth?
High Cost of Instruments.
8. Can you provide examples of recent developments in the market?
N/A
9. What pricing options are available for accessing the report?
Pricing options include single-user, multi-user, and enterprise licenses priced at USD 4750, USD 5250, and USD 8750 respectively.
10. Is the market size provided in terms of value or volume?
The market size is provided in terms of value, measured in Million and volume, measured in K Unit.
11. Are there any specific market keywords associated with the report?
Yes, the market keyword associated with the report is "Proteomics Market," which aids in identifying and referencing the specific market segment covered.
12. How do I determine which pricing option suits my needs best?
The pricing options vary based on user requirements and access needs. Individual users may opt for single-user licenses, while businesses requiring broader access may choose multi-user or enterprise licenses for cost-effective access to the report.
13. Are there any additional resources or data provided in the Proteomics Market report?
While the report offers comprehensive insights, it's advisable to review the specific contents or supplementary materials provided to ascertain if additional resources or data are available.
14. How can I stay updated on further developments or reports in the Proteomics Market?
To stay informed about further developments, trends, and reports in the Proteomics Market, consider subscribing to industry newsletters, following relevant companies and organizations, or regularly checking reputable industry news sources and publications.
Methodology
Step 1 - Identification of Relevant Samples Size from Population Database


Step 2 - Approaches for Defining Global Market Size (Value, Volume* & Price*)

Note*: In applicable scenarios
Step 3 - Data Sources
Primary Research
- Web Analytics
- Survey Reports
- Research Institute
- Latest Research Reports
- Opinion Leaders
Secondary Research
- Annual Reports
- White Paper
- Latest Press Release
- Industry Association
- Paid Database
- Investor Presentations

Step 4 - Data Triangulation
Involves using different sources of information in order to increase the validity of a study
These sources are likely to be stakeholders in a program - participants, other researchers, program staff, other community members, and so on.
Then we put all data in single framework & apply various statistical tools to find out the dynamic on the market.
During the analysis stage, feedback from the stakeholder groups would be compared to determine areas of agreement as well as areas of divergence
