

Key Insights
The global car safety seat market is experiencing robust expansion, propelled by heightened child safety awareness and increasing global birth rates. Key growth drivers include stringent government mandates for car seat usage, rising disposable incomes in emerging economies fostering greater consumer investment in child safety solutions, and the growing demand for advanced safety features such as superior side-impact protection and innovative harness designs. The market is segmented by product type (infant, convertible, booster seats), material, distribution channel (online, physical retail), and geography. Leading brands like Graco, Britax, and Maxi-Cosi are solidifying their market positions through brand strength and technological innovation. Nevertheless, intense competition and volatile raw material costs present market challenges.
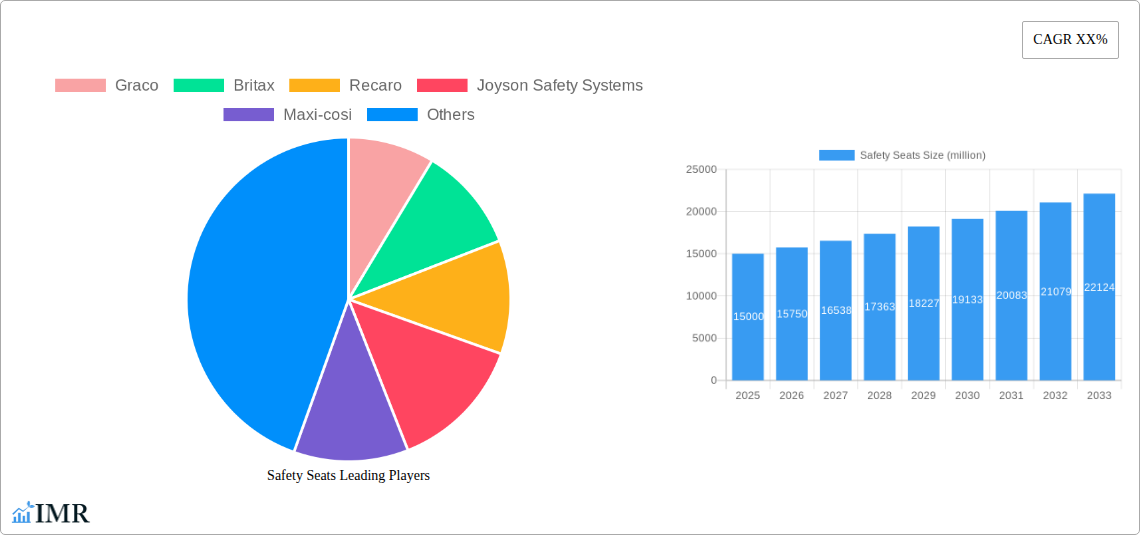
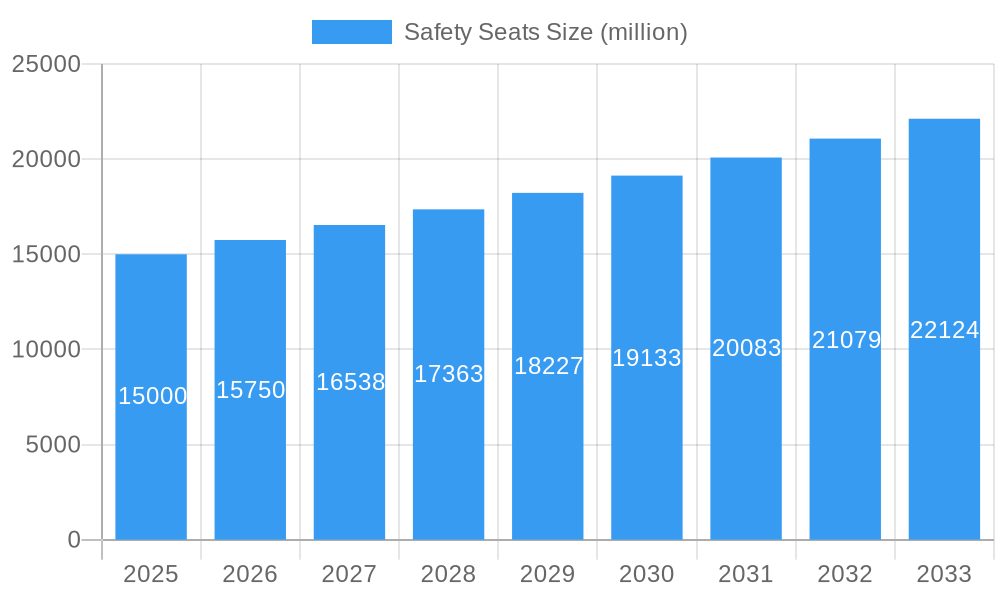
Safety Seats Market Size (In Billion)
The forecast period of 2024-2033 anticipates significant market development. With a projected Compound Annual Growth Rate (CAGR) of 7.29%, the market is expected to reach a size of 3.86 billion by 2033. This growth will be sustained by the continuous innovation of technologically advanced and safer car seats, emphasizing improved ergonomics and user convenience. Furthermore, ongoing awareness campaigns by safety organizations and governmental bodies are anticipated to further stimulate market expansion. However, economic uncertainties and potential shifts in consumer preferences may influence growth. Regional variations are expected, with developed markets potentially showing more moderate growth compared to rapidly developing economies experiencing increased urbanization and automotive adoption.
Safety Seats Company Market Share
Safety Seats Market Report: 2019-2033
This comprehensive report provides a detailed analysis of the global safety seats market, encompassing historical data (2019-2024), current estimates (2025), and future forecasts (2025-2033). The report delves into market dynamics, growth trends, regional performance, product landscapes, and key players, providing invaluable insights for industry professionals, investors, and stakeholders. With a focus on both the parent market (child safety products) and the child market (infant and child car seats), this report offers a granular understanding of this vital sector. The market size is projected to reach xx million units by 2033.
Safety Seats Market Dynamics & Structure
This section analyzes the competitive landscape, technological advancements, regulatory influences, and market trends shaping the safety seats industry. The market is moderately concentrated, with a few key players holding significant market share. Technological innovation, driven by enhanced safety features and materials, is a primary growth driver. Stringent safety regulations and standards across various geographies play a significant role in shaping product development and market dynamics. The presence of substitute products, such as car-integrated safety systems, poses a competitive challenge. The end-user demographic primarily comprises parents and caregivers of infants and young children, with preferences and purchasing decisions influenced by factors such as safety, comfort, and price. Market consolidation through mergers and acquisitions (M&A) is also observed, with xx M&A deals recorded between 2019 and 2024.
- Market Concentration: Moderately concentrated, with top 5 players holding approximately xx% market share in 2024.
- Technological Innovation: Focus on advanced materials, improved crash protection, and user-friendly features.
- Regulatory Landscape: Stringent safety standards and regulations influence product design and market access.
- Competitive Substitutes: Car-integrated safety systems pose a competitive threat.
- End-User Demographics: Primarily parents and caregivers of infants and young children.
- M&A Activity: xx M&A deals observed between 2019 and 2024, indicating industry consolidation.
Safety Seats Growth Trends & Insights
The global safety seats market experienced robust growth during the historical period (2019-2024), driven by factors such as increasing awareness of child safety, rising disposable incomes in emerging economies, and the stringent enforcement of child safety regulations. The market is expected to continue its expansion during the forecast period (2025-2033), exhibiting a Compound Annual Growth Rate (CAGR) of xx%. Technological advancements, such as the introduction of ISOFIX systems and improved restraint technologies, are further accelerating market adoption. Consumer behavior is shifting towards premium products with enhanced safety features and user convenience. Market penetration is currently at xx% in developed countries and is projected to reach xx% by 2033.
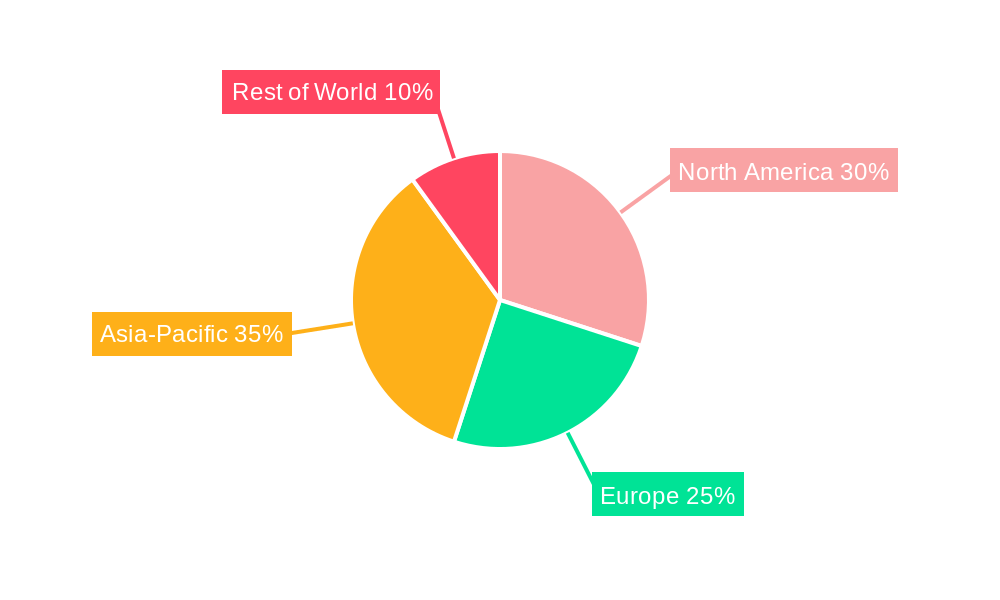
Dominant Regions, Countries, or Segments in Safety Seats
North America and Europe currently dominate the safety seats market, driven by high consumer awareness, stringent safety regulations, and high disposable incomes. However, the Asia-Pacific region is anticipated to witness significant growth in the coming years, fuelled by rising birth rates, increasing urbanization, and improving economic conditions. The infant car seat segment holds the largest market share, followed by toddler and booster seats.
- North America: High consumer awareness of child safety and stringent regulations.
- Europe: Established market with high adoption rates and a strong regulatory framework.
- Asia-Pacific: Rapid growth potential driven by increasing birth rates and improving economic conditions.
- Infant Car Seats: Largest market segment due to higher initial adoption rates.
Safety Seats Product Landscape
The safety seats market offers a diverse range of products, catering to various age groups and vehicle types. Innovations focus on improving safety performance, enhancing user experience, and incorporating advanced technologies like impact-absorbing materials, improved harness systems, and ISOFIX compatibility. Unique selling propositions include features like improved side-impact protection, ergonomic designs, and easy installation systems. Technological advancements aim to minimize the risk of improper installation and enhance child comfort during long journeys.
Key Drivers, Barriers & Challenges in Safety Seats
Key Drivers:
- Increasing awareness of child safety and the importance of proper car seat usage.
- Stringent government regulations and safety standards.
- Rising disposable incomes in developing economies.
- Technological innovations in car seat design and materials.
Key Challenges:
- Competition from low-cost manufacturers.
- Supply chain disruptions impacting production and availability.
- Difficulty in enforcing regulations in certain regions.
- Consumer confusion regarding appropriate car seat selection and installation.
Emerging Opportunities in Safety Seats
- Growing demand for convertible car seats offering extended usage.
- Increasing adoption of smart car seat technologies.
- Expansion into emerging markets with rising birth rates.
- Development of eco-friendly and sustainable car seat materials.
Growth Accelerators in the Safety Seats Industry
Technological advancements, strategic partnerships, and expansion into new markets are key drivers of long-term growth. The development of innovative materials, such as lightweight yet highly durable composites, and the integration of smart features like connectivity and sensors are propelling market expansion. Strategic alliances between car seat manufacturers and vehicle manufacturers are facilitating the integration of safety seats with vehicles.
Notable Milestones in Safety Seats Sector
- 2020: Introduction of new safety standards by the European Union.
- 2021: Launch of several innovative car seat models with improved side impact protection.
- 2022: Merger between two major safety seat manufacturers.
- 2023: Increased investment in research and development of lightweight and sustainable car seat materials.
- 2024: Introduction of smart car seat technologies with connectivity features.
In-Depth Safety Seats Market Outlook
The safety seats market is poised for continued growth, driven by technological advancements, evolving consumer preferences, and expanding regulatory frameworks. The development of smarter, safer, and more sustainable car seats will be critical in driving future growth. Strategic partnerships and expansion into new markets will be crucial for manufacturers seeking to capitalize on emerging opportunities. The forecast indicates significant potential for market expansion, with xx million units projected by 2033.
Safety Seats Segmentation
-
1. Application
- 1.1. OEM Market
- 1.2. Automobile After Market
-
2. Types
- 2.1. Rearward-facing baby seat
- 2.2. Combination seat (Rearward and Forward-facing)
- 2.3. Forward-facing child seat
- 2.4. High-backed Booster Seat
- 2.5. Low-backed Booster Seat
- 2.6. Booster Cushion
Safety Seats Segmentation By Geography
-
1. North America
- 1.1. United States
- 1.2. Canada
- 1.3. Mexico
-
2. South America
- 2.1. Brazil
- 2.2. Argentina
- 2.3. Rest of South America
-
3. Europe
- 3.1. United Kingdom
- 3.2. Germany
- 3.3. France
- 3.4. Italy
- 3.5. Spain
- 3.6. Russia
- 3.7. Benelux
- 3.8. Nordics
- 3.9. Rest of Europe
-
4. Middle East & Africa
- 4.1. Turkey
- 4.2. Israel
- 4.3. GCC
- 4.4. North Africa
- 4.5. South Africa
- 4.6. Rest of Middle East & Africa
-
5. Asia Pacific
- 5.1. China
- 5.2. India
- 5.3. Japan
- 5.4. South Korea
- 5.5. ASEAN
- 5.6. Oceania
- 5.7. Rest of Asia Pacific
Safety Seats Regional Market Share
Geographic Coverage of Safety Seats
Safety Seats REPORT HIGHLIGHTS
| Aspects | Details |
|---|---|
| Study Period | 2020-2034 |
| Base Year | 2025 |
| Estimated Year | 2026 |
| Forecast Period | 2026-2034 |
| Historical Period | 2020-2025 |
| Growth Rate | CAGR of 7.29% from 2020-2034 |
| Segmentation |
|
Table of Contents
- 1. Introduction
- 1.1. Research Scope
- 1.2. Market Segmentation
- 1.3. Research Methodology
- 1.4. Definitions and Assumptions
- 2. Executive Summary
- 2.1. Introduction
- 3. Market Dynamics
- 3.1. Introduction
- 3.2. Market Drivers
- 3.3. Market Restrains
- 3.4. Market Trends
- 4. Market Factor Analysis
- 4.1. Porters Five Forces
- 4.2. Supply/Value Chain
- 4.3. PESTEL analysis
- 4.4. Market Entropy
- 4.5. Patent/Trademark Analysis
- 5. Global Safety Seats Analysis, Insights and Forecast, 2020-2032
- 5.1. Market Analysis, Insights and Forecast - by Application
- 5.1.1. OEM Market
- 5.1.2. Automobile After Market
- 5.2. Market Analysis, Insights and Forecast - by Types
- 5.2.1. Rearward-facing baby seat
- 5.2.2. Combination seat (Rearward and Forward-facing)
- 5.2.3. Forward-facing child seat
- 5.2.4. High-backed Booster Seat
- 5.2.5. Low-backed Booster Seat
- 5.2.6. Booster Cushion
- 5.3. Market Analysis, Insights and Forecast - by Region
- 5.3.1. North America
- 5.3.2. South America
- 5.3.3. Europe
- 5.3.4. Middle East & Africa
- 5.3.5. Asia Pacific
- 5.1. Market Analysis, Insights and Forecast - by Application
- 6. North America Safety Seats Analysis, Insights and Forecast, 2020-2032
- 6.1. Market Analysis, Insights and Forecast - by Application
- 6.1.1. OEM Market
- 6.1.2. Automobile After Market
- 6.2. Market Analysis, Insights and Forecast - by Types
- 6.2.1. Rearward-facing baby seat
- 6.2.2. Combination seat (Rearward and Forward-facing)
- 6.2.3. Forward-facing child seat
- 6.2.4. High-backed Booster Seat
- 6.2.5. Low-backed Booster Seat
- 6.2.6. Booster Cushion
- 6.1. Market Analysis, Insights and Forecast - by Application
- 7. South America Safety Seats Analysis, Insights and Forecast, 2020-2032
- 7.1. Market Analysis, Insights and Forecast - by Application
- 7.1.1. OEM Market
- 7.1.2. Automobile After Market
- 7.2. Market Analysis, Insights and Forecast - by Types
- 7.2.1. Rearward-facing baby seat
- 7.2.2. Combination seat (Rearward and Forward-facing)
- 7.2.3. Forward-facing child seat
- 7.2.4. High-backed Booster Seat
- 7.2.5. Low-backed Booster Seat
- 7.2.6. Booster Cushion
- 7.1. Market Analysis, Insights and Forecast - by Application
- 8. Europe Safety Seats Analysis, Insights and Forecast, 2020-2032
- 8.1. Market Analysis, Insights and Forecast - by Application
- 8.1.1. OEM Market
- 8.1.2. Automobile After Market
- 8.2. Market Analysis, Insights and Forecast - by Types
- 8.2.1. Rearward-facing baby seat
- 8.2.2. Combination seat (Rearward and Forward-facing)
- 8.2.3. Forward-facing child seat
- 8.2.4. High-backed Booster Seat
- 8.2.5. Low-backed Booster Seat
- 8.2.6. Booster Cushion
- 8.1. Market Analysis, Insights and Forecast - by Application
- 9. Middle East & Africa Safety Seats Analysis, Insights and Forecast, 2020-2032
- 9.1. Market Analysis, Insights and Forecast - by Application
- 9.1.1. OEM Market
- 9.1.2. Automobile After Market
- 9.2. Market Analysis, Insights and Forecast - by Types
- 9.2.1. Rearward-facing baby seat
- 9.2.2. Combination seat (Rearward and Forward-facing)
- 9.2.3. Forward-facing child seat
- 9.2.4. High-backed Booster Seat
- 9.2.5. Low-backed Booster Seat
- 9.2.6. Booster Cushion
- 9.1. Market Analysis, Insights and Forecast - by Application
- 10. Asia Pacific Safety Seats Analysis, Insights and Forecast, 2020-2032
- 10.1. Market Analysis, Insights and Forecast - by Application
- 10.1.1. OEM Market
- 10.1.2. Automobile After Market
- 10.2. Market Analysis, Insights and Forecast - by Types
- 10.2.1. Rearward-facing baby seat
- 10.2.2. Combination seat (Rearward and Forward-facing)
- 10.2.3. Forward-facing child seat
- 10.2.4. High-backed Booster Seat
- 10.2.5. Low-backed Booster Seat
- 10.2.6. Booster Cushion
- 10.1. Market Analysis, Insights and Forecast - by Application
- 11. Competitive Analysis
- 11.1. Global Market Share Analysis 2025
- 11.2. Company Profiles
- 11.2.1 Graco
- 11.2.1.1. Overview
- 11.2.1.2. Products
- 11.2.1.3. SWOT Analysis
- 11.2.1.4. Recent Developments
- 11.2.1.5. Financials (Based on Availability)
- 11.2.2 Britax
- 11.2.2.1. Overview
- 11.2.2.2. Products
- 11.2.2.3. SWOT Analysis
- 11.2.2.4. Recent Developments
- 11.2.2.5. Financials (Based on Availability)
- 11.2.3 Recaro
- 11.2.3.1. Overview
- 11.2.3.2. Products
- 11.2.3.3. SWOT Analysis
- 11.2.3.4. Recent Developments
- 11.2.3.5. Financials (Based on Availability)
- 11.2.4 Joyson Safety Systems
- 11.2.4.1. Overview
- 11.2.4.2. Products
- 11.2.4.3. SWOT Analysis
- 11.2.4.4. Recent Developments
- 11.2.4.5. Financials (Based on Availability)
- 11.2.5 Maxi-cosi
- 11.2.5.1. Overview
- 11.2.5.2. Products
- 11.2.5.3. SWOT Analysis
- 11.2.5.4. Recent Developments
- 11.2.5.5. Financials (Based on Availability)
- 11.2.6 Chicco
- 11.2.6.1. Overview
- 11.2.6.2. Products
- 11.2.6.3. SWOT Analysis
- 11.2.6.4. Recent Developments
- 11.2.6.5. Financials (Based on Availability)
- 11.2.7 Combi
- 11.2.7.1. Overview
- 11.2.7.2. Products
- 11.2.7.3. SWOT Analysis
- 11.2.7.4. Recent Developments
- 11.2.7.5. Financials (Based on Availability)
- 11.2.8 Jane
- 11.2.8.1. Overview
- 11.2.8.2. Products
- 11.2.8.3. SWOT Analysis
- 11.2.8.4. Recent Developments
- 11.2.8.5. Financials (Based on Availability)
- 11.2.9 BeSafe
- 11.2.9.1. Overview
- 11.2.9.2. Products
- 11.2.9.3. SWOT Analysis
- 11.2.9.4. Recent Developments
- 11.2.9.5. Financials (Based on Availability)
- 11.2.10 Concord
- 11.2.10.1. Overview
- 11.2.10.2. Products
- 11.2.10.3. SWOT Analysis
- 11.2.10.4. Recent Developments
- 11.2.10.5. Financials (Based on Availability)
- 11.2.11 Aprica
- 11.2.11.1. Overview
- 11.2.11.2. Products
- 11.2.11.3. SWOT Analysis
- 11.2.11.4. Recent Developments
- 11.2.11.5. Financials (Based on Availability)
- 11.2.12 Stokke
- 11.2.12.1. Overview
- 11.2.12.2. Products
- 11.2.12.3. SWOT Analysis
- 11.2.12.4. Recent Developments
- 11.2.12.5. Financials (Based on Availability)
- 11.2.13 Kiddy
- 11.2.13.1. Overview
- 11.2.13.2. Products
- 11.2.13.3. SWOT Analysis
- 11.2.13.4. Recent Developments
- 11.2.13.5. Financials (Based on Availability)
- 11.2.14 Ailebebe
- 11.2.14.1. Overview
- 11.2.14.2. Products
- 11.2.14.3. SWOT Analysis
- 11.2.14.4. Recent Developments
- 11.2.14.5. Financials (Based on Availability)
- 11.2.15 Goodbaby
- 11.2.15.1. Overview
- 11.2.15.2. Products
- 11.2.15.3. SWOT Analysis
- 11.2.15.4. Recent Developments
- 11.2.15.5. Financials (Based on Availability)
- 11.2.16 Babyfirst
- 11.2.16.1. Overview
- 11.2.16.2. Products
- 11.2.16.3. SWOT Analysis
- 11.2.16.4. Recent Developments
- 11.2.16.5. Financials (Based on Availability)
- 11.2.17 Best Baby
- 11.2.17.1. Overview
- 11.2.17.2. Products
- 11.2.17.3. SWOT Analysis
- 11.2.17.4. Recent Developments
- 11.2.17.5. Financials (Based on Availability)
- 11.2.18 Welldon
- 11.2.18.1. Overview
- 11.2.18.2. Products
- 11.2.18.3. SWOT Analysis
- 11.2.18.4. Recent Developments
- 11.2.18.5. Financials (Based on Availability)
- 11.2.19 Belovedbaby
- 11.2.19.1. Overview
- 11.2.19.2. Products
- 11.2.19.3. SWOT Analysis
- 11.2.19.4. Recent Developments
- 11.2.19.5. Financials (Based on Availability)
- 11.2.20 Ganen
- 11.2.20.1. Overview
- 11.2.20.2. Products
- 11.2.20.3. SWOT Analysis
- 11.2.20.4. Recent Developments
- 11.2.20.5. Financials (Based on Availability)
- 11.2.21 ABYY
- 11.2.21.1. Overview
- 11.2.21.2. Products
- 11.2.21.3. SWOT Analysis
- 11.2.21.4. Recent Developments
- 11.2.21.5. Financials (Based on Availability)
- 11.2.22 Leka
- 11.2.22.1. Overview
- 11.2.22.2. Products
- 11.2.22.3. SWOT Analysis
- 11.2.22.4. Recent Developments
- 11.2.22.5. Financials (Based on Availability)
- 11.2.23 Lutule
- 11.2.23.1. Overview
- 11.2.23.2. Products
- 11.2.23.3. SWOT Analysis
- 11.2.23.4. Recent Developments
- 11.2.23.5. Financials (Based on Availability)
- 11.2.1 Graco
List of Figures
- Figure 1: Global Safety Seats Revenue Breakdown (billion, %) by Region 2025 & 2033
- Figure 2: Global Safety Seats Volume Breakdown (K, %) by Region 2025 & 2033
- Figure 3: North America Safety Seats Revenue (billion), by Application 2025 & 2033
- Figure 4: North America Safety Seats Volume (K), by Application 2025 & 2033
- Figure 5: North America Safety Seats Revenue Share (%), by Application 2025 & 2033
- Figure 6: North America Safety Seats Volume Share (%), by Application 2025 & 2033
- Figure 7: North America Safety Seats Revenue (billion), by Types 2025 & 2033
- Figure 8: North America Safety Seats Volume (K), by Types 2025 & 2033
- Figure 9: North America Safety Seats Revenue Share (%), by Types 2025 & 2033
- Figure 10: North America Safety Seats Volume Share (%), by Types 2025 & 2033
- Figure 11: North America Safety Seats Revenue (billion), by Country 2025 & 2033
- Figure 12: North America Safety Seats Volume (K), by Country 2025 & 2033
- Figure 13: North America Safety Seats Revenue Share (%), by Country 2025 & 2033
- Figure 14: North America Safety Seats Volume Share (%), by Country 2025 & 2033
- Figure 15: South America Safety Seats Revenue (billion), by Application 2025 & 2033
- Figure 16: South America Safety Seats Volume (K), by Application 2025 & 2033
- Figure 17: South America Safety Seats Revenue Share (%), by Application 2025 & 2033
- Figure 18: South America Safety Seats Volume Share (%), by Application 2025 & 2033
- Figure 19: South America Safety Seats Revenue (billion), by Types 2025 & 2033
- Figure 20: South America Safety Seats Volume (K), by Types 2025 & 2033
- Figure 21: South America Safety Seats Revenue Share (%), by Types 2025 & 2033
- Figure 22: South America Safety Seats Volume Share (%), by Types 2025 & 2033
- Figure 23: South America Safety Seats Revenue (billion), by Country 2025 & 2033
- Figure 24: South America Safety Seats Volume (K), by Country 2025 & 2033
- Figure 25: South America Safety Seats Revenue Share (%), by Country 2025 & 2033
- Figure 26: South America Safety Seats Volume Share (%), by Country 2025 & 2033
- Figure 27: Europe Safety Seats Revenue (billion), by Application 2025 & 2033
- Figure 28: Europe Safety Seats Volume (K), by Application 2025 & 2033
- Figure 29: Europe Safety Seats Revenue Share (%), by Application 2025 & 2033
- Figure 30: Europe Safety Seats Volume Share (%), by Application 2025 & 2033
- Figure 31: Europe Safety Seats Revenue (billion), by Types 2025 & 2033
- Figure 32: Europe Safety Seats Volume (K), by Types 2025 & 2033
- Figure 33: Europe Safety Seats Revenue Share (%), by Types 2025 & 2033
- Figure 34: Europe Safety Seats Volume Share (%), by Types 2025 & 2033
- Figure 35: Europe Safety Seats Revenue (billion), by Country 2025 & 2033
- Figure 36: Europe Safety Seats Volume (K), by Country 2025 & 2033
- Figure 37: Europe Safety Seats Revenue Share (%), by Country 2025 & 2033
- Figure 38: Europe Safety Seats Volume Share (%), by Country 2025 & 2033
- Figure 39: Middle East & Africa Safety Seats Revenue (billion), by Application 2025 & 2033
- Figure 40: Middle East & Africa Safety Seats Volume (K), by Application 2025 & 2033
- Figure 41: Middle East & Africa Safety Seats Revenue Share (%), by Application 2025 & 2033
- Figure 42: Middle East & Africa Safety Seats Volume Share (%), by Application 2025 & 2033
- Figure 43: Middle East & Africa Safety Seats Revenue (billion), by Types 2025 & 2033
- Figure 44: Middle East & Africa Safety Seats Volume (K), by Types 2025 & 2033
- Figure 45: Middle East & Africa Safety Seats Revenue Share (%), by Types 2025 & 2033
- Figure 46: Middle East & Africa Safety Seats Volume Share (%), by Types 2025 & 2033
- Figure 47: Middle East & Africa Safety Seats Revenue (billion), by Country 2025 & 2033
- Figure 48: Middle East & Africa Safety Seats Volume (K), by Country 2025 & 2033
- Figure 49: Middle East & Africa Safety Seats Revenue Share (%), by Country 2025 & 2033
- Figure 50: Middle East & Africa Safety Seats Volume Share (%), by Country 2025 & 2033
- Figure 51: Asia Pacific Safety Seats Revenue (billion), by Application 2025 & 2033
- Figure 52: Asia Pacific Safety Seats Volume (K), by Application 2025 & 2033
- Figure 53: Asia Pacific Safety Seats Revenue Share (%), by Application 2025 & 2033
- Figure 54: Asia Pacific Safety Seats Volume Share (%), by Application 2025 & 2033
- Figure 55: Asia Pacific Safety Seats Revenue (billion), by Types 2025 & 2033
- Figure 56: Asia Pacific Safety Seats Volume (K), by Types 2025 & 2033
- Figure 57: Asia Pacific Safety Seats Revenue Share (%), by Types 2025 & 2033
- Figure 58: Asia Pacific Safety Seats Volume Share (%), by Types 2025 & 2033
- Figure 59: Asia Pacific Safety Seats Revenue (billion), by Country 2025 & 2033
- Figure 60: Asia Pacific Safety Seats Volume (K), by Country 2025 & 2033
- Figure 61: Asia Pacific Safety Seats Revenue Share (%), by Country 2025 & 2033
- Figure 62: Asia Pacific Safety Seats Volume Share (%), by Country 2025 & 2033
List of Tables
- Table 1: Global Safety Seats Revenue billion Forecast, by Application 2020 & 2033
- Table 2: Global Safety Seats Volume K Forecast, by Application 2020 & 2033
- Table 3: Global Safety Seats Revenue billion Forecast, by Types 2020 & 2033
- Table 4: Global Safety Seats Volume K Forecast, by Types 2020 & 2033
- Table 5: Global Safety Seats Revenue billion Forecast, by Region 2020 & 2033
- Table 6: Global Safety Seats Volume K Forecast, by Region 2020 & 2033
- Table 7: Global Safety Seats Revenue billion Forecast, by Application 2020 & 2033
- Table 8: Global Safety Seats Volume K Forecast, by Application 2020 & 2033
- Table 9: Global Safety Seats Revenue billion Forecast, by Types 2020 & 2033
- Table 10: Global Safety Seats Volume K Forecast, by Types 2020 & 2033
- Table 11: Global Safety Seats Revenue billion Forecast, by Country 2020 & 2033
- Table 12: Global Safety Seats Volume K Forecast, by Country 2020 & 2033
- Table 13: United States Safety Seats Revenue (billion) Forecast, by Application 2020 & 2033
- Table 14: United States Safety Seats Volume (K) Forecast, by Application 2020 & 2033
- Table 15: Canada Safety Seats Revenue (billion) Forecast, by Application 2020 & 2033
- Table 16: Canada Safety Seats Volume (K) Forecast, by Application 2020 & 2033
- Table 17: Mexico Safety Seats Revenue (billion) Forecast, by Application 2020 & 2033
- Table 18: Mexico Safety Seats Volume (K) Forecast, by Application 2020 & 2033
- Table 19: Global Safety Seats Revenue billion Forecast, by Application 2020 & 2033
- Table 20: Global Safety Seats Volume K Forecast, by Application 2020 & 2033
- Table 21: Global Safety Seats Revenue billion Forecast, by Types 2020 & 2033
- Table 22: Global Safety Seats Volume K Forecast, by Types 2020 & 2033
- Table 23: Global Safety Seats Revenue billion Forecast, by Country 2020 & 2033
- Table 24: Global Safety Seats Volume K Forecast, by Country 2020 & 2033
- Table 25: Brazil Safety Seats Revenue (billion) Forecast, by Application 2020 & 2033
- Table 26: Brazil Safety Seats Volume (K) Forecast, by Application 2020 & 2033
- Table 27: Argentina Safety Seats Revenue (billion) Forecast, by Application 2020 & 2033
- Table 28: Argentina Safety Seats Volume (K) Forecast, by Application 2020 & 2033
- Table 29: Rest of South America Safety Seats Revenue (billion) Forecast, by Application 2020 & 2033
- Table 30: Rest of South America Safety Seats Volume (K) Forecast, by Application 2020 & 2033
- Table 31: Global Safety Seats Revenue billion Forecast, by Application 2020 & 2033
- Table 32: Global Safety Seats Volume K Forecast, by Application 2020 & 2033
- Table 33: Global Safety Seats Revenue billion Forecast, by Types 2020 & 2033
- Table 34: Global Safety Seats Volume K Forecast, by Types 2020 & 2033
- Table 35: Global Safety Seats Revenue billion Forecast, by Country 2020 & 2033
- Table 36: Global Safety Seats Volume K Forecast, by Country 2020 & 2033
- Table 37: United Kingdom Safety Seats Revenue (billion) Forecast, by Application 2020 & 2033
- Table 38: United Kingdom Safety Seats Volume (K) Forecast, by Application 2020 & 2033
- Table 39: Germany Safety Seats Revenue (billion) Forecast, by Application 2020 & 2033
- Table 40: Germany Safety Seats Volume (K) Forecast, by Application 2020 & 2033
- Table 41: France Safety Seats Revenue (billion) Forecast, by Application 2020 & 2033
- Table 42: France Safety Seats Volume (K) Forecast, by Application 2020 & 2033
- Table 43: Italy Safety Seats Revenue (billion) Forecast, by Application 2020 & 2033
- Table 44: Italy Safety Seats Volume (K) Forecast, by Application 2020 & 2033
- Table 45: Spain Safety Seats Revenue (billion) Forecast, by Application 2020 & 2033
- Table 46: Spain Safety Seats Volume (K) Forecast, by Application 2020 & 2033
- Table 47: Russia Safety Seats Revenue (billion) Forecast, by Application 2020 & 2033
- Table 48: Russia Safety Seats Volume (K) Forecast, by Application 2020 & 2033
- Table 49: Benelux Safety Seats Revenue (billion) Forecast, by Application 2020 & 2033
- Table 50: Benelux Safety Seats Volume (K) Forecast, by Application 2020 & 2033
- Table 51: Nordics Safety Seats Revenue (billion) Forecast, by Application 2020 & 2033
- Table 52: Nordics Safety Seats Volume (K) Forecast, by Application 2020 & 2033
- Table 53: Rest of Europe Safety Seats Revenue (billion) Forecast, by Application 2020 & 2033
- Table 54: Rest of Europe Safety Seats Volume (K) Forecast, by Application 2020 & 2033
- Table 55: Global Safety Seats Revenue billion Forecast, by Application 2020 & 2033
- Table 56: Global Safety Seats Volume K Forecast, by Application 2020 & 2033
- Table 57: Global Safety Seats Revenue billion Forecast, by Types 2020 & 2033
- Table 58: Global Safety Seats Volume K Forecast, by Types 2020 & 2033
- Table 59: Global Safety Seats Revenue billion Forecast, by Country 2020 & 2033
- Table 60: Global Safety Seats Volume K Forecast, by Country 2020 & 2033
- Table 61: Turkey Safety Seats Revenue (billion) Forecast, by Application 2020 & 2033
- Table 62: Turkey Safety Seats Volume (K) Forecast, by Application 2020 & 2033
- Table 63: Israel Safety Seats Revenue (billion) Forecast, by Application 2020 & 2033
- Table 64: Israel Safety Seats Volume (K) Forecast, by Application 2020 & 2033
- Table 65: GCC Safety Seats Revenue (billion) Forecast, by Application 2020 & 2033
- Table 66: GCC Safety Seats Volume (K) Forecast, by Application 2020 & 2033
- Table 67: North Africa Safety Seats Revenue (billion) Forecast, by Application 2020 & 2033
- Table 68: North Africa Safety Seats Volume (K) Forecast, by Application 2020 & 2033
- Table 69: South Africa Safety Seats Revenue (billion) Forecast, by Application 2020 & 2033
- Table 70: South Africa Safety Seats Volume (K) Forecast, by Application 2020 & 2033
- Table 71: Rest of Middle East & Africa Safety Seats Revenue (billion) Forecast, by Application 2020 & 2033
- Table 72: Rest of Middle East & Africa Safety Seats Volume (K) Forecast, by Application 2020 & 2033
- Table 73: Global Safety Seats Revenue billion Forecast, by Application 2020 & 2033
- Table 74: Global Safety Seats Volume K Forecast, by Application 2020 & 2033
- Table 75: Global Safety Seats Revenue billion Forecast, by Types 2020 & 2033
- Table 76: Global Safety Seats Volume K Forecast, by Types 2020 & 2033
- Table 77: Global Safety Seats Revenue billion Forecast, by Country 2020 & 2033
- Table 78: Global Safety Seats Volume K Forecast, by Country 2020 & 2033
- Table 79: China Safety Seats Revenue (billion) Forecast, by Application 2020 & 2033
- Table 80: China Safety Seats Volume (K) Forecast, by Application 2020 & 2033
- Table 81: India Safety Seats Revenue (billion) Forecast, by Application 2020 & 2033
- Table 82: India Safety Seats Volume (K) Forecast, by Application 2020 & 2033
- Table 83: Japan Safety Seats Revenue (billion) Forecast, by Application 2020 & 2033
- Table 84: Japan Safety Seats Volume (K) Forecast, by Application 2020 & 2033
- Table 85: South Korea Safety Seats Revenue (billion) Forecast, by Application 2020 & 2033
- Table 86: South Korea Safety Seats Volume (K) Forecast, by Application 2020 & 2033
- Table 87: ASEAN Safety Seats Revenue (billion) Forecast, by Application 2020 & 2033
- Table 88: ASEAN Safety Seats Volume (K) Forecast, by Application 2020 & 2033
- Table 89: Oceania Safety Seats Revenue (billion) Forecast, by Application 2020 & 2033
- Table 90: Oceania Safety Seats Volume (K) Forecast, by Application 2020 & 2033
- Table 91: Rest of Asia Pacific Safety Seats Revenue (billion) Forecast, by Application 2020 & 2033
- Table 92: Rest of Asia Pacific Safety Seats Volume (K) Forecast, by Application 2020 & 2033
Frequently Asked Questions
1. What is the projected Compound Annual Growth Rate (CAGR) of the Safety Seats?
The projected CAGR is approximately 7.29%.
2. Which companies are prominent players in the Safety Seats?
Key companies in the market include Graco, Britax, Recaro, Joyson Safety Systems, Maxi-cosi, Chicco, Combi, Jane, BeSafe, Concord, Aprica, Stokke, Kiddy, Ailebebe, Goodbaby, Babyfirst, Best Baby, Welldon, Belovedbaby, Ganen, ABYY, Leka, Lutule.
3. What are the main segments of the Safety Seats?
The market segments include Application, Types.
4. Can you provide details about the market size?
The market size is estimated to be USD 3.86 billion as of 2022.
5. What are some drivers contributing to market growth?
N/A
6. What are the notable trends driving market growth?
N/A
7. Are there any restraints impacting market growth?
N/A
8. Can you provide examples of recent developments in the market?
N/A
9. What pricing options are available for accessing the report?
Pricing options include single-user, multi-user, and enterprise licenses priced at USD 3350.00, USD 5025.00, and USD 6700.00 respectively.
10. Is the market size provided in terms of value or volume?
The market size is provided in terms of value, measured in billion and volume, measured in K.
11. Are there any specific market keywords associated with the report?
Yes, the market keyword associated with the report is "Safety Seats," which aids in identifying and referencing the specific market segment covered.
12. How do I determine which pricing option suits my needs best?
The pricing options vary based on user requirements and access needs. Individual users may opt for single-user licenses, while businesses requiring broader access may choose multi-user or enterprise licenses for cost-effective access to the report.
13. Are there any additional resources or data provided in the Safety Seats report?
While the report offers comprehensive insights, it's advisable to review the specific contents or supplementary materials provided to ascertain if additional resources or data are available.
14. How can I stay updated on further developments or reports in the Safety Seats?
To stay informed about further developments, trends, and reports in the Safety Seats, consider subscribing to industry newsletters, following relevant companies and organizations, or regularly checking reputable industry news sources and publications.
Methodology
Step 1 - Identification of Relevant Samples Size from Population Database


Step 2 - Approaches for Defining Global Market Size (Value, Volume* & Price*)

Note*: In applicable scenarios
Step 3 - Data Sources
Primary Research
- Web Analytics
- Survey Reports
- Research Institute
- Latest Research Reports
- Opinion Leaders
Secondary Research
- Annual Reports
- White Paper
- Latest Press Release
- Industry Association
- Paid Database
- Investor Presentations

Step 4 - Data Triangulation
Involves using different sources of information in order to increase the validity of a study
These sources are likely to be stakeholders in a program - participants, other researchers, program staff, other community members, and so on.
Then we put all data in single framework & apply various statistical tools to find out the dynamic on the market.
During the analysis stage, feedback from the stakeholder groups would be compared to determine areas of agreement as well as areas of divergence