

Key Insights
The self-sampling blood collection and storage devices market is experiencing robust growth, driven by the increasing demand for convenient and accessible healthcare solutions, particularly in home-based diagnostics and remote patient monitoring. The market's expansion is fueled by several key factors, including the rising prevalence of chronic diseases requiring frequent blood testing, the growing adoption of telehealth and at-home healthcare, and advancements in point-of-care diagnostics. Technological innovations leading to more user-friendly and accurate devices, alongside the increasing availability of telehealth platforms capable of integrating these devices, are further contributing to market expansion. While regulatory hurdles and concerns regarding the accuracy and reliability of self-collected samples pose some challenges, the overall market trajectory indicates significant potential for growth in the coming years. A projected Compound Annual Growth Rate (CAGR) of approximately 15% from 2025 to 2033 suggests a substantial increase in market value, driven by factors mentioned above. The market is segmented by device type (e.g., capillary blood collection devices, venous blood collection devices), storage type (e.g., refrigerated, ambient), and end-user (e.g., hospitals, home-use). Key players are actively investing in research and development to improve the technology, expanding their product portfolios, and strengthening their market presence through strategic partnerships and acquisitions.
This market is witnessing the emergence of innovative solutions, including advanced sample stabilization techniques to improve sample quality and longevity, and integration with digital platforms for remote result reporting and patient management. This creates opportunities for enhanced patient experience and streamlined healthcare processes. The competitive landscape is dynamic, with numerous established and emerging companies vying for market share. Success in this market will rely on factors such as technological innovation, regulatory compliance, efficient distribution networks, and the ability to effectively address concerns regarding sample quality and patient safety. Geographic expansion, particularly in developing regions with limited access to traditional healthcare facilities, presents a significant growth avenue.
Self Sampling Blood Collection And Storage Devices Market Report: 2019-2033
This comprehensive report provides an in-depth analysis of the self-sampling blood collection and storage devices market, encompassing market dynamics, growth trends, regional dominance, product landscape, key players, and future outlook. The study period spans 2019-2033, with a base year of 2025 and a forecast period of 2025-2033. The report leverages extensive primary and secondary research to deliver actionable insights for industry professionals, investors, and stakeholders. The market is segmented by device type, application, end-user, and geography, providing a granular understanding of the market landscape.
Target Audience: This report is invaluable for manufacturers, distributors, researchers, investors, and healthcare professionals involved in the development, production, and utilization of self-sampling blood collection and storage devices.
Parent Market: In-vitro diagnostics (IVD) Market Child Market: Point-of-care testing (POCT)
Self Sampling Blood Collection And Storage Devices Market Dynamics & Structure
The self-sampling blood collection and storage devices market is experiencing significant growth, driven by technological advancements, increasing demand for convenient at-home testing, and a growing preference for decentralized healthcare solutions. Market concentration is currently moderate, with several key players competing. Technological innovation, particularly in areas like microfluidics and biosensors, is a primary driver. Regulatory frameworks, varying across different regions, impact market access and adoption rates. Competitive substitutes, such as traditional venous blood collection methods, continue to exist but face challenges in terms of convenience and cost-effectiveness. The end-user demographic is expanding, encompassing both consumers and healthcare providers. M&A activity in the sector has been moderate, with strategic acquisitions driving consolidation and expansion.
- Market Concentration: Moderate, with top 5 players holding an estimated xx% market share in 2025.
- Technological Innovation: Significant advancements in miniaturization, automation, and improved sample stability.
- Regulatory Frameworks: Varying approval processes across regions impacting market entry.
- Competitive Substitutes: Traditional venipuncture methods; competition intensifies based on ease of use, cost and accuracy.
- End-User Demographics: Expanding to include direct-to-consumer testing and healthcare facilities.
- M&A Trends: Moderate activity, primarily focused on strategic acquisitions of smaller players by larger companies. An estimated xx M&A deals occurred between 2019 and 2024.
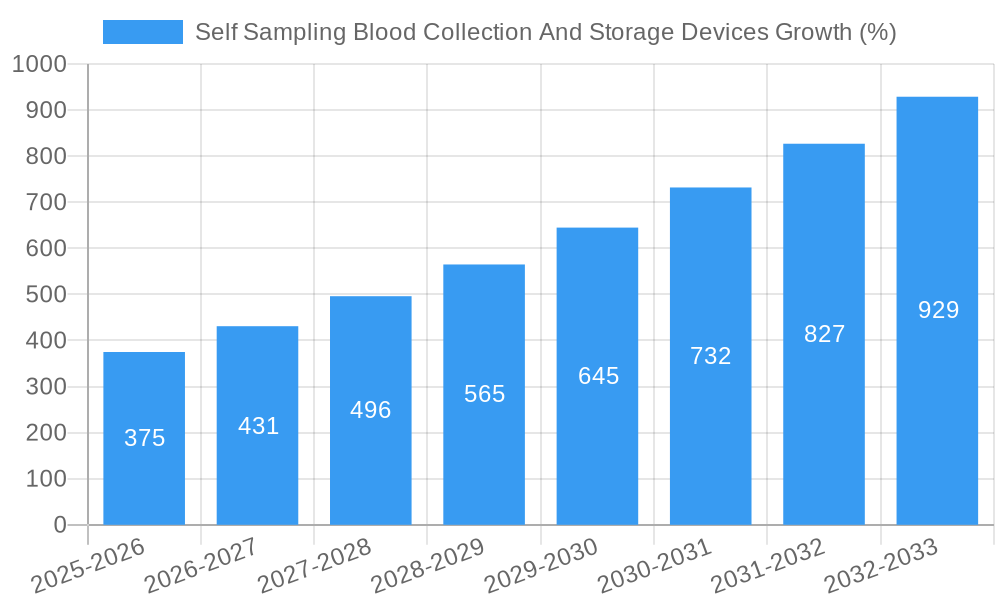
Self Sampling Blood Collection And Storage Devices Growth Trends & Insights
The self-sampling blood collection and storage devices market is projected to witness robust growth over the forecast period, driven by several factors. Market size is expanding significantly, with a CAGR of xx% expected from 2025 to 2033. Adoption rates are increasing, fueled by consumer demand for convenient and accessible healthcare solutions. Technological disruptions, including the development of advanced biosensors and microfluidic devices, are enhancing the accuracy and efficiency of self-sampling. Consumer behavior shifts toward proactive health management and remote patient monitoring further contribute to market growth. Market penetration is expected to reach xx% by 2033, significantly increasing from the xx% observed in 2025.
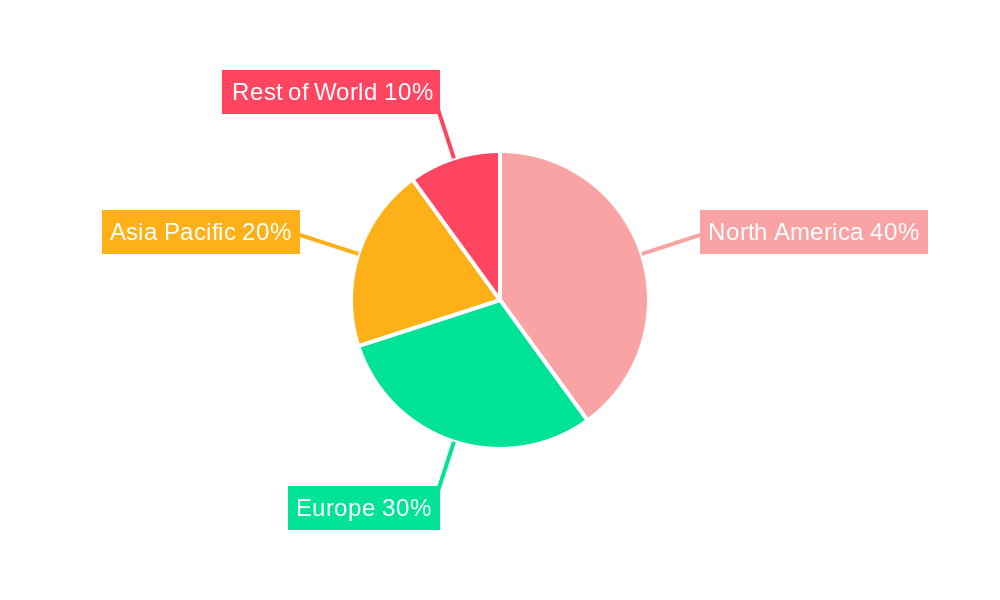
Dominant Regions, Countries, or Segments in Self Sampling Blood Collection And Storage Devices
North America currently holds the largest market share, driven by high adoption rates, advanced healthcare infrastructure, and strong regulatory support. Europe follows closely, with significant growth potential in emerging economies. Asia-Pacific is also witnessing rapid expansion, fueled by rising healthcare expenditure and increasing awareness of self-care practices. The leading segment is currently the at-home testing market, driven by consumer preference for convenience and affordability.
- North America: High adoption rates, strong regulatory support, advanced healthcare infrastructure.
- Europe: Growing market with significant potential in emerging economies.
- Asia-Pacific: Rapid expansion fueled by increasing healthcare expenditure and self-care awareness.
- Leading Segment: At-home testing, driven by convenience and affordability. Market share of approximately xx million units in 2025.
Self Sampling Blood Collection And Storage Devices Product Landscape
The product landscape encompasses a range of devices, from simple capillary collection tubes to sophisticated microfluidic devices capable of automated sample processing and storage. Innovations focus on improving sample quality, minimizing invasiveness, and enhancing ease of use. Products offer varying levels of automation and integration with diagnostic platforms. Unique selling propositions include improved accuracy, reduced cost, and enhanced convenience compared to traditional methods. Technological advancements include the development of novel materials, improved sample preservation techniques, and advanced biosensors.
Key Drivers, Barriers & Challenges in Self Sampling Blood Collection And Storage Devices
Key Drivers:
- Growing demand for convenient at-home diagnostics.
- Increasing prevalence of chronic diseases requiring frequent monitoring.
- Technological advancements improving accuracy and ease of use.
- Favorable regulatory policies promoting telehealth and remote patient monitoring.
Challenges:
- Concerns over sample integrity and accuracy.
- Regulatory hurdles and varying approval processes across regions.
- Potential for misuse and misinterpretation of results.
- Competition from established diagnostic methods. Supply chain disruptions impacting production and distribution. These disruptions led to an estimated xx million unit shortfall in 2024.
Emerging Opportunities in Self Sampling Blood Collection And Storage Devices
- Expansion into untapped markets in developing countries.
- Integration with digital health platforms and remote patient monitoring systems.
- Development of novel applications in areas such as personalized medicine and preventative care.
- Increasing focus on point-of-care diagnostics in remote settings.
Growth Accelerators in the Self Sampling Blood Collection And Storage Devices Industry
Technological breakthroughs in areas such as microfluidics, biosensors, and artificial intelligence are driving rapid innovation. Strategic partnerships between device manufacturers, diagnostic companies, and healthcare providers are facilitating market expansion. Government initiatives promoting telehealth and remote patient monitoring are creating favorable regulatory environments. The expansion into new applications, like at-home testing for infectious diseases, accelerates market growth.
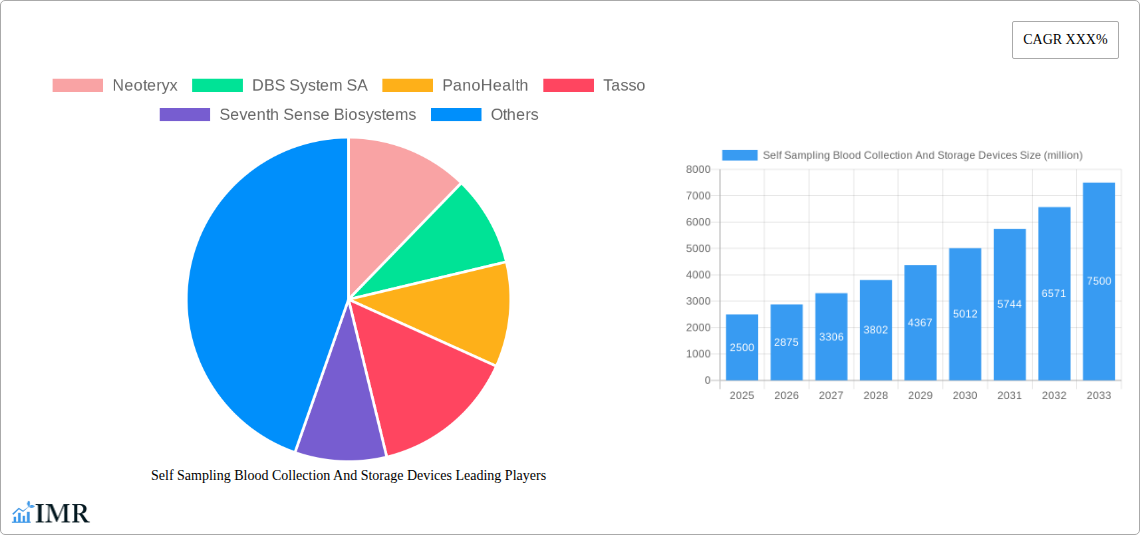
Key Players Shaping the Self Sampling Blood Collection And Storage Devices Market
- Neoteryx
- DBS System SA
- PanoHealth
- Tasso
- Seventh Sense Biosystems
- LAMEDITECH
- Capitainer
- Spot On Sciences
- Trajan Scientific and Medical
- Drawbridge Health
- Weavr Health
- Microdrop
Notable Milestones in Self Sampling Blood Collection And Storage Devices Sector
- 2020: FDA clearance for several self-sampling devices for at-home testing.
- 2021: Launch of several new products with improved accuracy and ease of use.
- 2022: Several strategic partnerships formed to expand market reach.
- 2023: Significant investment in R&D for advanced biosensors and microfluidic devices.
- 2024: First FDA approval of fully automated self-sampling device for at-home use.
In-Depth Self Sampling Blood Collection And Storage Devices Market Outlook
The self-sampling blood collection and storage devices market is poised for continued robust growth, driven by several factors. Technological advancements, coupled with increasing demand for convenient healthcare solutions, will fuel market expansion. Strategic partnerships and new product launches will further contribute to market growth. The focus on improving accuracy and reliability will expand market applications. The market is expected to reach xx million units by 2033, creating significant opportunities for industry players.
Self Sampling Blood Collection And Storage Devices Segmentation
-
1. Application
- 1.1. Disease Management
- 1.2. Health & Wellness
- 1.3. Drug Discovery & Development
- 1.4. Epidemiological Population Health Studies
- 1.5. Others
-
2. Type
- 2.1. Collection Devices
- 2.2. Storage Devices
Self Sampling Blood Collection And Storage Devices Segmentation By Geography
-
1. North America
- 1.1. United States
- 1.2. Canada
- 1.3. Mexico
-
2. South America
- 2.1. Brazil
- 2.2. Argentina
- 2.3. Rest of South America
-
3. Europe
- 3.1. United Kingdom
- 3.2. Germany
- 3.3. France
- 3.4. Italy
- 3.5. Spain
- 3.6. Russia
- 3.7. Benelux
- 3.8. Nordics
- 3.9. Rest of Europe
-
4. Middle East & Africa
- 4.1. Turkey
- 4.2. Israel
- 4.3. GCC
- 4.4. North Africa
- 4.5. South Africa
- 4.6. Rest of Middle East & Africa
-
5. Asia Pacific
- 5.1. China
- 5.2. India
- 5.3. Japan
- 5.4. South Korea
- 5.5. ASEAN
- 5.6. Oceania
- 5.7. Rest of Asia Pacific
Self Sampling Blood Collection And Storage Devices REPORT HIGHLIGHTS
| Aspects | Details |
|---|---|
| Study Period | 2019-2033 |
| Base Year | 2024 |
| Estimated Year | 2025 |
| Forecast Period | 2025-2033 |
| Historical Period | 2019-2024 |
| Growth Rate | CAGR of XXX% from 2019-2033 |
| Segmentation |
|
Table of Contents
- 1. Introduction
- 1.1. Research Scope
- 1.2. Market Segmentation
- 1.3. Research Methodology
- 1.4. Definitions and Assumptions
- 2. Executive Summary
- 2.1. Introduction
- 3. Market Dynamics
- 3.1. Introduction
- 3.2. Market Drivers
- 3.3. Market Restrains
- 3.4. Market Trends
- 4. Market Factor Analysis
- 4.1. Porters Five Forces
- 4.2. Supply/Value Chain
- 4.3. PESTEL analysis
- 4.4. Market Entropy
- 4.5. Patent/Trademark Analysis
- 5. Global Self Sampling Blood Collection And Storage Devices Analysis, Insights and Forecast, 2019-2031
- 5.1. Market Analysis, Insights and Forecast - by Application
- 5.1.1. Disease Management
- 5.1.2. Health & Wellness
- 5.1.3. Drug Discovery & Development
- 5.1.4. Epidemiological Population Health Studies
- 5.1.5. Others
- 5.2. Market Analysis, Insights and Forecast - by Type
- 5.2.1. Collection Devices
- 5.2.2. Storage Devices
- 5.3. Market Analysis, Insights and Forecast - by Region
- 5.3.1. North America
- 5.3.2. South America
- 5.3.3. Europe
- 5.3.4. Middle East & Africa
- 5.3.5. Asia Pacific
- 5.1. Market Analysis, Insights and Forecast - by Application
- 6. North America Self Sampling Blood Collection And Storage Devices Analysis, Insights and Forecast, 2019-2031
- 6.1. Market Analysis, Insights and Forecast - by Application
- 6.1.1. Disease Management
- 6.1.2. Health & Wellness
- 6.1.3. Drug Discovery & Development
- 6.1.4. Epidemiological Population Health Studies
- 6.1.5. Others
- 6.2. Market Analysis, Insights and Forecast - by Type
- 6.2.1. Collection Devices
- 6.2.2. Storage Devices
- 6.1. Market Analysis, Insights and Forecast - by Application
- 7. South America Self Sampling Blood Collection And Storage Devices Analysis, Insights and Forecast, 2019-2031
- 7.1. Market Analysis, Insights and Forecast - by Application
- 7.1.1. Disease Management
- 7.1.2. Health & Wellness
- 7.1.3. Drug Discovery & Development
- 7.1.4. Epidemiological Population Health Studies
- 7.1.5. Others
- 7.2. Market Analysis, Insights and Forecast - by Type
- 7.2.1. Collection Devices
- 7.2.2. Storage Devices
- 7.1. Market Analysis, Insights and Forecast - by Application
- 8. Europe Self Sampling Blood Collection And Storage Devices Analysis, Insights and Forecast, 2019-2031
- 8.1. Market Analysis, Insights and Forecast - by Application
- 8.1.1. Disease Management
- 8.1.2. Health & Wellness
- 8.1.3. Drug Discovery & Development
- 8.1.4. Epidemiological Population Health Studies
- 8.1.5. Others
- 8.2. Market Analysis, Insights and Forecast - by Type
- 8.2.1. Collection Devices
- 8.2.2. Storage Devices
- 8.1. Market Analysis, Insights and Forecast - by Application
- 9. Middle East & Africa Self Sampling Blood Collection And Storage Devices Analysis, Insights and Forecast, 2019-2031
- 9.1. Market Analysis, Insights and Forecast - by Application
- 9.1.1. Disease Management
- 9.1.2. Health & Wellness
- 9.1.3. Drug Discovery & Development
- 9.1.4. Epidemiological Population Health Studies
- 9.1.5. Others
- 9.2. Market Analysis, Insights and Forecast - by Type
- 9.2.1. Collection Devices
- 9.2.2. Storage Devices
- 9.1. Market Analysis, Insights and Forecast - by Application
- 10. Asia Pacific Self Sampling Blood Collection And Storage Devices Analysis, Insights and Forecast, 2019-2031
- 10.1. Market Analysis, Insights and Forecast - by Application
- 10.1.1. Disease Management
- 10.1.2. Health & Wellness
- 10.1.3. Drug Discovery & Development
- 10.1.4. Epidemiological Population Health Studies
- 10.1.5. Others
- 10.2. Market Analysis, Insights and Forecast - by Type
- 10.2.1. Collection Devices
- 10.2.2. Storage Devices
- 10.1. Market Analysis, Insights and Forecast - by Application
- 11. Competitive Analysis
- 11.1. Global Market Share Analysis 2024
- 11.2. Company Profiles
- 11.2.1 Neoteryx
- 11.2.1.1. Overview
- 11.2.1.2. Products
- 11.2.1.3. SWOT Analysis
- 11.2.1.4. Recent Developments
- 11.2.1.5. Financials (Based on Availability)
- 11.2.2 DBS System SA
- 11.2.2.1. Overview
- 11.2.2.2. Products
- 11.2.2.3. SWOT Analysis
- 11.2.2.4. Recent Developments
- 11.2.2.5. Financials (Based on Availability)
- 11.2.3 PanoHealth
- 11.2.3.1. Overview
- 11.2.3.2. Products
- 11.2.3.3. SWOT Analysis
- 11.2.3.4. Recent Developments
- 11.2.3.5. Financials (Based on Availability)
- 11.2.4 Tasso
- 11.2.4.1. Overview
- 11.2.4.2. Products
- 11.2.4.3. SWOT Analysis
- 11.2.4.4. Recent Developments
- 11.2.4.5. Financials (Based on Availability)
- 11.2.5 Seventh Sense Biosystems
- 11.2.5.1. Overview
- 11.2.5.2. Products
- 11.2.5.3. SWOT Analysis
- 11.2.5.4. Recent Developments
- 11.2.5.5. Financials (Based on Availability)
- 11.2.6 LAMEDITECH
- 11.2.6.1. Overview
- 11.2.6.2. Products
- 11.2.6.3. SWOT Analysis
- 11.2.6.4. Recent Developments
- 11.2.6.5. Financials (Based on Availability)
- 11.2.7 Capitainer
- 11.2.7.1. Overview
- 11.2.7.2. Products
- 11.2.7.3. SWOT Analysis
- 11.2.7.4. Recent Developments
- 11.2.7.5. Financials (Based on Availability)
- 11.2.8 Spot On Sciences
- 11.2.8.1. Overview
- 11.2.8.2. Products
- 11.2.8.3. SWOT Analysis
- 11.2.8.4. Recent Developments
- 11.2.8.5. Financials (Based on Availability)
- 11.2.9 Trajan Scientific and Medical
- 11.2.9.1. Overview
- 11.2.9.2. Products
- 11.2.9.3. SWOT Analysis
- 11.2.9.4. Recent Developments
- 11.2.9.5. Financials (Based on Availability)
- 11.2.10 Drawbridge Health
- 11.2.10.1. Overview
- 11.2.10.2. Products
- 11.2.10.3. SWOT Analysis
- 11.2.10.4. Recent Developments
- 11.2.10.5. Financials (Based on Availability)
- 11.2.11 Weavr Health
- 11.2.11.1. Overview
- 11.2.11.2. Products
- 11.2.11.3. SWOT Analysis
- 11.2.11.4. Recent Developments
- 11.2.11.5. Financials (Based on Availability)
- 11.2.12 Microdrop
- 11.2.12.1. Overview
- 11.2.12.2. Products
- 11.2.12.3. SWOT Analysis
- 11.2.12.4. Recent Developments
- 11.2.12.5. Financials (Based on Availability)
- 11.2.1 Neoteryx
List of Figures
- Figure 1: Global Self Sampling Blood Collection And Storage Devices Revenue Breakdown (million, %) by Region 2024 & 2032
- Figure 2: North America Self Sampling Blood Collection And Storage Devices Revenue (million), by Application 2024 & 2032
- Figure 3: North America Self Sampling Blood Collection And Storage Devices Revenue Share (%), by Application 2024 & 2032
- Figure 4: North America Self Sampling Blood Collection And Storage Devices Revenue (million), by Type 2024 & 2032
- Figure 5: North America Self Sampling Blood Collection And Storage Devices Revenue Share (%), by Type 2024 & 2032
- Figure 6: North America Self Sampling Blood Collection And Storage Devices Revenue (million), by Country 2024 & 2032
- Figure 7: North America Self Sampling Blood Collection And Storage Devices Revenue Share (%), by Country 2024 & 2032
- Figure 8: South America Self Sampling Blood Collection And Storage Devices Revenue (million), by Application 2024 & 2032
- Figure 9: South America Self Sampling Blood Collection And Storage Devices Revenue Share (%), by Application 2024 & 2032
- Figure 10: South America Self Sampling Blood Collection And Storage Devices Revenue (million), by Type 2024 & 2032
- Figure 11: South America Self Sampling Blood Collection And Storage Devices Revenue Share (%), by Type 2024 & 2032
- Figure 12: South America Self Sampling Blood Collection And Storage Devices Revenue (million), by Country 2024 & 2032
- Figure 13: South America Self Sampling Blood Collection And Storage Devices Revenue Share (%), by Country 2024 & 2032
- Figure 14: Europe Self Sampling Blood Collection And Storage Devices Revenue (million), by Application 2024 & 2032
- Figure 15: Europe Self Sampling Blood Collection And Storage Devices Revenue Share (%), by Application 2024 & 2032
- Figure 16: Europe Self Sampling Blood Collection And Storage Devices Revenue (million), by Type 2024 & 2032
- Figure 17: Europe Self Sampling Blood Collection And Storage Devices Revenue Share (%), by Type 2024 & 2032
- Figure 18: Europe Self Sampling Blood Collection And Storage Devices Revenue (million), by Country 2024 & 2032
- Figure 19: Europe Self Sampling Blood Collection And Storage Devices Revenue Share (%), by Country 2024 & 2032
- Figure 20: Middle East & Africa Self Sampling Blood Collection And Storage Devices Revenue (million), by Application 2024 & 2032
- Figure 21: Middle East & Africa Self Sampling Blood Collection And Storage Devices Revenue Share (%), by Application 2024 & 2032
- Figure 22: Middle East & Africa Self Sampling Blood Collection And Storage Devices Revenue (million), by Type 2024 & 2032
- Figure 23: Middle East & Africa Self Sampling Blood Collection And Storage Devices Revenue Share (%), by Type 2024 & 2032
- Figure 24: Middle East & Africa Self Sampling Blood Collection And Storage Devices Revenue (million), by Country 2024 & 2032
- Figure 25: Middle East & Africa Self Sampling Blood Collection And Storage Devices Revenue Share (%), by Country 2024 & 2032
- Figure 26: Asia Pacific Self Sampling Blood Collection And Storage Devices Revenue (million), by Application 2024 & 2032
- Figure 27: Asia Pacific Self Sampling Blood Collection And Storage Devices Revenue Share (%), by Application 2024 & 2032
- Figure 28: Asia Pacific Self Sampling Blood Collection And Storage Devices Revenue (million), by Type 2024 & 2032
- Figure 29: Asia Pacific Self Sampling Blood Collection And Storage Devices Revenue Share (%), by Type 2024 & 2032
- Figure 30: Asia Pacific Self Sampling Blood Collection And Storage Devices Revenue (million), by Country 2024 & 2032
- Figure 31: Asia Pacific Self Sampling Blood Collection And Storage Devices Revenue Share (%), by Country 2024 & 2032
List of Tables
- Table 1: Global Self Sampling Blood Collection And Storage Devices Revenue million Forecast, by Region 2019 & 2032
- Table 2: Global Self Sampling Blood Collection And Storage Devices Revenue million Forecast, by Application 2019 & 2032
- Table 3: Global Self Sampling Blood Collection And Storage Devices Revenue million Forecast, by Type 2019 & 2032
- Table 4: Global Self Sampling Blood Collection And Storage Devices Revenue million Forecast, by Region 2019 & 2032
- Table 5: Global Self Sampling Blood Collection And Storage Devices Revenue million Forecast, by Application 2019 & 2032
- Table 6: Global Self Sampling Blood Collection And Storage Devices Revenue million Forecast, by Type 2019 & 2032
- Table 7: Global Self Sampling Blood Collection And Storage Devices Revenue million Forecast, by Country 2019 & 2032
- Table 8: United States Self Sampling Blood Collection And Storage Devices Revenue (million) Forecast, by Application 2019 & 2032
- Table 9: Canada Self Sampling Blood Collection And Storage Devices Revenue (million) Forecast, by Application 2019 & 2032
- Table 10: Mexico Self Sampling Blood Collection And Storage Devices Revenue (million) Forecast, by Application 2019 & 2032
- Table 11: Global Self Sampling Blood Collection And Storage Devices Revenue million Forecast, by Application 2019 & 2032
- Table 12: Global Self Sampling Blood Collection And Storage Devices Revenue million Forecast, by Type 2019 & 2032
- Table 13: Global Self Sampling Blood Collection And Storage Devices Revenue million Forecast, by Country 2019 & 2032
- Table 14: Brazil Self Sampling Blood Collection And Storage Devices Revenue (million) Forecast, by Application 2019 & 2032
- Table 15: Argentina Self Sampling Blood Collection And Storage Devices Revenue (million) Forecast, by Application 2019 & 2032
- Table 16: Rest of South America Self Sampling Blood Collection And Storage Devices Revenue (million) Forecast, by Application 2019 & 2032
- Table 17: Global Self Sampling Blood Collection And Storage Devices Revenue million Forecast, by Application 2019 & 2032
- Table 18: Global Self Sampling Blood Collection And Storage Devices Revenue million Forecast, by Type 2019 & 2032
- Table 19: Global Self Sampling Blood Collection And Storage Devices Revenue million Forecast, by Country 2019 & 2032
- Table 20: United Kingdom Self Sampling Blood Collection And Storage Devices Revenue (million) Forecast, by Application 2019 & 2032
- Table 21: Germany Self Sampling Blood Collection And Storage Devices Revenue (million) Forecast, by Application 2019 & 2032
- Table 22: France Self Sampling Blood Collection And Storage Devices Revenue (million) Forecast, by Application 2019 & 2032
- Table 23: Italy Self Sampling Blood Collection And Storage Devices Revenue (million) Forecast, by Application 2019 & 2032
- Table 24: Spain Self Sampling Blood Collection And Storage Devices Revenue (million) Forecast, by Application 2019 & 2032
- Table 25: Russia Self Sampling Blood Collection And Storage Devices Revenue (million) Forecast, by Application 2019 & 2032
- Table 26: Benelux Self Sampling Blood Collection And Storage Devices Revenue (million) Forecast, by Application 2019 & 2032
- Table 27: Nordics Self Sampling Blood Collection And Storage Devices Revenue (million) Forecast, by Application 2019 & 2032
- Table 28: Rest of Europe Self Sampling Blood Collection And Storage Devices Revenue (million) Forecast, by Application 2019 & 2032
- Table 29: Global Self Sampling Blood Collection And Storage Devices Revenue million Forecast, by Application 2019 & 2032
- Table 30: Global Self Sampling Blood Collection And Storage Devices Revenue million Forecast, by Type 2019 & 2032
- Table 31: Global Self Sampling Blood Collection And Storage Devices Revenue million Forecast, by Country 2019 & 2032
- Table 32: Turkey Self Sampling Blood Collection And Storage Devices Revenue (million) Forecast, by Application 2019 & 2032
- Table 33: Israel Self Sampling Blood Collection And Storage Devices Revenue (million) Forecast, by Application 2019 & 2032
- Table 34: GCC Self Sampling Blood Collection And Storage Devices Revenue (million) Forecast, by Application 2019 & 2032
- Table 35: North Africa Self Sampling Blood Collection And Storage Devices Revenue (million) Forecast, by Application 2019 & 2032
- Table 36: South Africa Self Sampling Blood Collection And Storage Devices Revenue (million) Forecast, by Application 2019 & 2032
- Table 37: Rest of Middle East & Africa Self Sampling Blood Collection And Storage Devices Revenue (million) Forecast, by Application 2019 & 2032
- Table 38: Global Self Sampling Blood Collection And Storage Devices Revenue million Forecast, by Application 2019 & 2032
- Table 39: Global Self Sampling Blood Collection And Storage Devices Revenue million Forecast, by Type 2019 & 2032
- Table 40: Global Self Sampling Blood Collection And Storage Devices Revenue million Forecast, by Country 2019 & 2032
- Table 41: China Self Sampling Blood Collection And Storage Devices Revenue (million) Forecast, by Application 2019 & 2032
- Table 42: India Self Sampling Blood Collection And Storage Devices Revenue (million) Forecast, by Application 2019 & 2032
- Table 43: Japan Self Sampling Blood Collection And Storage Devices Revenue (million) Forecast, by Application 2019 & 2032
- Table 44: South Korea Self Sampling Blood Collection And Storage Devices Revenue (million) Forecast, by Application 2019 & 2032
- Table 45: ASEAN Self Sampling Blood Collection And Storage Devices Revenue (million) Forecast, by Application 2019 & 2032
- Table 46: Oceania Self Sampling Blood Collection And Storage Devices Revenue (million) Forecast, by Application 2019 & 2032
- Table 47: Rest of Asia Pacific Self Sampling Blood Collection And Storage Devices Revenue (million) Forecast, by Application 2019 & 2032
Frequently Asked Questions
1. What is the projected Compound Annual Growth Rate (CAGR) of the Self Sampling Blood Collection And Storage Devices?
The projected CAGR is approximately XXX%.
2. Which companies are prominent players in the Self Sampling Blood Collection And Storage Devices?
Key companies in the market include Neoteryx, DBS System SA, PanoHealth, Tasso, Seventh Sense Biosystems, LAMEDITECH, Capitainer, Spot On Sciences, Trajan Scientific and Medical, Drawbridge Health, Weavr Health, Microdrop.
3. What are the main segments of the Self Sampling Blood Collection And Storage Devices?
The market segments include Application, Type.
4. Can you provide details about the market size?
The market size is estimated to be USD XXX million as of 2022.
5. What are some drivers contributing to market growth?
N/A
6. What are the notable trends driving market growth?
N/A
7. Are there any restraints impacting market growth?
N/A
8. Can you provide examples of recent developments in the market?
N/A
9. What pricing options are available for accessing the report?
Pricing options include single-user, multi-user, and enterprise licenses priced at USD 2900.00, USD 4350.00, and USD 5800.00 respectively.
10. Is the market size provided in terms of value or volume?
The market size is provided in terms of value, measured in million.
11. Are there any specific market keywords associated with the report?
Yes, the market keyword associated with the report is "Self Sampling Blood Collection And Storage Devices," which aids in identifying and referencing the specific market segment covered.
12. How do I determine which pricing option suits my needs best?
The pricing options vary based on user requirements and access needs. Individual users may opt for single-user licenses, while businesses requiring broader access may choose multi-user or enterprise licenses for cost-effective access to the report.
13. Are there any additional resources or data provided in the Self Sampling Blood Collection And Storage Devices report?
While the report offers comprehensive insights, it's advisable to review the specific contents or supplementary materials provided to ascertain if additional resources or data are available.
14. How can I stay updated on further developments or reports in the Self Sampling Blood Collection And Storage Devices?
To stay informed about further developments, trends, and reports in the Self Sampling Blood Collection And Storage Devices, consider subscribing to industry newsletters, following relevant companies and organizations, or regularly checking reputable industry news sources and publications.
Methodology
Step 1 - Identification of Relevant Samples Size from Population Database


Step 2 - Approaches for Defining Global Market Size (Value, Volume* & Price*)

Note*: In applicable scenarios
Step 3 - Data Sources
Primary Research
- Web Analytics
- Survey Reports
- Research Institute
- Latest Research Reports
- Opinion Leaders
Secondary Research
- Annual Reports
- White Paper
- Latest Press Release
- Industry Association
- Paid Database
- Investor Presentations

Step 4 - Data Triangulation
Involves using different sources of information in order to increase the validity of a study
These sources are likely to be stakeholders in a program - participants, other researchers, program staff, other community members, and so on.
Then we put all data in single framework & apply various statistical tools to find out the dynamic on the market.
During the analysis stage, feedback from the stakeholder groups would be compared to determine areas of agreement as well as areas of divergence
