

Key Insights
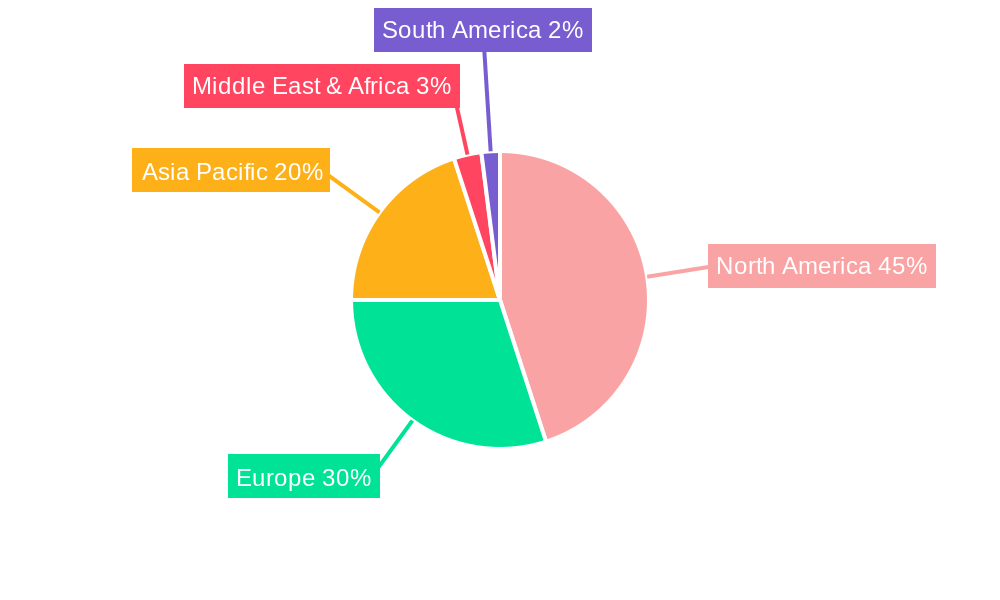
The spatial genomics and transcriptomics market is experiencing robust growth, driven by the increasing need to understand the spatial organization of cells and molecules within tissues and organs. This technology offers unprecedented insights into complex biological processes, accelerating drug discovery, diagnostics, and personalized medicine. The market's expansion is fueled by advancements in imaging techniques, data analysis capabilities, and the development of more user-friendly instruments and software. Key applications include cancer research, neuroscience, immunology, and infectious disease studies, where understanding spatial context is crucial for effective treatment and diagnosis. The market is segmented by technology (spatial transcriptomics and spatial genomics), product (instruments, software, consumables), and end-user (pharmaceutical manufacturers, diagnostic customers, and others). While North America currently holds a significant market share due to strong research infrastructure and early adoption, the Asia-Pacific region is projected to witness the fastest growth in the coming years, fueled by increasing investments in healthcare and technological advancements.
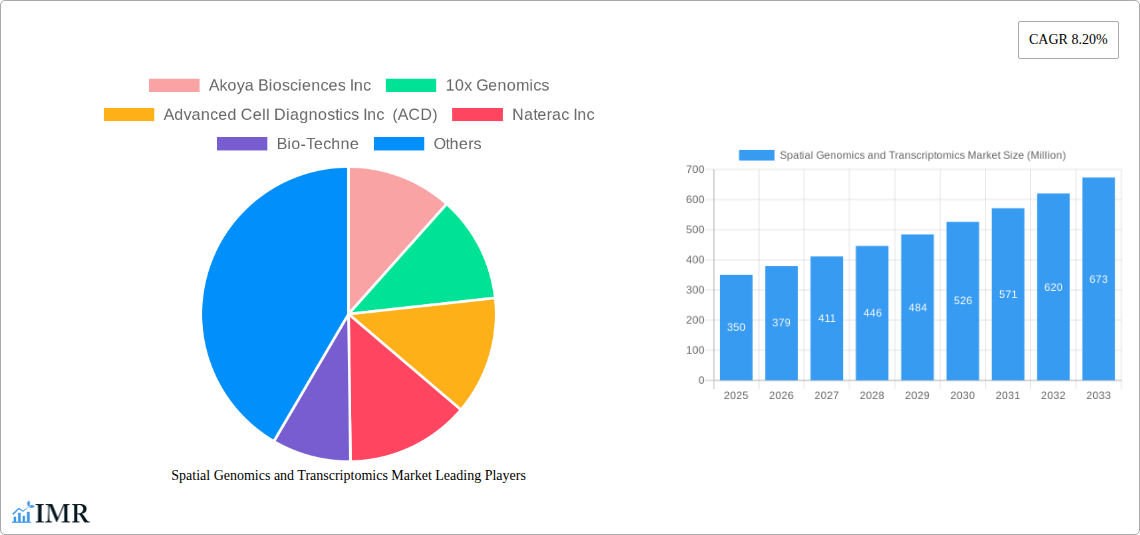
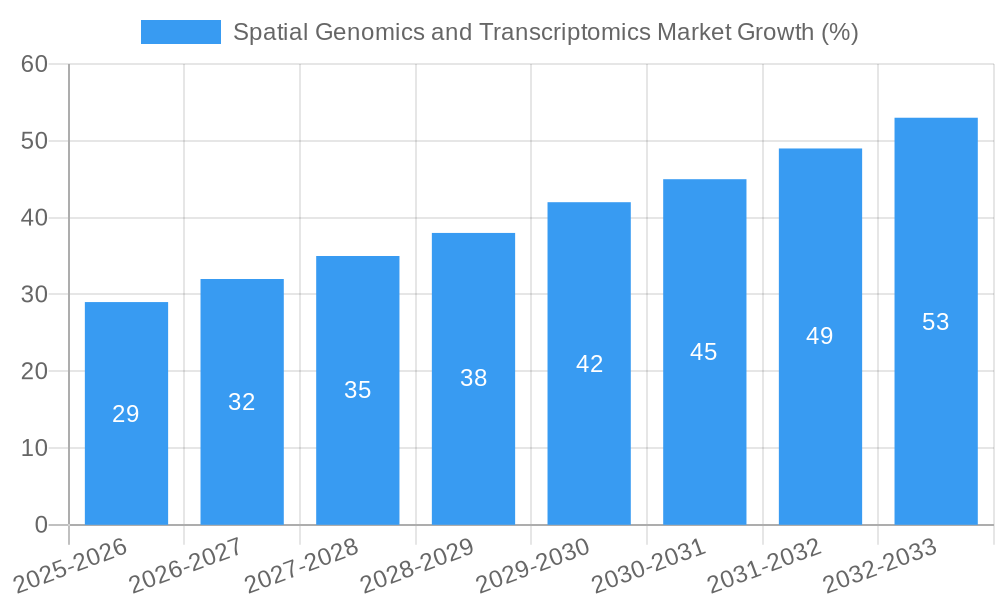
The competitive landscape is dynamic, with both established players like Illumina and 10x Genomics, and emerging companies vying for market share. The market's growth trajectory will be influenced by several factors, including the cost of instruments and consumables, the complexity of data analysis, and the regulatory approval processes for new diagnostic tools. However, continuous technological advancements, expanding research initiatives, and increasing collaborations between academia and industry are anticipated to further propel market growth. The ongoing development of more affordable and accessible spatial genomics and transcriptomics technologies will broaden the market's reach, creating new opportunities for innovation and commercialization in the coming decade. A conservative estimate suggests that the market, currently valued in the hundreds of millions, is poised for substantial expansion, driven by a compounded annual growth rate (CAGR) of 8.2% from 2025 to 2033.
Spatial Genomics and Transcriptomics Market: A Comprehensive Report (2019-2033)
This in-depth report provides a comprehensive analysis of the Spatial Genomics and Transcriptomics market, encompassing market dynamics, growth trends, regional segmentation, product landscape, key players, and future outlook. The report covers the period from 2019 to 2033, with a focus on the forecast period of 2025-2033 and a base year of 2025. The market is segmented by technology (Spatial Transcriptomics, Spatial Genomics), product (Instruments, Software, Consumables), and end-user (Pharmaceutical Manufacturers, Diagnostic Customers, Others). The total market size is projected to reach xx Million by 2033.
Spatial Genomics and Transcriptomics Market Market Dynamics & Structure
The Spatial Genomics and Transcriptomics market is characterized by a moderately concentrated landscape with key players like 10x Genomics, Illumina Inc., and NanoString Technologies Inc. holding significant market share. Technological innovation, particularly in next-generation sequencing (NGS) and advanced imaging techniques, is a primary growth driver. Stringent regulatory frameworks, especially concerning clinical applications, present both opportunities and challenges. The market faces competition from traditional genomics methods, but the unique spatial context offered by these technologies provides a significant competitive advantage. M&A activity remains moderate but is expected to increase as larger players seek to consolidate market share and expand their technological capabilities.
- Market Concentration: Moderately concentrated, with top 5 players holding approximately 60% market share in 2025.
- Technological Innovation: Rapid advancements in NGS, imaging, and bioinformatics are key drivers.
- Regulatory Landscape: Stringent regulations, particularly for diagnostic applications, influence market growth.
- Competitive Substitutes: Traditional genomics techniques offer competition, but spatial resolution is a key differentiator.
- End-User Demographics: Pharmaceutical manufacturers and diagnostic customers are primary drivers of demand.
- M&A Activity: Moderate currently, but potential for increased activity driven by consolidation efforts.
Spatial Genomics and Transcriptomics Market Growth Trends & Insights
The Spatial Genomics and Transcriptomics market has experienced significant growth in recent years, driven by increasing demand for high-resolution spatial information in biological research and clinical diagnostics. The market size, valued at xx Million in 2025, is projected to witness a Compound Annual Growth Rate (CAGR) of xx% during the forecast period (2025-2033), reaching xx Million by 2033. This growth is fueled by technological advancements, expanding applications in drug discovery and diagnostics, and increasing investments in research and development. The adoption rate is also increasing, particularly in academic research institutions and pharmaceutical companies. Technological disruptions, such as the development of more affordable and user-friendly platforms, are further boosting market penetration. A shift in consumer behavior toward personalized medicine is also driving the demand for spatial genomics and transcriptomics solutions.
Dominant Regions, Countries, or Segments in Spatial Genomics and Transcriptomics Market
North America currently dominates the Spatial Genomics and Transcriptomics market, owing to substantial investment in research and development, the presence of major market players, and the well-established healthcare infrastructure. Within this region, the United States holds a particularly strong position. The pharmaceutical manufacturing segment is the largest end-user, driven by the application of spatial omics in drug discovery and development. The spatial transcriptomics technology segment is also experiencing rapid growth due to its ability to provide high-resolution gene expression data.
- North America Dominance: Driven by strong R&D investment, established players, and advanced healthcare infrastructure.
- Pharmaceutical Manufacturing: Largest end-user segment, fueled by drug discovery and development applications.
- Spatial Transcriptomics Growth: Rapid growth due to high-resolution gene expression data capabilities.
- European Market Expansion: Growing adoption in European countries, driven by research funding and collaborations.
- Asia-Pacific Potential: High growth potential, driven by increasing healthcare expenditure and rising research activities.
Spatial Genomics and Transcriptomics Market Product Landscape
The market offers a diverse range of products, including instruments, software, and consumables. Instruments comprise sophisticated imaging and sequencing systems, while software provides advanced data analysis capabilities. Consumables include reagents and kits necessary for sample preparation and analysis. Key product innovations focus on increasing throughput, improving resolution, and simplifying workflow processes. Technological advancements like multiplexed imaging and improved computational tools enhance the efficiency and accuracy of spatial profiling. Unique selling propositions often center on ease of use, data quality, and the ability to integrate multiple omics datasets.
Key Drivers, Barriers & Challenges in Spatial Genomics and Transcriptomics Market
Key Drivers:
- Technological advancements in NGS, imaging, and data analysis are driving growth.
- Increasing demand for personalized medicine and precision oncology fuels market expansion.
- Rising research funding in life sciences is supporting the development of new applications.
Challenges & Restraints:
- High costs associated with instruments and consumables can limit adoption.
- Data analysis complexity requires specialized expertise, which may pose a barrier to entry.
- Stringent regulatory requirements for clinical applications can create delays in market entry. The complexity of data analysis and the need for specialized bioinformatic skills can also hinder broader adoption.
Emerging Opportunities in Spatial Genomics and Transcriptomics Market
- Untapped markets in developing countries offer significant growth potential.
- New applications in areas like immunology, neuroscience, and infectious diseases are emerging.
- Integration with other omics technologies, such as proteomics and metabolomics, provides further opportunities.
Growth Accelerators in the Spatial Genomics and Transcriptomics Market Industry
Technological breakthroughs in higher-throughput sequencing and improved image analysis are pivotal drivers. Strategic partnerships between instrument manufacturers, software developers, and research institutions are accelerating innovation and market penetration. Expanding into new applications, such as in infectious disease research and personalized cancer therapies, offers immense growth opportunities.
Key Players Shaping the Spatial Genomics and Transcriptomics Market Market
- Akoya Biosciences Inc
- 10x Genomics
- Advanced Cell Diagnostics Inc (ACD)
- Naterac Inc
- Bio-Techne
- Illumina Inc
- Fluidigm
- S2 Genomics Inc
- Seven Bridges Genomics
- Dovetail Genomics
- NanoString Technologies Inc
- Horizon Discovery Group plc
Notable Milestones in Spatial Genomics and Transcriptomics Market Sector
- May 2022: NanoString announced a seamless, cloud-based workflow improving spatial data analysis for customers using Illumina NextSeq systems and the GeoMx Digital Spatial Profiler.
- January 2022: Illumina Inc. and Nashville Biosciences LLC partnered to establish a clinical genomic resource and accelerate new medicine development using Illumina's NGS platforms.
In-Depth Spatial Genomics and Transcriptomics Market Market Outlook
The Spatial Genomics and Transcriptomics market is poised for sustained growth, driven by continuous technological advancements, expanding applications in diverse fields, and increased research funding. Strategic collaborations and mergers & acquisitions are expected to further accelerate market consolidation and innovation. The development of more affordable and user-friendly platforms will broaden market penetration, particularly in emerging economies. The long-term outlook for the market is highly promising, offering significant opportunities for players who can effectively leverage technological innovation and adapt to evolving market needs.
Spatial Genomics and Transcriptomics Market Segmentation
-
1. Technology
- 1.1. Spatial Transcriptomics
- 1.2. Spatial Genomics
-
2. Product
- 2.1. Instruments
- 2.2. Software
- 2.3. Consumables
-
3. End-User
- 3.1. Pharmaceutical Manufacturer
- 3.2. Diagnostic Customers
- 3.3. Others
Spatial Genomics and Transcriptomics Market Segmentation By Geography
-
1. North America
- 1.1. United States
- 1.2. Canada
- 1.3. Mexico
-
2. Europe
- 2.1. Germany
- 2.2. United Kingdom
- 2.3. France
- 2.4. Italy
- 2.5. Spain
- 2.6. Rest of Europe
-
3. Asia Pacific
- 3.1. China
- 3.2. Japan
- 3.3. India
- 3.4. Australia
- 3.5. South Korea
- 3.6. Rest of Asia Pacific
-
4. Middle East and Africa
- 4.1. GCC
- 4.2. South Africa
- 4.3. Rest of Middle East and Africa
-
5. South America
- 5.1. Brazil
- 5.2. Argentina
- 5.3. Rest of South America
Spatial Genomics and Transcriptomics Market REPORT HIGHLIGHTS
| Aspects | Details |
|---|---|
| Study Period | 2019-2033 |
| Base Year | 2024 |
| Estimated Year | 2025 |
| Forecast Period | 2025-2033 |
| Historical Period | 2019-2024 |
| Growth Rate | CAGR of 8.20% from 2019-2033 |
| Segmentation |
|
Table of Contents
- 1. Introduction
- 1.1. Research Scope
- 1.2. Market Segmentation
- 1.3. Research Methodology
- 1.4. Definitions and Assumptions
- 2. Executive Summary
- 2.1. Introduction
- 3. Market Dynamics
- 3.1. Introduction
- 3.2. Market Drivers
- 3.2.1. Emerging Potential of Spatial Genomic Analysis as Cancer Diagnostic Tool; Increasing Advanced Technologies of Spatial Genomics and Transcriptomics; Advent of Fourth Generation of Sequencing
- 3.3. Market Restrains
- 3.3.1. Slow Implementation of Technology; Well-Established Workflows for Conventional Genomics and Transcriptomics Analysis
- 3.4. Market Trends
- 3.4.1. Consumables Segment is Expected to Witness Healthy Growth During the Forecast Period
- 4. Market Factor Analysis
- 4.1. Porters Five Forces
- 4.2. Supply/Value Chain
- 4.3. PESTEL analysis
- 4.4. Market Entropy
- 4.5. Patent/Trademark Analysis
- 5. Global Spatial Genomics and Transcriptomics Market Analysis, Insights and Forecast, 2019-2031
- 5.1. Market Analysis, Insights and Forecast - by Technology
- 5.1.1. Spatial Transcriptomics
- 5.1.2. Spatial Genomics
- 5.2. Market Analysis, Insights and Forecast - by Product
- 5.2.1. Instruments
- 5.2.2. Software
- 5.2.3. Consumables
- 5.3. Market Analysis, Insights and Forecast - by End-User
- 5.3.1. Pharmaceutical Manufacturer
- 5.3.2. Diagnostic Customers
- 5.3.3. Others
- 5.4. Market Analysis, Insights and Forecast - by Region
- 5.4.1. North America
- 5.4.2. Europe
- 5.4.3. Asia Pacific
- 5.4.4. Middle East and Africa
- 5.4.5. South America
- 5.1. Market Analysis, Insights and Forecast - by Technology
- 6. North America Spatial Genomics and Transcriptomics Market Analysis, Insights and Forecast, 2019-2031
- 6.1. Market Analysis, Insights and Forecast - by Technology
- 6.1.1. Spatial Transcriptomics
- 6.1.2. Spatial Genomics
- 6.2. Market Analysis, Insights and Forecast - by Product
- 6.2.1. Instruments
- 6.2.2. Software
- 6.2.3. Consumables
- 6.3. Market Analysis, Insights and Forecast - by End-User
- 6.3.1. Pharmaceutical Manufacturer
- 6.3.2. Diagnostic Customers
- 6.3.3. Others
- 6.1. Market Analysis, Insights and Forecast - by Technology
- 7. Europe Spatial Genomics and Transcriptomics Market Analysis, Insights and Forecast, 2019-2031
- 7.1. Market Analysis, Insights and Forecast - by Technology
- 7.1.1. Spatial Transcriptomics
- 7.1.2. Spatial Genomics
- 7.2. Market Analysis, Insights and Forecast - by Product
- 7.2.1. Instruments
- 7.2.2. Software
- 7.2.3. Consumables
- 7.3. Market Analysis, Insights and Forecast - by End-User
- 7.3.1. Pharmaceutical Manufacturer
- 7.3.2. Diagnostic Customers
- 7.3.3. Others
- 7.1. Market Analysis, Insights and Forecast - by Technology
- 8. Asia Pacific Spatial Genomics and Transcriptomics Market Analysis, Insights and Forecast, 2019-2031
- 8.1. Market Analysis, Insights and Forecast - by Technology
- 8.1.1. Spatial Transcriptomics
- 8.1.2. Spatial Genomics
- 8.2. Market Analysis, Insights and Forecast - by Product
- 8.2.1. Instruments
- 8.2.2. Software
- 8.2.3. Consumables
- 8.3. Market Analysis, Insights and Forecast - by End-User
- 8.3.1. Pharmaceutical Manufacturer
- 8.3.2. Diagnostic Customers
- 8.3.3. Others
- 8.1. Market Analysis, Insights and Forecast - by Technology
- 9. Middle East and Africa Spatial Genomics and Transcriptomics Market Analysis, Insights and Forecast, 2019-2031
- 9.1. Market Analysis, Insights and Forecast - by Technology
- 9.1.1. Spatial Transcriptomics
- 9.1.2. Spatial Genomics
- 9.2. Market Analysis, Insights and Forecast - by Product
- 9.2.1. Instruments
- 9.2.2. Software
- 9.2.3. Consumables
- 9.3. Market Analysis, Insights and Forecast - by End-User
- 9.3.1. Pharmaceutical Manufacturer
- 9.3.2. Diagnostic Customers
- 9.3.3. Others
- 9.1. Market Analysis, Insights and Forecast - by Technology
- 10. South America Spatial Genomics and Transcriptomics Market Analysis, Insights and Forecast, 2019-2031
- 10.1. Market Analysis, Insights and Forecast - by Technology
- 10.1.1. Spatial Transcriptomics
- 10.1.2. Spatial Genomics
- 10.2. Market Analysis, Insights and Forecast - by Product
- 10.2.1. Instruments
- 10.2.2. Software
- 10.2.3. Consumables
- 10.3. Market Analysis, Insights and Forecast - by End-User
- 10.3.1. Pharmaceutical Manufacturer
- 10.3.2. Diagnostic Customers
- 10.3.3. Others
- 10.1. Market Analysis, Insights and Forecast - by Technology
- 11. North America Spatial Genomics and Transcriptomics Market Analysis, Insights and Forecast, 2019-2031
- 11.1. Market Analysis, Insights and Forecast - By Country/Sub-region
- 11.1.1 United States
- 11.1.2 Canada
- 11.1.3 Mexico
- 12. Europe Spatial Genomics and Transcriptomics Market Analysis, Insights and Forecast, 2019-2031
- 12.1. Market Analysis, Insights and Forecast - By Country/Sub-region
- 12.1.1 Germany
- 12.1.2 United Kingdom
- 12.1.3 France
- 12.1.4 Italy
- 12.1.5 Spain
- 12.1.6 Rest of Europe
- 13. Asia Pacific Spatial Genomics and Transcriptomics Market Analysis, Insights and Forecast, 2019-2031
- 13.1. Market Analysis, Insights and Forecast - By Country/Sub-region
- 13.1.1 China
- 13.1.2 Japan
- 13.1.3 India
- 13.1.4 Australia
- 13.1.5 South Korea
- 13.1.6 Rest of Asia Pacific
- 14. Middle East and Africa Spatial Genomics and Transcriptomics Market Analysis, Insights and Forecast, 2019-2031
- 14.1. Market Analysis, Insights and Forecast - By Country/Sub-region
- 14.1.1 GCC
- 14.1.2 South Africa
- 14.1.3 Rest of Middle East and Africa
- 15. South America Spatial Genomics and Transcriptomics Market Analysis, Insights and Forecast, 2019-2031
- 15.1. Market Analysis, Insights and Forecast - By Country/Sub-region
- 15.1.1 Brazil
- 15.1.2 Argentina
- 15.1.3 Rest of South America
- 16. Competitive Analysis
- 16.1. Global Market Share Analysis 2024
- 16.2. Company Profiles
- 16.2.1 Akoya Biosciences Inc
- 16.2.1.1. Overview
- 16.2.1.2. Products
- 16.2.1.3. SWOT Analysis
- 16.2.1.4. Recent Developments
- 16.2.1.5. Financials (Based on Availability)
- 16.2.2 10x Genomics
- 16.2.2.1. Overview
- 16.2.2.2. Products
- 16.2.2.3. SWOT Analysis
- 16.2.2.4. Recent Developments
- 16.2.2.5. Financials (Based on Availability)
- 16.2.3 Advanced Cell Diagnostics Inc (ACD)
- 16.2.3.1. Overview
- 16.2.3.2. Products
- 16.2.3.3. SWOT Analysis
- 16.2.3.4. Recent Developments
- 16.2.3.5. Financials (Based on Availability)
- 16.2.4 Naterac Inc
- 16.2.4.1. Overview
- 16.2.4.2. Products
- 16.2.4.3. SWOT Analysis
- 16.2.4.4. Recent Developments
- 16.2.4.5. Financials (Based on Availability)
- 16.2.5 Bio-Techne
- 16.2.5.1. Overview
- 16.2.5.2. Products
- 16.2.5.3. SWOT Analysis
- 16.2.5.4. Recent Developments
- 16.2.5.5. Financials (Based on Availability)
- 16.2.6 Illumina Inc
- 16.2.6.1. Overview
- 16.2.6.2. Products
- 16.2.6.3. SWOT Analysis
- 16.2.6.4. Recent Developments
- 16.2.6.5. Financials (Based on Availability)
- 16.2.7 Fluidigm
- 16.2.7.1. Overview
- 16.2.7.2. Products
- 16.2.7.3. SWOT Analysis
- 16.2.7.4. Recent Developments
- 16.2.7.5. Financials (Based on Availability)
- 16.2.8 S2 Genomics Inc
- 16.2.8.1. Overview
- 16.2.8.2. Products
- 16.2.8.3. SWOT Analysis
- 16.2.8.4. Recent Developments
- 16.2.8.5. Financials (Based on Availability)
- 16.2.9 Seven Bridges Genomics*List Not Exhaustive
- 16.2.9.1. Overview
- 16.2.9.2. Products
- 16.2.9.3. SWOT Analysis
- 16.2.9.4. Recent Developments
- 16.2.9.5. Financials (Based on Availability)
- 16.2.10 Dovetail Genomics
- 16.2.10.1. Overview
- 16.2.10.2. Products
- 16.2.10.3. SWOT Analysis
- 16.2.10.4. Recent Developments
- 16.2.10.5. Financials (Based on Availability)
- 16.2.11 NanoString Technologies Inc
- 16.2.11.1. Overview
- 16.2.11.2. Products
- 16.2.11.3. SWOT Analysis
- 16.2.11.4. Recent Developments
- 16.2.11.5. Financials (Based on Availability)
- 16.2.12 Horizon Discovery Group plc
- 16.2.12.1. Overview
- 16.2.12.2. Products
- 16.2.12.3. SWOT Analysis
- 16.2.12.4. Recent Developments
- 16.2.12.5. Financials (Based on Availability)
- 16.2.1 Akoya Biosciences Inc
List of Figures
- Figure 1: Global Spatial Genomics and Transcriptomics Market Revenue Breakdown (Million, %) by Region 2024 & 2032
- Figure 2: North America Spatial Genomics and Transcriptomics Market Revenue (Million), by Country 2024 & 2032
- Figure 3: North America Spatial Genomics and Transcriptomics Market Revenue Share (%), by Country 2024 & 2032
- Figure 4: Europe Spatial Genomics and Transcriptomics Market Revenue (Million), by Country 2024 & 2032
- Figure 5: Europe Spatial Genomics and Transcriptomics Market Revenue Share (%), by Country 2024 & 2032
- Figure 6: Asia Pacific Spatial Genomics and Transcriptomics Market Revenue (Million), by Country 2024 & 2032
- Figure 7: Asia Pacific Spatial Genomics and Transcriptomics Market Revenue Share (%), by Country 2024 & 2032
- Figure 8: Middle East and Africa Spatial Genomics and Transcriptomics Market Revenue (Million), by Country 2024 & 2032
- Figure 9: Middle East and Africa Spatial Genomics and Transcriptomics Market Revenue Share (%), by Country 2024 & 2032
- Figure 10: South America Spatial Genomics and Transcriptomics Market Revenue (Million), by Country 2024 & 2032
- Figure 11: South America Spatial Genomics and Transcriptomics Market Revenue Share (%), by Country 2024 & 2032
- Figure 12: North America Spatial Genomics and Transcriptomics Market Revenue (Million), by Technology 2024 & 2032
- Figure 13: North America Spatial Genomics and Transcriptomics Market Revenue Share (%), by Technology 2024 & 2032
- Figure 14: North America Spatial Genomics and Transcriptomics Market Revenue (Million), by Product 2024 & 2032
- Figure 15: North America Spatial Genomics and Transcriptomics Market Revenue Share (%), by Product 2024 & 2032
- Figure 16: North America Spatial Genomics and Transcriptomics Market Revenue (Million), by End-User 2024 & 2032
- Figure 17: North America Spatial Genomics and Transcriptomics Market Revenue Share (%), by End-User 2024 & 2032
- Figure 18: North America Spatial Genomics and Transcriptomics Market Revenue (Million), by Country 2024 & 2032
- Figure 19: North America Spatial Genomics and Transcriptomics Market Revenue Share (%), by Country 2024 & 2032
- Figure 20: Europe Spatial Genomics and Transcriptomics Market Revenue (Million), by Technology 2024 & 2032
- Figure 21: Europe Spatial Genomics and Transcriptomics Market Revenue Share (%), by Technology 2024 & 2032
- Figure 22: Europe Spatial Genomics and Transcriptomics Market Revenue (Million), by Product 2024 & 2032
- Figure 23: Europe Spatial Genomics and Transcriptomics Market Revenue Share (%), by Product 2024 & 2032
- Figure 24: Europe Spatial Genomics and Transcriptomics Market Revenue (Million), by End-User 2024 & 2032
- Figure 25: Europe Spatial Genomics and Transcriptomics Market Revenue Share (%), by End-User 2024 & 2032
- Figure 26: Europe Spatial Genomics and Transcriptomics Market Revenue (Million), by Country 2024 & 2032
- Figure 27: Europe Spatial Genomics and Transcriptomics Market Revenue Share (%), by Country 2024 & 2032
- Figure 28: Asia Pacific Spatial Genomics and Transcriptomics Market Revenue (Million), by Technology 2024 & 2032
- Figure 29: Asia Pacific Spatial Genomics and Transcriptomics Market Revenue Share (%), by Technology 2024 & 2032
- Figure 30: Asia Pacific Spatial Genomics and Transcriptomics Market Revenue (Million), by Product 2024 & 2032
- Figure 31: Asia Pacific Spatial Genomics and Transcriptomics Market Revenue Share (%), by Product 2024 & 2032
- Figure 32: Asia Pacific Spatial Genomics and Transcriptomics Market Revenue (Million), by End-User 2024 & 2032
- Figure 33: Asia Pacific Spatial Genomics and Transcriptomics Market Revenue Share (%), by End-User 2024 & 2032
- Figure 34: Asia Pacific Spatial Genomics and Transcriptomics Market Revenue (Million), by Country 2024 & 2032
- Figure 35: Asia Pacific Spatial Genomics and Transcriptomics Market Revenue Share (%), by Country 2024 & 2032
- Figure 36: Middle East and Africa Spatial Genomics and Transcriptomics Market Revenue (Million), by Technology 2024 & 2032
- Figure 37: Middle East and Africa Spatial Genomics and Transcriptomics Market Revenue Share (%), by Technology 2024 & 2032
- Figure 38: Middle East and Africa Spatial Genomics and Transcriptomics Market Revenue (Million), by Product 2024 & 2032
- Figure 39: Middle East and Africa Spatial Genomics and Transcriptomics Market Revenue Share (%), by Product 2024 & 2032
- Figure 40: Middle East and Africa Spatial Genomics and Transcriptomics Market Revenue (Million), by End-User 2024 & 2032
- Figure 41: Middle East and Africa Spatial Genomics and Transcriptomics Market Revenue Share (%), by End-User 2024 & 2032
- Figure 42: Middle East and Africa Spatial Genomics and Transcriptomics Market Revenue (Million), by Country 2024 & 2032
- Figure 43: Middle East and Africa Spatial Genomics and Transcriptomics Market Revenue Share (%), by Country 2024 & 2032
- Figure 44: South America Spatial Genomics and Transcriptomics Market Revenue (Million), by Technology 2024 & 2032
- Figure 45: South America Spatial Genomics and Transcriptomics Market Revenue Share (%), by Technology 2024 & 2032
- Figure 46: South America Spatial Genomics and Transcriptomics Market Revenue (Million), by Product 2024 & 2032
- Figure 47: South America Spatial Genomics and Transcriptomics Market Revenue Share (%), by Product 2024 & 2032
- Figure 48: South America Spatial Genomics and Transcriptomics Market Revenue (Million), by End-User 2024 & 2032
- Figure 49: South America Spatial Genomics and Transcriptomics Market Revenue Share (%), by End-User 2024 & 2032
- Figure 50: South America Spatial Genomics and Transcriptomics Market Revenue (Million), by Country 2024 & 2032
- Figure 51: South America Spatial Genomics and Transcriptomics Market Revenue Share (%), by Country 2024 & 2032
List of Tables
- Table 1: Global Spatial Genomics and Transcriptomics Market Revenue Million Forecast, by Region 2019 & 2032
- Table 2: Global Spatial Genomics and Transcriptomics Market Revenue Million Forecast, by Technology 2019 & 2032
- Table 3: Global Spatial Genomics and Transcriptomics Market Revenue Million Forecast, by Product 2019 & 2032
- Table 4: Global Spatial Genomics and Transcriptomics Market Revenue Million Forecast, by End-User 2019 & 2032
- Table 5: Global Spatial Genomics and Transcriptomics Market Revenue Million Forecast, by Region 2019 & 2032
- Table 6: Global Spatial Genomics and Transcriptomics Market Revenue Million Forecast, by Country 2019 & 2032
- Table 7: United States Spatial Genomics and Transcriptomics Market Revenue (Million) Forecast, by Application 2019 & 2032
- Table 8: Canada Spatial Genomics and Transcriptomics Market Revenue (Million) Forecast, by Application 2019 & 2032
- Table 9: Mexico Spatial Genomics and Transcriptomics Market Revenue (Million) Forecast, by Application 2019 & 2032
- Table 10: Global Spatial Genomics and Transcriptomics Market Revenue Million Forecast, by Country 2019 & 2032
- Table 11: Germany Spatial Genomics and Transcriptomics Market Revenue (Million) Forecast, by Application 2019 & 2032
- Table 12: United Kingdom Spatial Genomics and Transcriptomics Market Revenue (Million) Forecast, by Application 2019 & 2032
- Table 13: France Spatial Genomics and Transcriptomics Market Revenue (Million) Forecast, by Application 2019 & 2032
- Table 14: Italy Spatial Genomics and Transcriptomics Market Revenue (Million) Forecast, by Application 2019 & 2032
- Table 15: Spain Spatial Genomics and Transcriptomics Market Revenue (Million) Forecast, by Application 2019 & 2032
- Table 16: Rest of Europe Spatial Genomics and Transcriptomics Market Revenue (Million) Forecast, by Application 2019 & 2032
- Table 17: Global Spatial Genomics and Transcriptomics Market Revenue Million Forecast, by Country 2019 & 2032
- Table 18: China Spatial Genomics and Transcriptomics Market Revenue (Million) Forecast, by Application 2019 & 2032
- Table 19: Japan Spatial Genomics and Transcriptomics Market Revenue (Million) Forecast, by Application 2019 & 2032
- Table 20: India Spatial Genomics and Transcriptomics Market Revenue (Million) Forecast, by Application 2019 & 2032
- Table 21: Australia Spatial Genomics and Transcriptomics Market Revenue (Million) Forecast, by Application 2019 & 2032
- Table 22: South Korea Spatial Genomics and Transcriptomics Market Revenue (Million) Forecast, by Application 2019 & 2032
- Table 23: Rest of Asia Pacific Spatial Genomics and Transcriptomics Market Revenue (Million) Forecast, by Application 2019 & 2032
- Table 24: Global Spatial Genomics and Transcriptomics Market Revenue Million Forecast, by Country 2019 & 2032
- Table 25: GCC Spatial Genomics and Transcriptomics Market Revenue (Million) Forecast, by Application 2019 & 2032
- Table 26: South Africa Spatial Genomics and Transcriptomics Market Revenue (Million) Forecast, by Application 2019 & 2032
- Table 27: Rest of Middle East and Africa Spatial Genomics and Transcriptomics Market Revenue (Million) Forecast, by Application 2019 & 2032
- Table 28: Global Spatial Genomics and Transcriptomics Market Revenue Million Forecast, by Country 2019 & 2032
- Table 29: Brazil Spatial Genomics and Transcriptomics Market Revenue (Million) Forecast, by Application 2019 & 2032
- Table 30: Argentina Spatial Genomics and Transcriptomics Market Revenue (Million) Forecast, by Application 2019 & 2032
- Table 31: Rest of South America Spatial Genomics and Transcriptomics Market Revenue (Million) Forecast, by Application 2019 & 2032
- Table 32: Global Spatial Genomics and Transcriptomics Market Revenue Million Forecast, by Technology 2019 & 2032
- Table 33: Global Spatial Genomics and Transcriptomics Market Revenue Million Forecast, by Product 2019 & 2032
- Table 34: Global Spatial Genomics and Transcriptomics Market Revenue Million Forecast, by End-User 2019 & 2032
- Table 35: Global Spatial Genomics and Transcriptomics Market Revenue Million Forecast, by Country 2019 & 2032
- Table 36: United States Spatial Genomics and Transcriptomics Market Revenue (Million) Forecast, by Application 2019 & 2032
- Table 37: Canada Spatial Genomics and Transcriptomics Market Revenue (Million) Forecast, by Application 2019 & 2032
- Table 38: Mexico Spatial Genomics and Transcriptomics Market Revenue (Million) Forecast, by Application 2019 & 2032
- Table 39: Global Spatial Genomics and Transcriptomics Market Revenue Million Forecast, by Technology 2019 & 2032
- Table 40: Global Spatial Genomics and Transcriptomics Market Revenue Million Forecast, by Product 2019 & 2032
- Table 41: Global Spatial Genomics and Transcriptomics Market Revenue Million Forecast, by End-User 2019 & 2032
- Table 42: Global Spatial Genomics and Transcriptomics Market Revenue Million Forecast, by Country 2019 & 2032
- Table 43: Germany Spatial Genomics and Transcriptomics Market Revenue (Million) Forecast, by Application 2019 & 2032
- Table 44: United Kingdom Spatial Genomics and Transcriptomics Market Revenue (Million) Forecast, by Application 2019 & 2032
- Table 45: France Spatial Genomics and Transcriptomics Market Revenue (Million) Forecast, by Application 2019 & 2032
- Table 46: Italy Spatial Genomics and Transcriptomics Market Revenue (Million) Forecast, by Application 2019 & 2032
- Table 47: Spain Spatial Genomics and Transcriptomics Market Revenue (Million) Forecast, by Application 2019 & 2032
- Table 48: Rest of Europe Spatial Genomics and Transcriptomics Market Revenue (Million) Forecast, by Application 2019 & 2032
- Table 49: Global Spatial Genomics and Transcriptomics Market Revenue Million Forecast, by Technology 2019 & 2032
- Table 50: Global Spatial Genomics and Transcriptomics Market Revenue Million Forecast, by Product 2019 & 2032
- Table 51: Global Spatial Genomics and Transcriptomics Market Revenue Million Forecast, by End-User 2019 & 2032
- Table 52: Global Spatial Genomics and Transcriptomics Market Revenue Million Forecast, by Country 2019 & 2032
- Table 53: China Spatial Genomics and Transcriptomics Market Revenue (Million) Forecast, by Application 2019 & 2032
- Table 54: Japan Spatial Genomics and Transcriptomics Market Revenue (Million) Forecast, by Application 2019 & 2032
- Table 55: India Spatial Genomics and Transcriptomics Market Revenue (Million) Forecast, by Application 2019 & 2032
- Table 56: Australia Spatial Genomics and Transcriptomics Market Revenue (Million) Forecast, by Application 2019 & 2032
- Table 57: South Korea Spatial Genomics and Transcriptomics Market Revenue (Million) Forecast, by Application 2019 & 2032
- Table 58: Rest of Asia Pacific Spatial Genomics and Transcriptomics Market Revenue (Million) Forecast, by Application 2019 & 2032
- Table 59: Global Spatial Genomics and Transcriptomics Market Revenue Million Forecast, by Technology 2019 & 2032
- Table 60: Global Spatial Genomics and Transcriptomics Market Revenue Million Forecast, by Product 2019 & 2032
- Table 61: Global Spatial Genomics and Transcriptomics Market Revenue Million Forecast, by End-User 2019 & 2032
- Table 62: Global Spatial Genomics and Transcriptomics Market Revenue Million Forecast, by Country 2019 & 2032
- Table 63: GCC Spatial Genomics and Transcriptomics Market Revenue (Million) Forecast, by Application 2019 & 2032
- Table 64: South Africa Spatial Genomics and Transcriptomics Market Revenue (Million) Forecast, by Application 2019 & 2032
- Table 65: Rest of Middle East and Africa Spatial Genomics and Transcriptomics Market Revenue (Million) Forecast, by Application 2019 & 2032
- Table 66: Global Spatial Genomics and Transcriptomics Market Revenue Million Forecast, by Technology 2019 & 2032
- Table 67: Global Spatial Genomics and Transcriptomics Market Revenue Million Forecast, by Product 2019 & 2032
- Table 68: Global Spatial Genomics and Transcriptomics Market Revenue Million Forecast, by End-User 2019 & 2032
- Table 69: Global Spatial Genomics and Transcriptomics Market Revenue Million Forecast, by Country 2019 & 2032
- Table 70: Brazil Spatial Genomics and Transcriptomics Market Revenue (Million) Forecast, by Application 2019 & 2032
- Table 71: Argentina Spatial Genomics and Transcriptomics Market Revenue (Million) Forecast, by Application 2019 & 2032
- Table 72: Rest of South America Spatial Genomics and Transcriptomics Market Revenue (Million) Forecast, by Application 2019 & 2032
Frequently Asked Questions
1. What is the projected Compound Annual Growth Rate (CAGR) of the Spatial Genomics and Transcriptomics Market?
The projected CAGR is approximately 8.20%.
2. Which companies are prominent players in the Spatial Genomics and Transcriptomics Market?
Key companies in the market include Akoya Biosciences Inc, 10x Genomics, Advanced Cell Diagnostics Inc (ACD), Naterac Inc, Bio-Techne, Illumina Inc, Fluidigm, S2 Genomics Inc, Seven Bridges Genomics*List Not Exhaustive, Dovetail Genomics, NanoString Technologies Inc, Horizon Discovery Group plc.
3. What are the main segments of the Spatial Genomics and Transcriptomics Market?
The market segments include Technology, Product, End-User.
4. Can you provide details about the market size?
The market size is estimated to be USD XX Million as of 2022.
5. What are some drivers contributing to market growth?
Emerging Potential of Spatial Genomic Analysis as Cancer Diagnostic Tool; Increasing Advanced Technologies of Spatial Genomics and Transcriptomics; Advent of Fourth Generation of Sequencing.
6. What are the notable trends driving market growth?
Consumables Segment is Expected to Witness Healthy Growth During the Forecast Period.
7. Are there any restraints impacting market growth?
Slow Implementation of Technology; Well-Established Workflows for Conventional Genomics and Transcriptomics Analysis.
8. Can you provide examples of recent developments in the market?
May 2022: NanoString announced a seamless, cloud-based workflow that improves the spatial data analysis experience of customers using Illumina NextSeq 1000 and NextSeq 2000 sequencing systems and the GeoMx Digital Spatial Profiler to facilitate spatial biology research using next-generation sequencing.
9. What pricing options are available for accessing the report?
Pricing options include single-user, multi-user, and enterprise licenses priced at USD 4750, USD 5250, and USD 8750 respectively.
10. Is the market size provided in terms of value or volume?
The market size is provided in terms of value, measured in Million.
11. Are there any specific market keywords associated with the report?
Yes, the market keyword associated with the report is "Spatial Genomics and Transcriptomics Market," which aids in identifying and referencing the specific market segment covered.
12. How do I determine which pricing option suits my needs best?
The pricing options vary based on user requirements and access needs. Individual users may opt for single-user licenses, while businesses requiring broader access may choose multi-user or enterprise licenses for cost-effective access to the report.
13. Are there any additional resources or data provided in the Spatial Genomics and Transcriptomics Market report?
While the report offers comprehensive insights, it's advisable to review the specific contents or supplementary materials provided to ascertain if additional resources or data are available.
14. How can I stay updated on further developments or reports in the Spatial Genomics and Transcriptomics Market?
To stay informed about further developments, trends, and reports in the Spatial Genomics and Transcriptomics Market, consider subscribing to industry newsletters, following relevant companies and organizations, or regularly checking reputable industry news sources and publications.
Methodology
Step 1 - Identification of Relevant Samples Size from Population Database


Step 2 - Approaches for Defining Global Market Size (Value, Volume* & Price*)

Note*: In applicable scenarios
Step 3 - Data Sources
Primary Research
- Web Analytics
- Survey Reports
- Research Institute
- Latest Research Reports
- Opinion Leaders
Secondary Research
- Annual Reports
- White Paper
- Latest Press Release
- Industry Association
- Paid Database
- Investor Presentations

Step 4 - Data Triangulation
Involves using different sources of information in order to increase the validity of a study
These sources are likely to be stakeholders in a program - participants, other researchers, program staff, other community members, and so on.
Then we put all data in single framework & apply various statistical tools to find out the dynamic on the market.
During the analysis stage, feedback from the stakeholder groups would be compared to determine areas of agreement as well as areas of divergence
