

Key Insights
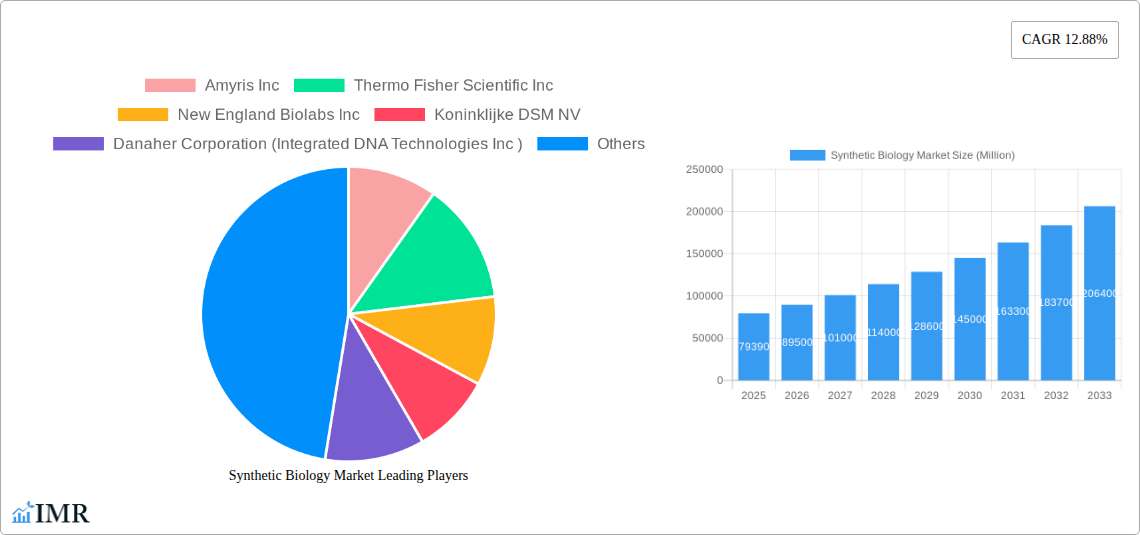
The synthetic biology market is experiencing robust growth, projected to reach \$79.39 billion in 2025 and exhibiting a Compound Annual Growth Rate (CAGR) of 12.88% from 2025 to 2033. This expansion is driven by several key factors. Firstly, advancements in gene editing technologies like CRISPR-Cas9 are enabling precise manipulation of genetic material, opening new avenues for developing novel bio-based products and processes. Secondly, the increasing demand for sustainable and environmentally friendly alternatives in various industries, such as healthcare, chemicals, and food and agriculture, is fueling the adoption of synthetic biology solutions. The development of novel biofuels and bio-based materials is a significant contributor to this market growth. Furthermore, growing investments in research and development by both public and private entities are accelerating innovation and commercialization within the sector. The market is segmented by product type (core, enabling, and enabled products) and application (healthcare, chemicals including biofuels, food & agriculture, and other applications like biosecurity, energy, and environmental remediation). Competition is intense, with major players like Amyris, Thermo Fisher Scientific, and Illumina driving innovation and market penetration. However, regulatory hurdles and ethical concerns surrounding the use of genetically modified organisms (GMOs) pose challenges to the market's continued expansion.
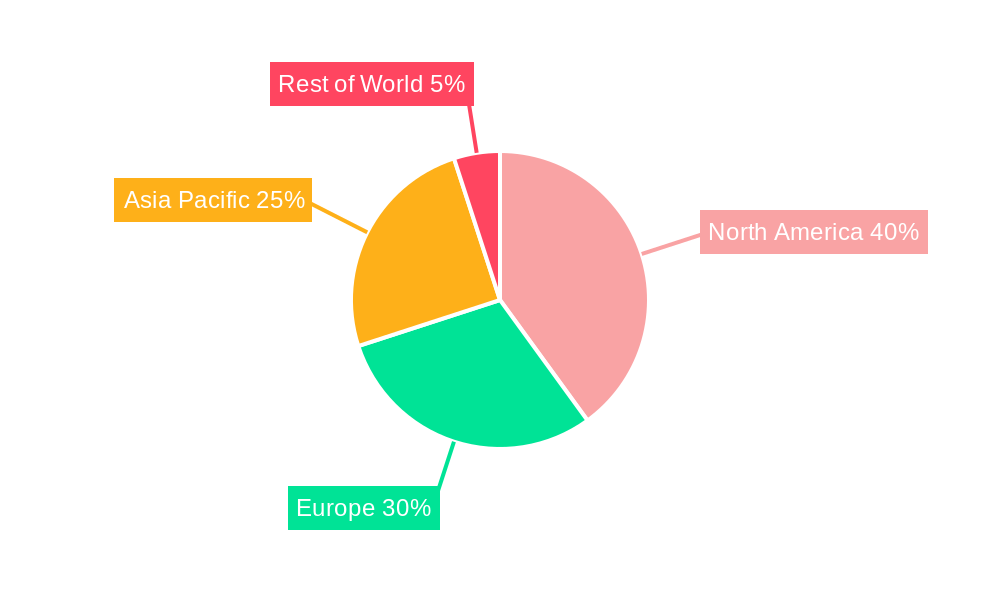
The geographical distribution of the market is diverse, with North America currently holding a significant share, owing to strong research infrastructure and early adoption of synthetic biology technologies. However, the Asia-Pacific region is projected to witness substantial growth in the coming years, driven by increasing government support, burgeoning economies, and a rising demand for sustainable solutions in developing countries. Europe also holds a significant market share due to its strong research base and regulatory frameworks which, while stringent, are fostering responsible innovation. The forecast period (2025-2033) anticipates continued expansion, primarily driven by ongoing technological advancements, expanding applications, and a growing awareness of the sustainability benefits offered by synthetic biology solutions. Successful commercialization of new products and processes, particularly in the biofuels and biomaterials sectors, will be pivotal to achieving the projected market growth.
Synthetic Biology Market: A Comprehensive Report (2019-2033)
This in-depth report provides a comprehensive analysis of the Synthetic Biology market, encompassing market dynamics, growth trends, regional analysis, product landscape, and key player strategies. With a study period spanning 2019-2033, a base year of 2025, and a forecast period of 2025-2033, this report offers invaluable insights for industry professionals, investors, and researchers seeking to understand and capitalize on the opportunities within this rapidly evolving sector. The report segments the market by product (Core Products, Enabling Products, Enabled Products) and application (Healthcare, Chemicals (including Biofuels), Food and Agriculture, Other Applications). The market is projected to reach xx Million by 2033.
Synthetic Biology Market Market Dynamics & Structure
The synthetic biology market is characterized by a moderately concentrated structure, with several key players holding significant market share. However, the landscape is dynamic, driven by continuous technological innovations and a growing number of emerging companies. The market's growth is fueled by advancements in gene editing technologies (CRISPR-Cas9), increased R&D investments, and rising demand across diverse applications. Regulatory frameworks, though evolving, play a crucial role in shaping market development. Competitive pressures stem from the emergence of substitute technologies and the entry of new players. Mergers and acquisitions (M&A) activity is relatively high, reflecting industry consolidation and strategic expansion efforts.
- Market Concentration: Moderately concentrated, with top 10 players holding approximately xx% market share in 2024.
- Technological Innovation Drivers: CRISPR-Cas9, advancements in DNA sequencing, and bioinformatics.
- Regulatory Frameworks: Varying regulations across different regions impacting market entry and product approvals.
- Competitive Product Substitutes: Traditional chemical and biological methods pose competition in specific applications.
- End-User Demographics: Primarily research institutions, pharmaceutical companies, biotech firms, and agricultural companies.
- M&A Trends: Significant M&A activity in recent years, with xx major deals recorded between 2019 and 2024, signaling industry consolidation and strategic partnerships.
Synthetic Biology Market Growth Trends & Insights
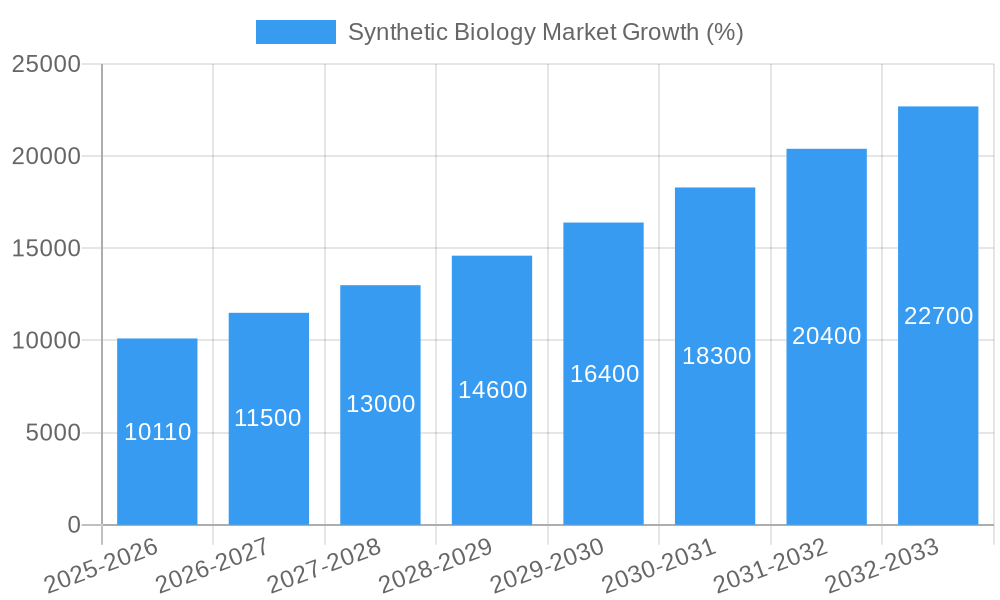
The synthetic biology market has witnessed substantial growth in recent years, driven by factors such as increasing demand for bio-based products, advancements in genetic engineering techniques, and rising investments in research and development. The market size is estimated to be xx Million in 2025, with a projected Compound Annual Growth Rate (CAGR) of xx% during the forecast period (2025-2033). This growth is attributed to the increasing adoption of synthetic biology technologies across various sectors, including healthcare, chemicals, and agriculture. Technological disruptions, such as the development of more efficient gene editing tools, are further accelerating market expansion. Consumer behavior is shifting towards sustainable and bio-based products, driving demand for synthetic biology-derived solutions. Market penetration continues to increase, particularly in the healthcare and agricultural sectors.
Dominant Regions, Countries, or Segments in Synthetic Biology Market
North America currently holds the largest market share, driven by robust R&D investments, strong regulatory support, and the presence of major players. Europe and Asia Pacific are also witnessing significant growth, fueled by increasing government initiatives and a growing demand for sustainable solutions. Within the product segments, Enabling Products (e.g., gene editing tools, synthetic DNA) currently dominate the market due to their widespread use in various applications. The Healthcare segment shows the strongest growth potential across applications driven by the development of novel therapeutics and diagnostic tools.
- Key Drivers (North America): High R&D spending, strong intellectual property protection, and established biotechnology industry.
- Key Drivers (Europe): Growing government support for green technologies and increasing focus on sustainable solutions.
- Key Drivers (Asia Pacific): Rapid economic growth, rising disposable incomes, and expanding healthcare infrastructure.
- Dominant Product Segment: Enabling Products, driven by high demand for gene editing tools and synthetic DNA.
- Dominant Application Segment: Healthcare, fuelled by the development of novel therapeutics and diagnostic tools.
Synthetic Biology Market Product Landscape
The synthetic biology product landscape is characterized by a diverse range of core products (e.g., genetically modified organisms, engineered enzymes), enabling products (e.g., gene editing tools, DNA synthesis platforms), and enabled products (e.g., biofuels, bio-based materials). Recent innovations include advancements in CRISPR-Cas9 technology, high-throughput screening platforms, and improved biomanufacturing processes. These advancements improve efficiency and reduce costs, making synthetic biology technologies more accessible and cost-effective across various industries. Unique selling propositions include enhanced precision, scalability, and sustainability, compared to conventional methods.
Key Drivers, Barriers & Challenges in Synthetic Biology Market
Key Drivers:
- Technological advancements in gene editing, DNA synthesis, and bioinformatics.
- Increasing demand for sustainable and bio-based products across various sectors.
- Growing investments in R&D and strategic partnerships.
Key Challenges:
- High development costs and lengthy regulatory approval processes.
- Ethical concerns surrounding the use of genetically modified organisms.
- Potential for unintended environmental consequences.
- Competition from traditional methods and emerging technologies. This competition is estimated to result in a xx Million reduction in market value by 2030.
Emerging Opportunities in Synthetic Biology Market
Emerging opportunities lie in developing novel therapeutics, bio-based materials, and sustainable agriculture solutions using synthetic biology. Untapped markets include personalized medicine, advanced biomanufacturing, and bioremediation. Evolving consumer preferences for sustainable products create significant opportunities in food and agriculture and industrial applications.
Growth Accelerators in the Synthetic Biology Market Industry
Technological breakthroughs, particularly in gene editing and synthetic DNA construction, are key growth accelerators. Strategic partnerships between academic institutions, biotech companies, and industrial players are fostering innovation and market expansion. Government initiatives promoting sustainable technologies further catalyze market growth.
Key Players Shaping the Synthetic Biology Market Market
- Amyris Inc
- Thermo Fisher Scientific Inc
- New England Biolabs Inc
- Koninklijke DSM NV
- Danaher Corporation (Integrated DNA Technologies Inc)
- GenScript
- Precigen Inc (Intrexon Corporation)
- Illumina Inc
- Viridos Inc (Synthetic Genomics Inc)
- Novozymes AS
Notable Milestones in Synthetic Biology Market Sector
- January 2024: Launch of the Rice Synthetic Biology Institute at Rice University, fostering collaborative research and technology translation.
- May 2023: GenScript Biotech Corporation's SynBioBeta Conference showcased advancements in synthetic biology tools and techniques.
In-Depth Synthetic Biology Market Market Outlook
The synthetic biology market is poised for significant long-term growth, driven by continuous technological advancements, increasing demand for sustainable solutions, and rising investments. Strategic partnerships and market expansion efforts will play a crucial role in shaping future market dynamics. The potential for disruptive innovations and the expansion into new applications present substantial opportunities for growth and investment.
Synthetic Biology Market Segmentation
-
1. Product
- 1.1. Core Products
- 1.2. Enabling Products
- 1.3. Enabled Products
-
2. Applications
- 2.1. Healthcare
- 2.2. Chemicals (Including Biofuels)
- 2.3. Food and Agriculture
- 2.4. Other Ap
Synthetic Biology Market Segmentation By Geography
-
1. North America
- 1.1. United States
- 1.2. Canada
- 1.3. Mexico
-
2. Europe
- 2.1. Germany
- 2.2. United Kingdom
- 2.3. France
- 2.4. Italy
- 2.5. Spain
- 2.6. Rest of Europe
-
3. Asia Pacific
- 3.1. China
- 3.2. Japan
- 3.3. India
- 3.4. Australia
- 3.5. South Korea
- 3.6. Rest of Asia Pacific
-
4. Middle East and Africa
- 4.1. GCC
- 4.2. South Africa
- 4.3. Rest of Middle East and Africa
-
5. South America
- 5.1. Brazil
- 5.2. Argentina
- 5.3. Rest of South America
Synthetic Biology Market REPORT HIGHLIGHTS
| Aspects | Details |
|---|---|
| Study Period | 2019-2033 |
| Base Year | 2024 |
| Estimated Year | 2025 |
| Forecast Period | 2025-2033 |
| Historical Period | 2019-2024 |
| Growth Rate | CAGR of 12.88% from 2019-2033 |
| Segmentation |
|
Table of Contents
- 1. Introduction
- 1.1. Research Scope
- 1.2. Market Segmentation
- 1.3. Research Methodology
- 1.4. Definitions and Assumptions
- 2. Executive Summary
- 2.1. Introduction
- 3. Market Dynamics
- 3.1. Introduction
- 3.2. Market Drivers
- 3.2.1. Increasing Support from Government and Private Institutions; Increasing R&D Investments in Drug Discovery and Development; Declining Cost of DNA Sequencing and Synthesizing
- 3.3. Market Restrains
- 3.3.1. Bio-safety and Bio-security; Ethical Issues Related to Synthetic Biology; Reimbursement Cuts Causing Pricing Pressure
- 3.4. Market Trends
- 3.4.1. The Healthcare Segment is Expected to Witness Significant Growth During the Forecast Period
- 4. Market Factor Analysis
- 4.1. Porters Five Forces
- 4.2. Supply/Value Chain
- 4.3. PESTEL analysis
- 4.4. Market Entropy
- 4.5. Patent/Trademark Analysis
- 5. Global Synthetic Biology Market Analysis, Insights and Forecast, 2019-2031
- 5.1. Market Analysis, Insights and Forecast - by Product
- 5.1.1. Core Products
- 5.1.2. Enabling Products
- 5.1.3. Enabled Products
- 5.2. Market Analysis, Insights and Forecast - by Applications
- 5.2.1. Healthcare
- 5.2.2. Chemicals (Including Biofuels)
- 5.2.3. Food and Agriculture
- 5.2.4. Other Ap
- 5.3. Market Analysis, Insights and Forecast - by Region
- 5.3.1. North America
- 5.3.2. Europe
- 5.3.3. Asia Pacific
- 5.3.4. Middle East and Africa
- 5.3.5. South America
- 5.1. Market Analysis, Insights and Forecast - by Product
- 6. North America Synthetic Biology Market Analysis, Insights and Forecast, 2019-2031
- 6.1. Market Analysis, Insights and Forecast - by Product
- 6.1.1. Core Products
- 6.1.2. Enabling Products
- 6.1.3. Enabled Products
- 6.2. Market Analysis, Insights and Forecast - by Applications
- 6.2.1. Healthcare
- 6.2.2. Chemicals (Including Biofuels)
- 6.2.3. Food and Agriculture
- 6.2.4. Other Ap
- 6.1. Market Analysis, Insights and Forecast - by Product
- 7. Europe Synthetic Biology Market Analysis, Insights and Forecast, 2019-2031
- 7.1. Market Analysis, Insights and Forecast - by Product
- 7.1.1. Core Products
- 7.1.2. Enabling Products
- 7.1.3. Enabled Products
- 7.2. Market Analysis, Insights and Forecast - by Applications
- 7.2.1. Healthcare
- 7.2.2. Chemicals (Including Biofuels)
- 7.2.3. Food and Agriculture
- 7.2.4. Other Ap
- 7.1. Market Analysis, Insights and Forecast - by Product
- 8. Asia Pacific Synthetic Biology Market Analysis, Insights and Forecast, 2019-2031
- 8.1. Market Analysis, Insights and Forecast - by Product
- 8.1.1. Core Products
- 8.1.2. Enabling Products
- 8.1.3. Enabled Products
- 8.2. Market Analysis, Insights and Forecast - by Applications
- 8.2.1. Healthcare
- 8.2.2. Chemicals (Including Biofuels)
- 8.2.3. Food and Agriculture
- 8.2.4. Other Ap
- 8.1. Market Analysis, Insights and Forecast - by Product
- 9. Middle East and Africa Synthetic Biology Market Analysis, Insights and Forecast, 2019-2031
- 9.1. Market Analysis, Insights and Forecast - by Product
- 9.1.1. Core Products
- 9.1.2. Enabling Products
- 9.1.3. Enabled Products
- 9.2. Market Analysis, Insights and Forecast - by Applications
- 9.2.1. Healthcare
- 9.2.2. Chemicals (Including Biofuels)
- 9.2.3. Food and Agriculture
- 9.2.4. Other Ap
- 9.1. Market Analysis, Insights and Forecast - by Product
- 10. South America Synthetic Biology Market Analysis, Insights and Forecast, 2019-2031
- 10.1. Market Analysis, Insights and Forecast - by Product
- 10.1.1. Core Products
- 10.1.2. Enabling Products
- 10.1.3. Enabled Products
- 10.2. Market Analysis, Insights and Forecast - by Applications
- 10.2.1. Healthcare
- 10.2.2. Chemicals (Including Biofuels)
- 10.2.3. Food and Agriculture
- 10.2.4. Other Ap
- 10.1. Market Analysis, Insights and Forecast - by Product
- 11. North America Synthetic Biology Market Analysis, Insights and Forecast, 2019-2031
- 11.1. Market Analysis, Insights and Forecast - By Country/Sub-region
- 11.1.1 United States
- 11.1.2 Canada
- 11.1.3 Mexico
- 12. Europe Synthetic Biology Market Analysis, Insights and Forecast, 2019-2031
- 12.1. Market Analysis, Insights and Forecast - By Country/Sub-region
- 12.1.1 Germany
- 12.1.2 United Kingdom
- 12.1.3 France
- 12.1.4 Italy
- 12.1.5 Spain
- 12.1.6 Rest of Europe
- 13. Asia Pacific Synthetic Biology Market Analysis, Insights and Forecast, 2019-2031
- 13.1. Market Analysis, Insights and Forecast - By Country/Sub-region
- 13.1.1 China
- 13.1.2 Japan
- 13.1.3 India
- 13.1.4 Australia
- 13.1.5 South Korea
- 13.1.6 Rest of Asia Pacific
- 14. Middle East and Africa Synthetic Biology Market Analysis, Insights and Forecast, 2019-2031
- 14.1. Market Analysis, Insights and Forecast - By Country/Sub-region
- 14.1.1 GCC
- 14.1.2 South Africa
- 14.1.3 Rest of Middle East and Africa
- 15. South America Synthetic Biology Market Analysis, Insights and Forecast, 2019-2031
- 15.1. Market Analysis, Insights and Forecast - By Country/Sub-region
- 15.1.1 Brazil
- 15.1.2 Argentina
- 15.1.3 Rest of South America
- 16. Competitive Analysis
- 16.1. Global Market Share Analysis 2024
- 16.2. Company Profiles
- 16.2.1 Amyris Inc
- 16.2.1.1. Overview
- 16.2.1.2. Products
- 16.2.1.3. SWOT Analysis
- 16.2.1.4. Recent Developments
- 16.2.1.5. Financials (Based on Availability)
- 16.2.2 Thermo Fisher Scientific Inc
- 16.2.2.1. Overview
- 16.2.2.2. Products
- 16.2.2.3. SWOT Analysis
- 16.2.2.4. Recent Developments
- 16.2.2.5. Financials (Based on Availability)
- 16.2.3 New England Biolabs Inc
- 16.2.3.1. Overview
- 16.2.3.2. Products
- 16.2.3.3. SWOT Analysis
- 16.2.3.4. Recent Developments
- 16.2.3.5. Financials (Based on Availability)
- 16.2.4 Koninklijke DSM NV
- 16.2.4.1. Overview
- 16.2.4.2. Products
- 16.2.4.3. SWOT Analysis
- 16.2.4.4. Recent Developments
- 16.2.4.5. Financials (Based on Availability)
- 16.2.5 Danaher Corporation (Integrated DNA Technologies Inc )
- 16.2.5.1. Overview
- 16.2.5.2. Products
- 16.2.5.3. SWOT Analysis
- 16.2.5.4. Recent Developments
- 16.2.5.5. Financials (Based on Availability)
- 16.2.6 GenScript
- 16.2.6.1. Overview
- 16.2.6.2. Products
- 16.2.6.3. SWOT Analysis
- 16.2.6.4. Recent Developments
- 16.2.6.5. Financials (Based on Availability)
- 16.2.7 Precigen Inc (Intrexon Corporation)
- 16.2.7.1. Overview
- 16.2.7.2. Products
- 16.2.7.3. SWOT Analysis
- 16.2.7.4. Recent Developments
- 16.2.7.5. Financials (Based on Availability)
- 16.2.8 Illumina Inc
- 16.2.8.1. Overview
- 16.2.8.2. Products
- 16.2.8.3. SWOT Analysis
- 16.2.8.4. Recent Developments
- 16.2.8.5. Financials (Based on Availability)
- 16.2.9 Viridos Inc (Synthetic Genomics Inc )*List Not Exhaustive
- 16.2.9.1. Overview
- 16.2.9.2. Products
- 16.2.9.3. SWOT Analysis
- 16.2.9.4. Recent Developments
- 16.2.9.5. Financials (Based on Availability)
- 16.2.10 Novozymes AS
- 16.2.10.1. Overview
- 16.2.10.2. Products
- 16.2.10.3. SWOT Analysis
- 16.2.10.4. Recent Developments
- 16.2.10.5. Financials (Based on Availability)
- 16.2.1 Amyris Inc
List of Figures
- Figure 1: Global Synthetic Biology Market Revenue Breakdown (Million, %) by Region 2024 & 2032
- Figure 2: North America Synthetic Biology Market Revenue (Million), by Country 2024 & 2032
- Figure 3: North America Synthetic Biology Market Revenue Share (%), by Country 2024 & 2032
- Figure 4: Europe Synthetic Biology Market Revenue (Million), by Country 2024 & 2032
- Figure 5: Europe Synthetic Biology Market Revenue Share (%), by Country 2024 & 2032
- Figure 6: Asia Pacific Synthetic Biology Market Revenue (Million), by Country 2024 & 2032
- Figure 7: Asia Pacific Synthetic Biology Market Revenue Share (%), by Country 2024 & 2032
- Figure 8: Middle East and Africa Synthetic Biology Market Revenue (Million), by Country 2024 & 2032
- Figure 9: Middle East and Africa Synthetic Biology Market Revenue Share (%), by Country 2024 & 2032
- Figure 10: South America Synthetic Biology Market Revenue (Million), by Country 2024 & 2032
- Figure 11: South America Synthetic Biology Market Revenue Share (%), by Country 2024 & 2032
- Figure 12: North America Synthetic Biology Market Revenue (Million), by Product 2024 & 2032
- Figure 13: North America Synthetic Biology Market Revenue Share (%), by Product 2024 & 2032
- Figure 14: North America Synthetic Biology Market Revenue (Million), by Applications 2024 & 2032
- Figure 15: North America Synthetic Biology Market Revenue Share (%), by Applications 2024 & 2032
- Figure 16: North America Synthetic Biology Market Revenue (Million), by Country 2024 & 2032
- Figure 17: North America Synthetic Biology Market Revenue Share (%), by Country 2024 & 2032
- Figure 18: Europe Synthetic Biology Market Revenue (Million), by Product 2024 & 2032
- Figure 19: Europe Synthetic Biology Market Revenue Share (%), by Product 2024 & 2032
- Figure 20: Europe Synthetic Biology Market Revenue (Million), by Applications 2024 & 2032
- Figure 21: Europe Synthetic Biology Market Revenue Share (%), by Applications 2024 & 2032
- Figure 22: Europe Synthetic Biology Market Revenue (Million), by Country 2024 & 2032
- Figure 23: Europe Synthetic Biology Market Revenue Share (%), by Country 2024 & 2032
- Figure 24: Asia Pacific Synthetic Biology Market Revenue (Million), by Product 2024 & 2032
- Figure 25: Asia Pacific Synthetic Biology Market Revenue Share (%), by Product 2024 & 2032
- Figure 26: Asia Pacific Synthetic Biology Market Revenue (Million), by Applications 2024 & 2032
- Figure 27: Asia Pacific Synthetic Biology Market Revenue Share (%), by Applications 2024 & 2032
- Figure 28: Asia Pacific Synthetic Biology Market Revenue (Million), by Country 2024 & 2032
- Figure 29: Asia Pacific Synthetic Biology Market Revenue Share (%), by Country 2024 & 2032
- Figure 30: Middle East and Africa Synthetic Biology Market Revenue (Million), by Product 2024 & 2032
- Figure 31: Middle East and Africa Synthetic Biology Market Revenue Share (%), by Product 2024 & 2032
- Figure 32: Middle East and Africa Synthetic Biology Market Revenue (Million), by Applications 2024 & 2032
- Figure 33: Middle East and Africa Synthetic Biology Market Revenue Share (%), by Applications 2024 & 2032
- Figure 34: Middle East and Africa Synthetic Biology Market Revenue (Million), by Country 2024 & 2032
- Figure 35: Middle East and Africa Synthetic Biology Market Revenue Share (%), by Country 2024 & 2032
- Figure 36: South America Synthetic Biology Market Revenue (Million), by Product 2024 & 2032
- Figure 37: South America Synthetic Biology Market Revenue Share (%), by Product 2024 & 2032
- Figure 38: South America Synthetic Biology Market Revenue (Million), by Applications 2024 & 2032
- Figure 39: South America Synthetic Biology Market Revenue Share (%), by Applications 2024 & 2032
- Figure 40: South America Synthetic Biology Market Revenue (Million), by Country 2024 & 2032
- Figure 41: South America Synthetic Biology Market Revenue Share (%), by Country 2024 & 2032
List of Tables
- Table 1: Global Synthetic Biology Market Revenue Million Forecast, by Region 2019 & 2032
- Table 2: Global Synthetic Biology Market Revenue Million Forecast, by Product 2019 & 2032
- Table 3: Global Synthetic Biology Market Revenue Million Forecast, by Applications 2019 & 2032
- Table 4: Global Synthetic Biology Market Revenue Million Forecast, by Region 2019 & 2032
- Table 5: Global Synthetic Biology Market Revenue Million Forecast, by Country 2019 & 2032
- Table 6: United States Synthetic Biology Market Revenue (Million) Forecast, by Application 2019 & 2032
- Table 7: Canada Synthetic Biology Market Revenue (Million) Forecast, by Application 2019 & 2032
- Table 8: Mexico Synthetic Biology Market Revenue (Million) Forecast, by Application 2019 & 2032
- Table 9: Global Synthetic Biology Market Revenue Million Forecast, by Country 2019 & 2032
- Table 10: Germany Synthetic Biology Market Revenue (Million) Forecast, by Application 2019 & 2032
- Table 11: United Kingdom Synthetic Biology Market Revenue (Million) Forecast, by Application 2019 & 2032
- Table 12: France Synthetic Biology Market Revenue (Million) Forecast, by Application 2019 & 2032
- Table 13: Italy Synthetic Biology Market Revenue (Million) Forecast, by Application 2019 & 2032
- Table 14: Spain Synthetic Biology Market Revenue (Million) Forecast, by Application 2019 & 2032
- Table 15: Rest of Europe Synthetic Biology Market Revenue (Million) Forecast, by Application 2019 & 2032
- Table 16: Global Synthetic Biology Market Revenue Million Forecast, by Country 2019 & 2032
- Table 17: China Synthetic Biology Market Revenue (Million) Forecast, by Application 2019 & 2032
- Table 18: Japan Synthetic Biology Market Revenue (Million) Forecast, by Application 2019 & 2032
- Table 19: India Synthetic Biology Market Revenue (Million) Forecast, by Application 2019 & 2032
- Table 20: Australia Synthetic Biology Market Revenue (Million) Forecast, by Application 2019 & 2032
- Table 21: South Korea Synthetic Biology Market Revenue (Million) Forecast, by Application 2019 & 2032
- Table 22: Rest of Asia Pacific Synthetic Biology Market Revenue (Million) Forecast, by Application 2019 & 2032
- Table 23: Global Synthetic Biology Market Revenue Million Forecast, by Country 2019 & 2032
- Table 24: GCC Synthetic Biology Market Revenue (Million) Forecast, by Application 2019 & 2032
- Table 25: South Africa Synthetic Biology Market Revenue (Million) Forecast, by Application 2019 & 2032
- Table 26: Rest of Middle East and Africa Synthetic Biology Market Revenue (Million) Forecast, by Application 2019 & 2032
- Table 27: Global Synthetic Biology Market Revenue Million Forecast, by Country 2019 & 2032
- Table 28: Brazil Synthetic Biology Market Revenue (Million) Forecast, by Application 2019 & 2032
- Table 29: Argentina Synthetic Biology Market Revenue (Million) Forecast, by Application 2019 & 2032
- Table 30: Rest of South America Synthetic Biology Market Revenue (Million) Forecast, by Application 2019 & 2032
- Table 31: Global Synthetic Biology Market Revenue Million Forecast, by Product 2019 & 2032
- Table 32: Global Synthetic Biology Market Revenue Million Forecast, by Applications 2019 & 2032
- Table 33: Global Synthetic Biology Market Revenue Million Forecast, by Country 2019 & 2032
- Table 34: United States Synthetic Biology Market Revenue (Million) Forecast, by Application 2019 & 2032
- Table 35: Canada Synthetic Biology Market Revenue (Million) Forecast, by Application 2019 & 2032
- Table 36: Mexico Synthetic Biology Market Revenue (Million) Forecast, by Application 2019 & 2032
- Table 37: Global Synthetic Biology Market Revenue Million Forecast, by Product 2019 & 2032
- Table 38: Global Synthetic Biology Market Revenue Million Forecast, by Applications 2019 & 2032
- Table 39: Global Synthetic Biology Market Revenue Million Forecast, by Country 2019 & 2032
- Table 40: Germany Synthetic Biology Market Revenue (Million) Forecast, by Application 2019 & 2032
- Table 41: United Kingdom Synthetic Biology Market Revenue (Million) Forecast, by Application 2019 & 2032
- Table 42: France Synthetic Biology Market Revenue (Million) Forecast, by Application 2019 & 2032
- Table 43: Italy Synthetic Biology Market Revenue (Million) Forecast, by Application 2019 & 2032
- Table 44: Spain Synthetic Biology Market Revenue (Million) Forecast, by Application 2019 & 2032
- Table 45: Rest of Europe Synthetic Biology Market Revenue (Million) Forecast, by Application 2019 & 2032
- Table 46: Global Synthetic Biology Market Revenue Million Forecast, by Product 2019 & 2032
- Table 47: Global Synthetic Biology Market Revenue Million Forecast, by Applications 2019 & 2032
- Table 48: Global Synthetic Biology Market Revenue Million Forecast, by Country 2019 & 2032
- Table 49: China Synthetic Biology Market Revenue (Million) Forecast, by Application 2019 & 2032
- Table 50: Japan Synthetic Biology Market Revenue (Million) Forecast, by Application 2019 & 2032
- Table 51: India Synthetic Biology Market Revenue (Million) Forecast, by Application 2019 & 2032
- Table 52: Australia Synthetic Biology Market Revenue (Million) Forecast, by Application 2019 & 2032
- Table 53: South Korea Synthetic Biology Market Revenue (Million) Forecast, by Application 2019 & 2032
- Table 54: Rest of Asia Pacific Synthetic Biology Market Revenue (Million) Forecast, by Application 2019 & 2032
- Table 55: Global Synthetic Biology Market Revenue Million Forecast, by Product 2019 & 2032
- Table 56: Global Synthetic Biology Market Revenue Million Forecast, by Applications 2019 & 2032
- Table 57: Global Synthetic Biology Market Revenue Million Forecast, by Country 2019 & 2032
- Table 58: GCC Synthetic Biology Market Revenue (Million) Forecast, by Application 2019 & 2032
- Table 59: South Africa Synthetic Biology Market Revenue (Million) Forecast, by Application 2019 & 2032
- Table 60: Rest of Middle East and Africa Synthetic Biology Market Revenue (Million) Forecast, by Application 2019 & 2032
- Table 61: Global Synthetic Biology Market Revenue Million Forecast, by Product 2019 & 2032
- Table 62: Global Synthetic Biology Market Revenue Million Forecast, by Applications 2019 & 2032
- Table 63: Global Synthetic Biology Market Revenue Million Forecast, by Country 2019 & 2032
- Table 64: Brazil Synthetic Biology Market Revenue (Million) Forecast, by Application 2019 & 2032
- Table 65: Argentina Synthetic Biology Market Revenue (Million) Forecast, by Application 2019 & 2032
- Table 66: Rest of South America Synthetic Biology Market Revenue (Million) Forecast, by Application 2019 & 2032
Frequently Asked Questions
1. What is the projected Compound Annual Growth Rate (CAGR) of the Synthetic Biology Market?
The projected CAGR is approximately 12.88%.
2. Which companies are prominent players in the Synthetic Biology Market?
Key companies in the market include Amyris Inc, Thermo Fisher Scientific Inc, New England Biolabs Inc, Koninklijke DSM NV, Danaher Corporation (Integrated DNA Technologies Inc ), GenScript, Precigen Inc (Intrexon Corporation), Illumina Inc, Viridos Inc (Synthetic Genomics Inc )*List Not Exhaustive, Novozymes AS.
3. What are the main segments of the Synthetic Biology Market?
The market segments include Product, Applications.
4. Can you provide details about the market size?
The market size is estimated to be USD 79.39 Million as of 2022.
5. What are some drivers contributing to market growth?
Increasing Support from Government and Private Institutions; Increasing R&D Investments in Drug Discovery and Development; Declining Cost of DNA Sequencing and Synthesizing.
6. What are the notable trends driving market growth?
The Healthcare Segment is Expected to Witness Significant Growth During the Forecast Period.
7. Are there any restraints impacting market growth?
Bio-safety and Bio-security; Ethical Issues Related to Synthetic Biology; Reimbursement Cuts Causing Pricing Pressure.
8. Can you provide examples of recent developments in the market?
January 2024: Rice University of the United States launched the Rice Synthetic Biology Institute, which aims to catalyze collaborative research in synthetic biology and its translation into technologies that benefit society.
9. What pricing options are available for accessing the report?
Pricing options include single-user, multi-user, and enterprise licenses priced at USD 4750, USD 5250, and USD 8750 respectively.
10. Is the market size provided in terms of value or volume?
The market size is provided in terms of value, measured in Million.
11. Are there any specific market keywords associated with the report?
Yes, the market keyword associated with the report is "Synthetic Biology Market," which aids in identifying and referencing the specific market segment covered.
12. How do I determine which pricing option suits my needs best?
The pricing options vary based on user requirements and access needs. Individual users may opt for single-user licenses, while businesses requiring broader access may choose multi-user or enterprise licenses for cost-effective access to the report.
13. Are there any additional resources or data provided in the Synthetic Biology Market report?
While the report offers comprehensive insights, it's advisable to review the specific contents or supplementary materials provided to ascertain if additional resources or data are available.
14. How can I stay updated on further developments or reports in the Synthetic Biology Market?
To stay informed about further developments, trends, and reports in the Synthetic Biology Market, consider subscribing to industry newsletters, following relevant companies and organizations, or regularly checking reputable industry news sources and publications.
Methodology
Step 1 - Identification of Relevant Samples Size from Population Database


Step 2 - Approaches for Defining Global Market Size (Value, Volume* & Price*)

Note*: In applicable scenarios
Step 3 - Data Sources
Primary Research
- Web Analytics
- Survey Reports
- Research Institute
- Latest Research Reports
- Opinion Leaders
Secondary Research
- Annual Reports
- White Paper
- Latest Press Release
- Industry Association
- Paid Database
- Investor Presentations

Step 4 - Data Triangulation
Involves using different sources of information in order to increase the validity of a study
These sources are likely to be stakeholders in a program - participants, other researchers, program staff, other community members, and so on.
Then we put all data in single framework & apply various statistical tools to find out the dynamic on the market.
During the analysis stage, feedback from the stakeholder groups would be compared to determine areas of agreement as well as areas of divergence
