

Key Insights
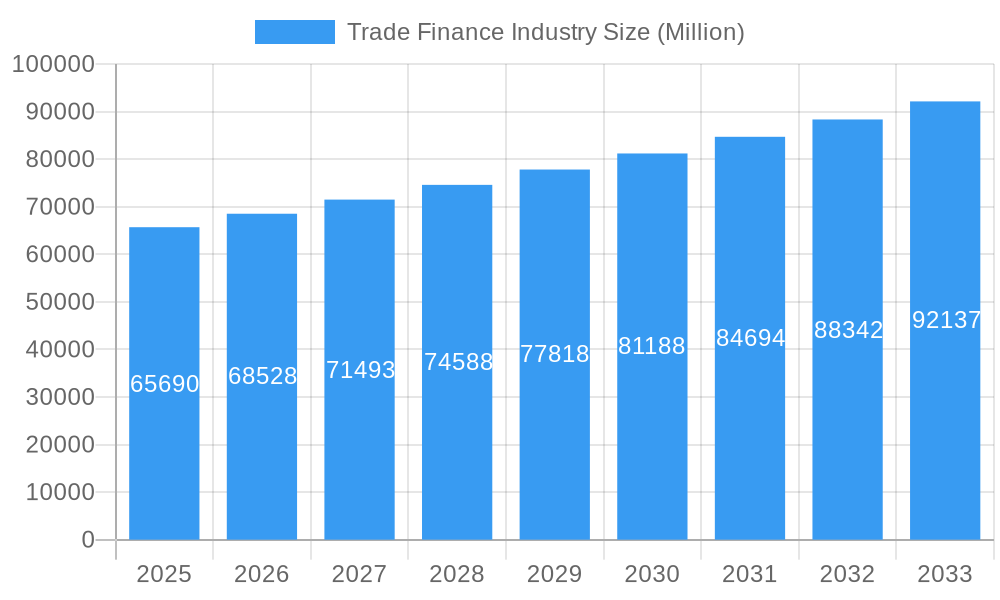
The global trade finance market, valued at $65.69 billion in 2025, is projected to experience robust growth, driven by the increasing volume of international trade and the rising demand for secure and efficient payment solutions. A compound annual growth rate (CAGR) of 4.24% from 2025 to 2033 indicates a significant expansion of the market over the forecast period. Key drivers include the growth of e-commerce and digitalization within the trade finance sector, leading to improved efficiency and reduced transaction costs. Furthermore, the increasing adoption of blockchain technology and other innovative solutions is streamlining processes and enhancing transparency. While regulatory changes and geopolitical uncertainties present some restraints, the overall outlook remains positive, fueled by the continued growth of global trade and the inherent need for secure financing mechanisms to facilitate international transactions. Major players like Citigroup, Santander, and others are strategically investing in technological advancements and expanding their global reach to capture market share within this dynamic and evolving landscape. The expanding middle class in developing economies is also contributing significantly to the growth, demanding more international trade and hence a wider need for trade finance solutions.
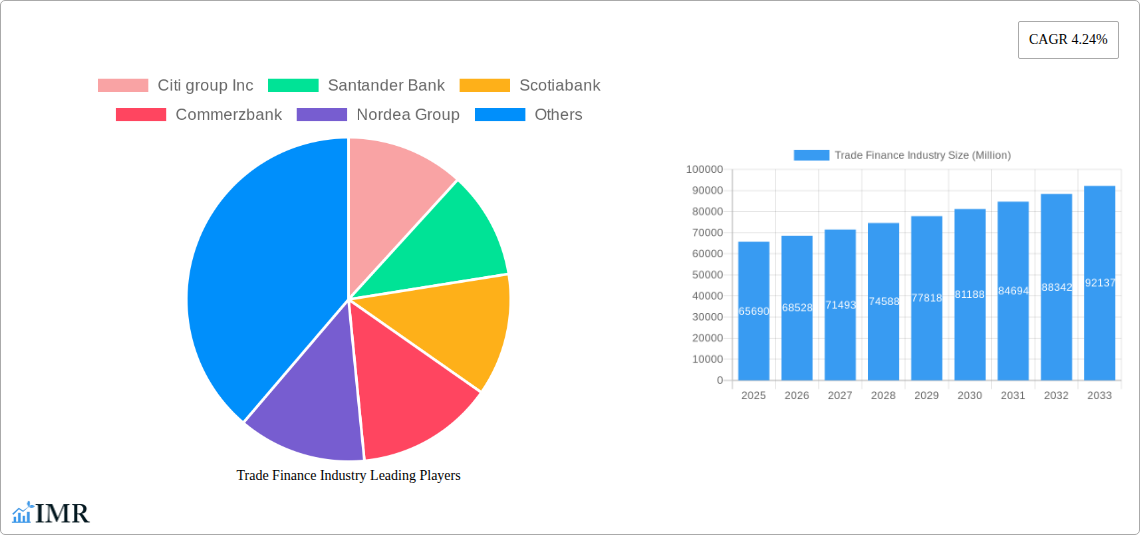
Trade Finance Industry Market Size (In Billion)
The competitive landscape is characterized by a mix of large multinational banks and specialized trade finance providers. These institutions are continually seeking to differentiate their offerings through innovative products, advanced technology platforms, and improved customer service. The increasing complexity of international trade requires sophisticated risk management solutions, driving demand for more specialized and customized services. Geographic expansion into emerging markets and strategic partnerships are key strategies for market leaders aiming to capitalize on the growth opportunities in this dynamic sector. The market is segmented by various factors including product type, service type, and geographical region, each presenting specific growth opportunities and challenges for the players involved. Future growth will likely be influenced by technological innovations, economic conditions, and regulatory frameworks globally.
Trade Finance Industry Company Market Share
Trade Finance Industry Market Report: 2019-2033
This comprehensive report provides an in-depth analysis of the global Trade Finance industry, encompassing market dynamics, growth trends, regional analysis, key players, and future opportunities. With a study period spanning 2019-2033, a base year of 2025, and a forecast period of 2025-2033, this report offers invaluable insights for industry professionals, investors, and strategic decision-makers. The report's parent market is the global financial services industry, while its child market is trade finance, specifically focusing on letter of credit, supply chain finance, and guarantees. Market values are presented in millions.
Trade Finance Industry Market Dynamics & Structure
The global trade finance market is characterized by a moderately concentrated landscape with several major players holding significant market share. While precise market share figures for each entity are proprietary information, key players like Citigroup Inc, Santander Bank, Scotiabank, Commerzbank, Nordea Group, Unicredit, Standard Chartered Bank, Arab Bank, Societe Generale, Rand Merchant Bank, Rabobank, China Construction Bank, and BNP Paribas, among others, dominate the market. The market structure is influenced by technological innovation, particularly in areas like blockchain and AI-driven solutions for improved efficiency and security. Stringent regulatory frameworks, including KYC/AML compliance, also play a pivotal role. The market is also susceptible to global economic fluctuations and geopolitical risks. Competitive product substitutes, such as alternative financing solutions, exert pressure. M&A activity is moderate; with approximately xx deals valued at xx Million in the historical period (2019-2024).
- Market Concentration: Moderately concentrated, dominated by multinational banks.
- Technological Innovation: Blockchain, AI, and automation driving efficiency.
- Regulatory Framework: Stringent KYC/AML compliance and other regulations.
- Competitive Substitutes: Alternative financing solutions emerging as competitors.
- End-User Demographics: Primarily large corporations and SMEs across various sectors.
- M&A Trends: Moderate activity with xx deals in 2019-2024, expected to rise to xx deals from 2025 - 2033
Trade Finance Industry Growth Trends & Insights
The global trade finance market exhibited steady growth during the historical period (2019-2024), experiencing a CAGR of xx%. This growth is attributed to increasing global trade volumes, the rising adoption of digital trade finance solutions, and the increasing demand for supply chain finance from SMEs. The market size in 2024 was approximately xx Million, and is projected to reach xx Million by 2025 and xx Million by 2033, showcasing a projected CAGR of xx% during the forecast period. Technological disruptions, such as blockchain technology, have significantly influenced market dynamics, enhancing transparency and reducing processing times. Shifting consumer behavior towards digital platforms and a growing preference for seamless cross-border transactions further contribute to this growth. Market penetration is expected to increase from xx% in 2024 to xx% in 2033.
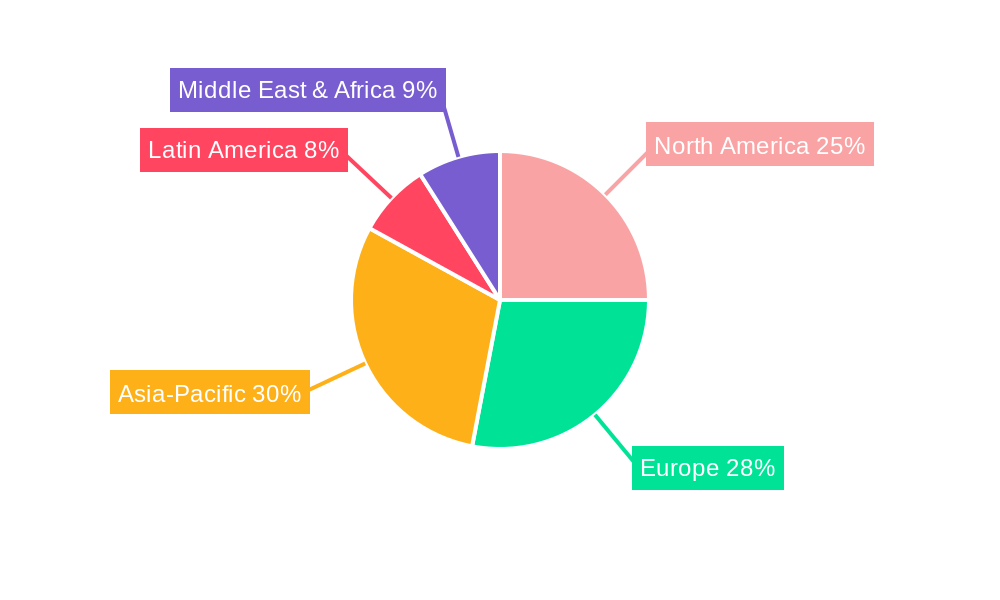
Dominant Regions, Countries, or Segments in Trade Finance Industry
North America and Europe continue to dominate the global trade finance market, accounting for approximately xx% of the total market share in 2024. However, the Asia-Pacific region exhibits strong growth potential, driven by the rapid economic growth in countries like China and India. The supply chain finance segment is experiencing the fastest growth, owing to the rising demand for efficient and cost-effective financing solutions from SMEs.
- Key Drivers in North America and Europe: Well-established financial infrastructure, strong regulatory frameworks, and high trade volumes.
- Key Drivers in Asia-Pacific: Rapid economic growth, increasing trade activities, and rising adoption of digital solutions.
- Supply Chain Finance Growth: Fueled by increased demand from SMEs for working capital solutions.
- Market Share: North America and Europe xx%, Asia-Pacific xx%, Other regions xx%.
- Growth Potential: Asia-Pacific exhibits the highest growth potential.
Trade Finance Industry Product Landscape
Trade finance products are increasingly incorporating technological advancements. Solutions range from traditional Letters of Credit and Guarantees to more sophisticated Supply Chain Finance platforms leveraging blockchain and AI for improved efficiency, transparency, and risk management. These platforms offer unique selling propositions such as reduced processing times, automated document verification, and enhanced security features, directly addressing customer needs for speed and security.
Key Drivers, Barriers & Challenges in Trade Finance Industry
Key Drivers: Growth in global trade, increasing demand for supply chain finance solutions from SMEs, technological advancements in blockchain and AI, and supportive government policies promoting international trade.
Key Challenges: Stringent regulatory compliance requirements increase operational costs. Cybersecurity threats pose a significant risk to data security and operational integrity. Geopolitical uncertainty and global economic volatility can impact trade volumes and credit risk. Competition from Fintech companies and alternative financing solutions is intensifying.
Emerging Opportunities in Trade Finance Industry
Untapped markets in emerging economies offer significant growth potential. The increasing adoption of digital technologies like blockchain offers opportunities for innovation in areas such as trade finance automation and improved transparency. Growing demand for sustainable finance initiatives creates opportunities for developing green trade finance products.
Growth Accelerators in the Trade Finance Industry
Technological advancements like AI and blockchain, strategic partnerships between traditional banks and Fintech companies, and expanding into underserved markets, particularly in emerging economies, are key growth catalysts.
Key Players Shaping the Trade Finance Industry Market
Notable Milestones in Trade Finance Industry Sector
- September 2023: Standard Chartered Bank launched a sustainable trade loan offering for financial institutions.
- April 2022: The Asian Development Bank signed a deal with Axis Bank Limited worth up to USD 150 Million to expand supply chain financing for SMEs.
In-Depth Trade Finance Industry Market Outlook
The future of the trade finance industry is bright, driven by the continued growth of global trade, increasing digitization, and the growing demand for innovative and sustainable finance solutions. Strategic partnerships, technological advancements, and expansion into emerging markets will be crucial for sustained growth and success in this dynamic sector. The market is poised for considerable expansion, presenting significant opportunities for both established players and new entrants.
Trade Finance Industry Segmentation
-
1. Service Provider
- 1.1. Banks
- 1.2. Trade Finance Companies
- 1.3. Insurance Companies
Trade Finance Industry Segmentation By Geography
-
1. North America
- 1.1. US
- 1.2. Canada
- 1.3. Mexico
- 1.4. Rest of North America
-
2. Europe
- 2.1. Germany
- 2.2. UK
- 2.3. France
- 2.4. Russia
- 2.5. Spain
- 2.6. Rest of Europe
-
3. Asia Pacific
- 3.1. India
- 3.2. China
- 3.3. Japan
- 3.4. Rest of Asia Pacific
-
4. South America
- 4.1. Brazil
- 4.2. Argentina
-
5. Middle East And Africa
- 5.1. UAE
- 5.2. Saudi Arabia
- 5.3. Rest of Middle East And Africa
Trade Finance Industry Regional Market Share
Geographic Coverage of Trade Finance Industry
Trade Finance Industry REPORT HIGHLIGHTS
| Aspects | Details |
|---|---|
| Study Period | 2020-2034 |
| Base Year | 2025 |
| Estimated Year | 2026 |
| Forecast Period | 2026-2034 |
| Historical Period | 2020-2025 |
| Growth Rate | CAGR of 4.24% from 2020-2034 |
| Segmentation |
|
Table of Contents
- 1. Introduction
- 1.1. Research Scope
- 1.2. Market Segmentation
- 1.3. Research Objective
- 1.4. Definitions and Assumptions
- 2. Executive Summary
- 2.1. Market Snapshot
- 3. Market Dynamics
- 3.1. Market Drivers
- 3.2. Market Restrains
- 3.3. Market Trends
- 3.4. Market Opportunities
- 4. Market Factor Analysis
- 4.1. Porters Five Forces
- 4.1.1. Bargaining Power of Suppliers
- 4.1.2. Bargaining Power of Buyers
- 4.1.3. Threat of New Entrants
- 4.1.4. Threat of Substitutes
- 4.1.5. Competitive Rivalry
- 4.2. PESTEL analysis
- 4.3. BCG Analysis
- 4.3.1. Stars (High Growth, High Market Share)
- 4.3.2. Cash Cows (Low Growth, High Market Share)
- 4.3.3. Question Mark (High Growth, Low Market Share)
- 4.3.4. Dogs (Low Growth, Low Market Share)
- 4.4. Ansoff Matrix Analysis
- 4.5. Supply Chain Analysis
- 4.6. Regulatory Landscape
- 4.7. Current Market Potential and Opportunity Assessment (TAM–SAM–SOM Framework)
- 4.8. IMR Analyst Note
- 4.1. Porters Five Forces
- 5. Market Analysis, Insights and Forecast 2021-2033
- 5.1. Market Analysis, Insights and Forecast - by Service Provider
- 5.1.1. Banks
- 5.1.2. Trade Finance Companies
- 5.1.3. Insurance Companies
- 5.2. Market Analysis, Insights and Forecast - by Region
- 5.2.1. North America
- 5.2.2. Europe
- 5.2.3. Asia Pacific
- 5.2.4. South America
- 5.2.5. Middle East And Africa
- 5.1. Market Analysis, Insights and Forecast - by Service Provider
- 6. Global Trade Finance Industry Analysis, Insights and Forecast, 2021-2033
- 6.1. Market Analysis, Insights and Forecast - by Service Provider
- 6.1.1. Banks
- 6.1.2. Trade Finance Companies
- 6.1.3. Insurance Companies
- 6.1. Market Analysis, Insights and Forecast - by Service Provider
- 7. North America Trade Finance Industry Analysis, Insights and Forecast, 2020-2032
- 7.1. Market Analysis, Insights and Forecast - by Service Provider
- 7.1.1. Banks
- 7.1.2. Trade Finance Companies
- 7.1.3. Insurance Companies
- 7.1. Market Analysis, Insights and Forecast - by Service Provider
- 8. Europe Trade Finance Industry Analysis, Insights and Forecast, 2020-2032
- 8.1. Market Analysis, Insights and Forecast - by Service Provider
- 8.1.1. Banks
- 8.1.2. Trade Finance Companies
- 8.1.3. Insurance Companies
- 8.1. Market Analysis, Insights and Forecast - by Service Provider
- 9. Asia Pacific Trade Finance Industry Analysis, Insights and Forecast, 2020-2032
- 9.1. Market Analysis, Insights and Forecast - by Service Provider
- 9.1.1. Banks
- 9.1.2. Trade Finance Companies
- 9.1.3. Insurance Companies
- 9.1. Market Analysis, Insights and Forecast - by Service Provider
- 10. South America Trade Finance Industry Analysis, Insights and Forecast, 2020-2032
- 10.1. Market Analysis, Insights and Forecast - by Service Provider
- 10.1.1. Banks
- 10.1.2. Trade Finance Companies
- 10.1.3. Insurance Companies
- 10.1. Market Analysis, Insights and Forecast - by Service Provider
- 11. Middle East And Africa Trade Finance Industry Analysis, Insights and Forecast, 2020-2032
- 11.1. Market Analysis, Insights and Forecast - by Service Provider
- 11.1.1. Banks
- 11.1.2. Trade Finance Companies
- 11.1.3. Insurance Companies
- 11.1. Market Analysis, Insights and Forecast - by Service Provider
- 12. Competitive Analysis
- 12.1. Company Profiles
- 12.1.1 Citi group Inc
- 12.1.1.1. Company Overview
- 12.1.1.2. Products
- 12.1.1.3. Company Financials
- 12.1.1.4. SWOT Analysis
- 12.1.2 Santander Bank
- 12.1.2.1. Company Overview
- 12.1.2.2. Products
- 12.1.2.3. Company Financials
- 12.1.2.4. SWOT Analysis
- 12.1.3 Scotiabank
- 12.1.3.1. Company Overview
- 12.1.3.2. Products
- 12.1.3.3. Company Financials
- 12.1.3.4. SWOT Analysis
- 12.1.4 Commerzbank
- 12.1.4.1. Company Overview
- 12.1.4.2. Products
- 12.1.4.3. Company Financials
- 12.1.4.4. SWOT Analysis
- 12.1.5 Nordea Group
- 12.1.5.1. Company Overview
- 12.1.5.2. Products
- 12.1.5.3. Company Financials
- 12.1.5.4. SWOT Analysis
- 12.1.6 Unicredit
- 12.1.6.1. Company Overview
- 12.1.6.2. Products
- 12.1.6.3. Company Financials
- 12.1.6.4. SWOT Analysis
- 12.1.7 Standard Chartered Bank
- 12.1.7.1. Company Overview
- 12.1.7.2. Products
- 12.1.7.3. Company Financials
- 12.1.7.4. SWOT Analysis
- 12.1.8 Arab Bank
- 12.1.8.1. Company Overview
- 12.1.8.2. Products
- 12.1.8.3. Company Financials
- 12.1.8.4. SWOT Analysis
- 12.1.9 Societe Generale
- 12.1.9.1. Company Overview
- 12.1.9.2. Products
- 12.1.9.3. Company Financials
- 12.1.9.4. SWOT Analysis
- 12.1.10 Rand Merchant Bank
- 12.1.10.1. Company Overview
- 12.1.10.2. Products
- 12.1.10.3. Company Financials
- 12.1.10.4. SWOT Analysis
- 12.1.11 Rabobank
- 12.1.11.1. Company Overview
- 12.1.11.2. Products
- 12.1.11.3. Company Financials
- 12.1.11.4. SWOT Analysis
- 12.1.12 China Construction Bank
- 12.1.12.1. Company Overview
- 12.1.12.2. Products
- 12.1.12.3. Company Financials
- 12.1.12.4. SWOT Analysis
- 12.1.13 BNP Paribas**List Not Exhaustive
- 12.1.13.1. Company Overview
- 12.1.13.2. Products
- 12.1.13.3. Company Financials
- 12.1.13.4. SWOT Analysis
- 12.1.1 Citi group Inc
- 12.2. Market Entropy
- 12.2.1 Company's Key Areas Served
- 12.2.2 Recent Developments
- 12.3. Company Market Share Analysis 2025
- 12.3.1 Top 5 Companies Market Share Analysis
- 12.3.2 Top 3 Companies Market Share Analysis
- 12.4. List of Potential Customers
- 13. Research Methodology
List of Figures
- Figure 1: Global Trade Finance Industry Revenue Breakdown (Million, %) by Region 2025 & 2033
- Figure 2: Global Trade Finance Industry Volume Breakdown (Billion, %) by Region 2025 & 2033
- Figure 3: North America Trade Finance Industry Revenue (Million), by Service Provider 2025 & 2033
- Figure 4: North America Trade Finance Industry Volume (Billion), by Service Provider 2025 & 2033
- Figure 5: North America Trade Finance Industry Revenue Share (%), by Service Provider 2025 & 2033
- Figure 6: North America Trade Finance Industry Volume Share (%), by Service Provider 2025 & 2033
- Figure 7: North America Trade Finance Industry Revenue (Million), by Country 2025 & 2033
- Figure 8: North America Trade Finance Industry Volume (Billion), by Country 2025 & 2033
- Figure 9: North America Trade Finance Industry Revenue Share (%), by Country 2025 & 2033
- Figure 10: North America Trade Finance Industry Volume Share (%), by Country 2025 & 2033
- Figure 11: Europe Trade Finance Industry Revenue (Million), by Service Provider 2025 & 2033
- Figure 12: Europe Trade Finance Industry Volume (Billion), by Service Provider 2025 & 2033
- Figure 13: Europe Trade Finance Industry Revenue Share (%), by Service Provider 2025 & 2033
- Figure 14: Europe Trade Finance Industry Volume Share (%), by Service Provider 2025 & 2033
- Figure 15: Europe Trade Finance Industry Revenue (Million), by Country 2025 & 2033
- Figure 16: Europe Trade Finance Industry Volume (Billion), by Country 2025 & 2033
- Figure 17: Europe Trade Finance Industry Revenue Share (%), by Country 2025 & 2033
- Figure 18: Europe Trade Finance Industry Volume Share (%), by Country 2025 & 2033
- Figure 19: Asia Pacific Trade Finance Industry Revenue (Million), by Service Provider 2025 & 2033
- Figure 20: Asia Pacific Trade Finance Industry Volume (Billion), by Service Provider 2025 & 2033
- Figure 21: Asia Pacific Trade Finance Industry Revenue Share (%), by Service Provider 2025 & 2033
- Figure 22: Asia Pacific Trade Finance Industry Volume Share (%), by Service Provider 2025 & 2033
- Figure 23: Asia Pacific Trade Finance Industry Revenue (Million), by Country 2025 & 2033
- Figure 24: Asia Pacific Trade Finance Industry Volume (Billion), by Country 2025 & 2033
- Figure 25: Asia Pacific Trade Finance Industry Revenue Share (%), by Country 2025 & 2033
- Figure 26: Asia Pacific Trade Finance Industry Volume Share (%), by Country 2025 & 2033
- Figure 27: South America Trade Finance Industry Revenue (Million), by Service Provider 2025 & 2033
- Figure 28: South America Trade Finance Industry Volume (Billion), by Service Provider 2025 & 2033
- Figure 29: South America Trade Finance Industry Revenue Share (%), by Service Provider 2025 & 2033
- Figure 30: South America Trade Finance Industry Volume Share (%), by Service Provider 2025 & 2033
- Figure 31: South America Trade Finance Industry Revenue (Million), by Country 2025 & 2033
- Figure 32: South America Trade Finance Industry Volume (Billion), by Country 2025 & 2033
- Figure 33: South America Trade Finance Industry Revenue Share (%), by Country 2025 & 2033
- Figure 34: South America Trade Finance Industry Volume Share (%), by Country 2025 & 2033
- Figure 35: Middle East And Africa Trade Finance Industry Revenue (Million), by Service Provider 2025 & 2033
- Figure 36: Middle East And Africa Trade Finance Industry Volume (Billion), by Service Provider 2025 & 2033
- Figure 37: Middle East And Africa Trade Finance Industry Revenue Share (%), by Service Provider 2025 & 2033
- Figure 38: Middle East And Africa Trade Finance Industry Volume Share (%), by Service Provider 2025 & 2033
- Figure 39: Middle East And Africa Trade Finance Industry Revenue (Million), by Country 2025 & 2033
- Figure 40: Middle East And Africa Trade Finance Industry Volume (Billion), by Country 2025 & 2033
- Figure 41: Middle East And Africa Trade Finance Industry Revenue Share (%), by Country 2025 & 2033
- Figure 42: Middle East And Africa Trade Finance Industry Volume Share (%), by Country 2025 & 2033
List of Tables
- Table 1: Global Trade Finance Industry Revenue Million Forecast, by Service Provider 2020 & 2033
- Table 2: Global Trade Finance Industry Volume Billion Forecast, by Service Provider 2020 & 2033
- Table 3: Global Trade Finance Industry Revenue Million Forecast, by Region 2020 & 2033
- Table 4: Global Trade Finance Industry Volume Billion Forecast, by Region 2020 & 2033
- Table 5: Global Trade Finance Industry Revenue Million Forecast, by Service Provider 2020 & 2033
- Table 6: Global Trade Finance Industry Volume Billion Forecast, by Service Provider 2020 & 2033
- Table 7: Global Trade Finance Industry Revenue Million Forecast, by Country 2020 & 2033
- Table 8: Global Trade Finance Industry Volume Billion Forecast, by Country 2020 & 2033
- Table 9: US Trade Finance Industry Revenue (Million) Forecast, by Application 2020 & 2033
- Table 10: US Trade Finance Industry Volume (Billion) Forecast, by Application 2020 & 2033
- Table 11: Canada Trade Finance Industry Revenue (Million) Forecast, by Application 2020 & 2033
- Table 12: Canada Trade Finance Industry Volume (Billion) Forecast, by Application 2020 & 2033
- Table 13: Mexico Trade Finance Industry Revenue (Million) Forecast, by Application 2020 & 2033
- Table 14: Mexico Trade Finance Industry Volume (Billion) Forecast, by Application 2020 & 2033
- Table 15: Rest of North America Trade Finance Industry Revenue (Million) Forecast, by Application 2020 & 2033
- Table 16: Rest of North America Trade Finance Industry Volume (Billion) Forecast, by Application 2020 & 2033
- Table 17: Global Trade Finance Industry Revenue Million Forecast, by Service Provider 2020 & 2033
- Table 18: Global Trade Finance Industry Volume Billion Forecast, by Service Provider 2020 & 2033
- Table 19: Global Trade Finance Industry Revenue Million Forecast, by Country 2020 & 2033
- Table 20: Global Trade Finance Industry Volume Billion Forecast, by Country 2020 & 2033
- Table 21: Germany Trade Finance Industry Revenue (Million) Forecast, by Application 2020 & 2033
- Table 22: Germany Trade Finance Industry Volume (Billion) Forecast, by Application 2020 & 2033
- Table 23: UK Trade Finance Industry Revenue (Million) Forecast, by Application 2020 & 2033
- Table 24: UK Trade Finance Industry Volume (Billion) Forecast, by Application 2020 & 2033
- Table 25: France Trade Finance Industry Revenue (Million) Forecast, by Application 2020 & 2033
- Table 26: France Trade Finance Industry Volume (Billion) Forecast, by Application 2020 & 2033
- Table 27: Russia Trade Finance Industry Revenue (Million) Forecast, by Application 2020 & 2033
- Table 28: Russia Trade Finance Industry Volume (Billion) Forecast, by Application 2020 & 2033
- Table 29: Spain Trade Finance Industry Revenue (Million) Forecast, by Application 2020 & 2033
- Table 30: Spain Trade Finance Industry Volume (Billion) Forecast, by Application 2020 & 2033
- Table 31: Rest of Europe Trade Finance Industry Revenue (Million) Forecast, by Application 2020 & 2033
- Table 32: Rest of Europe Trade Finance Industry Volume (Billion) Forecast, by Application 2020 & 2033
- Table 33: Global Trade Finance Industry Revenue Million Forecast, by Service Provider 2020 & 2033
- Table 34: Global Trade Finance Industry Volume Billion Forecast, by Service Provider 2020 & 2033
- Table 35: Global Trade Finance Industry Revenue Million Forecast, by Country 2020 & 2033
- Table 36: Global Trade Finance Industry Volume Billion Forecast, by Country 2020 & 2033
- Table 37: India Trade Finance Industry Revenue (Million) Forecast, by Application 2020 & 2033
- Table 38: India Trade Finance Industry Volume (Billion) Forecast, by Application 2020 & 2033
- Table 39: China Trade Finance Industry Revenue (Million) Forecast, by Application 2020 & 2033
- Table 40: China Trade Finance Industry Volume (Billion) Forecast, by Application 2020 & 2033
- Table 41: Japan Trade Finance Industry Revenue (Million) Forecast, by Application 2020 & 2033
- Table 42: Japan Trade Finance Industry Volume (Billion) Forecast, by Application 2020 & 2033
- Table 43: Rest of Asia Pacific Trade Finance Industry Revenue (Million) Forecast, by Application 2020 & 2033
- Table 44: Rest of Asia Pacific Trade Finance Industry Volume (Billion) Forecast, by Application 2020 & 2033
- Table 45: Global Trade Finance Industry Revenue Million Forecast, by Service Provider 2020 & 2033
- Table 46: Global Trade Finance Industry Volume Billion Forecast, by Service Provider 2020 & 2033
- Table 47: Global Trade Finance Industry Revenue Million Forecast, by Country 2020 & 2033
- Table 48: Global Trade Finance Industry Volume Billion Forecast, by Country 2020 & 2033
- Table 49: Brazil Trade Finance Industry Revenue (Million) Forecast, by Application 2020 & 2033
- Table 50: Brazil Trade Finance Industry Volume (Billion) Forecast, by Application 2020 & 2033
- Table 51: Argentina Trade Finance Industry Revenue (Million) Forecast, by Application 2020 & 2033
- Table 52: Argentina Trade Finance Industry Volume (Billion) Forecast, by Application 2020 & 2033
- Table 53: Global Trade Finance Industry Revenue Million Forecast, by Service Provider 2020 & 2033
- Table 54: Global Trade Finance Industry Volume Billion Forecast, by Service Provider 2020 & 2033
- Table 55: Global Trade Finance Industry Revenue Million Forecast, by Country 2020 & 2033
- Table 56: Global Trade Finance Industry Volume Billion Forecast, by Country 2020 & 2033
- Table 57: UAE Trade Finance Industry Revenue (Million) Forecast, by Application 2020 & 2033
- Table 58: UAE Trade Finance Industry Volume (Billion) Forecast, by Application 2020 & 2033
- Table 59: Saudi Arabia Trade Finance Industry Revenue (Million) Forecast, by Application 2020 & 2033
- Table 60: Saudi Arabia Trade Finance Industry Volume (Billion) Forecast, by Application 2020 & 2033
- Table 61: Rest of Middle East And Africa Trade Finance Industry Revenue (Million) Forecast, by Application 2020 & 2033
- Table 62: Rest of Middle East And Africa Trade Finance Industry Volume (Billion) Forecast, by Application 2020 & 2033
Frequently Asked Questions
1. What is the projected Compound Annual Growth Rate (CAGR) of the Trade Finance Industry?
The projected CAGR is approximately 4.24%.
2. Which companies are prominent players in the Trade Finance Industry?
Key companies in the market include Citi group Inc, Santander Bank, Scotiabank, Commerzbank, Nordea Group, Unicredit, Standard Chartered Bank, Arab Bank, Societe Generale, Rand Merchant Bank, Rabobank, China Construction Bank, BNP Paribas**List Not Exhaustive.
3. What are the main segments of the Trade Finance Industry?
The market segments include Service Provider.
4. Can you provide details about the market size?
The market size is estimated to be USD 65.69 Million as of 2022.
5. What are some drivers contributing to market growth?
Rise In Global Trade Drives The Market; Increasing Investments And Innovations In Fintech Drives The Market.
6. What are the notable trends driving market growth?
Globalization And Increased International Trade Drives the Market.
7. Are there any restraints impacting market growth?
Rise In Global Trade Drives The Market; Increasing Investments And Innovations In Fintech Drives The Market.
8. Can you provide examples of recent developments in the market?
September 2023 - Standard Chartered Bank, a multinational bank, launched a sustainable trade loan offering for financial institutions. It will assist financial institutions in providing liquidity associated with sustainable development in the most needed areas.
9. What pricing options are available for accessing the report?
Pricing options include single-user, multi-user, and enterprise licenses priced at USD 4750, USD 5250, and USD 8750 respectively.
10. Is the market size provided in terms of value or volume?
The market size is provided in terms of value, measured in Million and volume, measured in Billion.
11. Are there any specific market keywords associated with the report?
Yes, the market keyword associated with the report is "Trade Finance Industry," which aids in identifying and referencing the specific market segment covered.
12. How do I determine which pricing option suits my needs best?
The pricing options vary based on user requirements and access needs. Individual users may opt for single-user licenses, while businesses requiring broader access may choose multi-user or enterprise licenses for cost-effective access to the report.
13. Are there any additional resources or data provided in the Trade Finance Industry report?
While the report offers comprehensive insights, it's advisable to review the specific contents or supplementary materials provided to ascertain if additional resources or data are available.
14. How can I stay updated on further developments or reports in the Trade Finance Industry?
To stay informed about further developments, trends, and reports in the Trade Finance Industry, consider subscribing to industry newsletters, following relevant companies and organizations, or regularly checking reputable industry news sources and publications.
Methodology
Step 1 - Identification of Relevant Samples Size from Population Database


Step 2 - Approaches for Defining Global Market Size (Value, Volume* & Price*)

Note*: In applicable scenarios
Step 3 - Data Sources
Primary Research
- Web Analytics
- Survey Reports
- Research Institute
- Latest Research Reports
- Opinion Leaders
Secondary Research
- Annual Reports
- White Paper
- Latest Press Release
- Industry Association
- Paid Database
- Investor Presentations

Step 4 - Data Triangulation
Involves using different sources of information in order to increase the validity of a study
These sources are likely to be stakeholders in a program - participants, other researchers, program staff, other community members, and so on.
Then we put all data in single framework & apply various statistical tools to find out the dynamic on the market.
During the analysis stage, feedback from the stakeholder groups would be compared to determine areas of agreement as well as areas of divergence