

Key Insights
The US payment cards market is demonstrating significant expansion, driven by the growing adoption of digital payment solutions, the surge in e-commerce, and a heightened preference for contactless transactions. The market, projected to reach $6.48 billion in 2025, is anticipated to grow at a Compound Annual Growth Rate (CAGR) of 16.13% through 2033. Key growth drivers include increasing smartphone penetration and internet access, facilitating greater consumer adoption of online and mobile payments. The accelerating shift towards cashless transactions, supported by government initiatives and enhanced security measures, is further boosting demand for payment cards. Additionally, the burgeoning B2B sector's embrace of virtual cards for efficient expense management and improved security contributes substantially to market growth. Market segmentation reveals substantial opportunities across product types, including B2B virtual cards, B2C remote payment virtual cards, and B2C POS virtual cards, serving both consumer and business end-users. Leading market participants like Visa, Mastercard, and American Express, alongside emerging fintech innovators such as Stripe and Abine, are actively shaping the market through continuous innovation and competitive offerings.
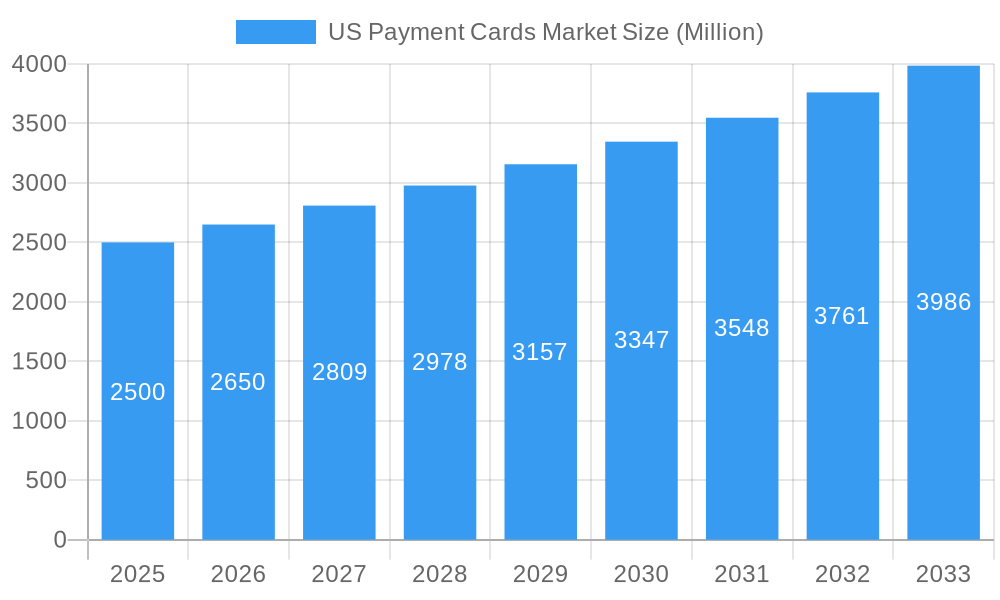
US Payment Cards Market Market Size (In Billion)
The competitive environment is characterized by dynamic evolution, with established players encountering increasing pressure from agile fintech companies. These new entrants are revolutionizing traditional payment methods with intuitive user interfaces, advanced security protocols, and reduced transaction costs. While regulatory shifts and potential security vulnerabilities present challenges, the overall outlook for the US payment cards market remains highly positive. Sustained growth will be contingent upon the continued integration of digital technologies, robust security frameworks to combat fraud, and further penetration into underserved market segments. A strategic focus on enhancing user experience, delivering personalized services, and leveraging data analytics will be paramount for market participants to achieve success in this competitive landscape. The ongoing expansion of e-commerce and the escalating trend of mobile payments will continue to propel the market's growth trajectory throughout the forecast period.
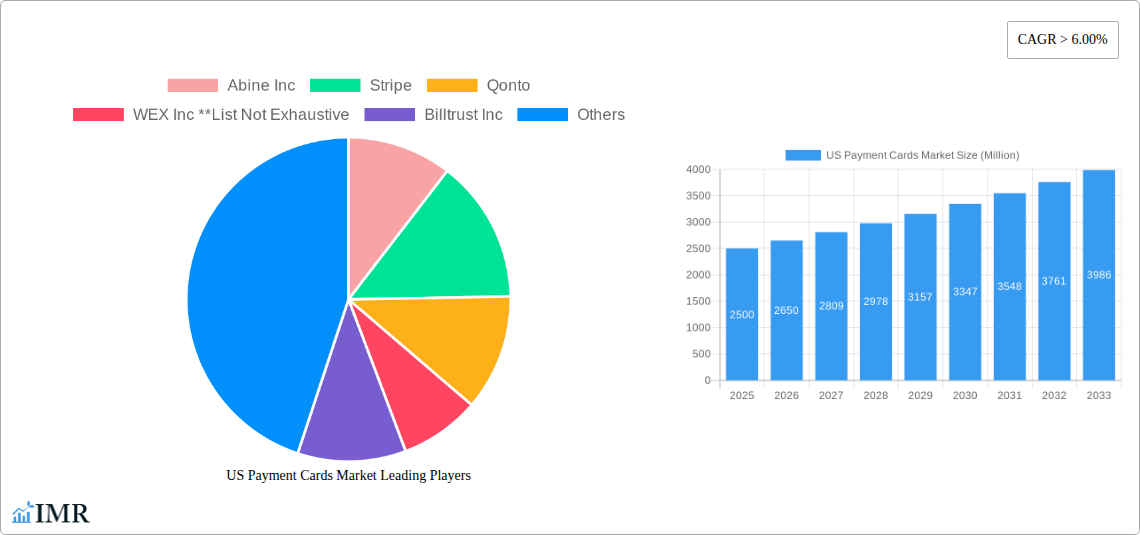
US Payment Cards Market Company Market Share
US Payment Cards Market: A Comprehensive Report (2019-2033)
This comprehensive report provides an in-depth analysis of the US Payment Cards Market, encompassing market dynamics, growth trends, key players, and future opportunities. The study covers the period from 2019 to 2033, with a focus on the base year 2025. This report segments the market by product type (B2B Virtual Cards, B2C Remote Payment Virtual Cards, B2C POS Virtual Cards) and end-user (Consumer Use, Business Use), offering granular insights into the evolving landscape. The market size is presented in million units.
US Payment Cards Market Dynamics & Structure
The US payment cards market is characterized by intense competition, rapid technological innovation, and evolving regulatory frameworks. Market concentration is relatively high, with major players such as Visa and American Express holding significant market share (xx%). However, the emergence of fintech companies and the increasing adoption of virtual cards are challenging the established players. The market is witnessing a surge in mergers and acquisitions (M&A) activity, with an estimated xx number of deals in the past five years. This signifies consolidation and strategic expansion within the sector.
- Market Concentration: High, with top players holding xx% market share (2025).
- Technological Innovation: Driven by advancements in mobile payments, contactless technology, and AI-powered fraud detection.
- Regulatory Framework: Subject to evolving regulations related to data privacy, security, and consumer protection.
- Competitive Product Substitutes: Digital wallets, peer-to-peer payment platforms, and buy now, pay later (BNPL) services.
- End-User Demographics: Shifting towards younger demographics embracing digital payment solutions.
- M&A Trends: Significant consolidation driven by strategic acquisitions and expansion into new market segments. An estimated xx M&A deals occurred between 2019 and 2024.
US Payment Cards Market Growth Trends & Insights
The US payment cards market is experiencing robust growth, driven by the increasing adoption of digital payment methods, the rise of e-commerce, and expanding smartphone penetration. The market size grew from xx million units in 2019 to xx million units in 2024, exhibiting a CAGR of xx% during this period. This upward trend is expected to continue throughout the forecast period (2025-2033), with the market size projected to reach xx million units by 2033 and a predicted CAGR of xx% from 2025 onwards. This growth is fueled by technological disruptions, such as the emergence of virtual cards and contactless payments, which are reshaping consumer behavior and payment preferences. Market penetration of digital payment methods is expected to reach xx% by 2033.
Dominant Regions, Countries, or Segments in US Payment Cards Market
The fastest-growing segment within the US payment cards market is B2C Remote Payment Virtual Cards, driven by the rise of e-commerce and online transactions. This segment is expected to maintain its dominance throughout the forecast period, accounting for xx% of the total market share by 2033. The Business Use segment is also experiencing rapid growth, fueled by the increasing adoption of B2B virtual cards for streamlined procurement and expense management. California and New York are the leading states in terms of market adoption, owing to high population density, advanced digital infrastructure, and a robust economy.
- Key Drivers for B2C Remote Payment Virtual Cards: Growth of e-commerce, increasing smartphone penetration, and consumer preference for contactless payments.
- Key Drivers for Business Use: Streamlined procurement processes, improved expense management, enhanced security, and reduced fraud risks.
- Dominant Regions: California and New York lead in market adoption due to high population density and robust digital infrastructure.
US Payment Cards Market Product Landscape
The US payment cards market showcases a diverse product landscape encompassing various types of physical and virtual cards catering to individual consumer and business needs. Innovations include advanced security features, contactless payment functionalities, and integrated rewards programs. The focus is on enhancing user experience, improving security, and offering personalized services. B2B virtual cards are gaining significant traction due to enhanced security, ease of reconciliation, and reduced administrative overhead.
Key Drivers, Barriers & Challenges in US Payment Cards Market
Key Drivers: The increasing prevalence of e-commerce, rising smartphone penetration, and the growing preference for cashless transactions are key drivers. Government initiatives promoting digital payments and advancements in payment technologies further fuel the market growth. The rise of BNPL solutions also contributes to the growth of digital payment adoption.
Key Challenges: Stringent regulatory compliance, cybersecurity threats, and the potential for fraud are significant hurdles. Maintaining consumer trust and addressing concerns regarding data privacy are crucial for sustained market growth.
Emerging Opportunities in US Payment Cards Market
Untapped markets in rural areas and underserved communities represent substantial opportunities. The integration of payment cards with emerging technologies such as the metaverse and blockchain is also poised for significant growth. Innovation in B2B virtual card solutions and increased adoption in sectors with high transaction volumes (e.g., healthcare, logistics) offer attractive growth avenues.
Growth Accelerators in the US Payment Cards Market Industry
Technological advancements in mobile payments, contactless technology, and biometrics are key growth catalysts. Strategic partnerships between payment providers and other industries will drive market penetration. Expansion into new markets and the development of innovative payment solutions tailored to specific customer needs will foster further growth.
Key Players Shaping the US Payment Cards Market Market
- Abine Inc
- Stripe
- Qonto
- WEX Inc
- Billtrust Inc
- JP Morgan Chase
- American Express
- Skrill
- VISA
- Vanguard
Notable Milestones in US Payment Cards Market Sector
- June 2022: Visa and Safaricom launched a virtual card enabling 30 million M-Pesa users to make global digital payments, including in the US.
- April 2022: American Express partnered with Billtrust to streamline virtual card acceptance for suppliers, enhancing B2B payment automation.
In-Depth US Payment Cards Market Market Outlook
The future of the US payment cards market is bright, driven by ongoing technological advancements, increasing digitalization, and evolving consumer preferences. Strategic partnerships and expansion into new markets will shape the industry landscape. The focus will continue to be on enhancing security, improving user experience, and offering innovative payment solutions to meet the evolving needs of consumers and businesses. The market is poised for significant growth, presenting lucrative opportunities for established players and emerging fintech companies alike.
US Payment Cards Market Segmentation
-
1. Product Type
- 1.1. B2B Virtual Cards
- 1.2. B2C Remote Payment Virtual Cards
- 1.3. B2C POS Virtual Cards
-
2. End-User
- 2.1. Consumer Use
- 2.2. Business Use
US Payment Cards Market Segmentation By Geography
-
1. North America
- 1.1. United States
- 1.2. Canada
- 1.3. Mexico
-
2. South America
- 2.1. Brazil
- 2.2. Argentina
- 2.3. Rest of South America
-
3. Europe
- 3.1. United Kingdom
- 3.2. Germany
- 3.3. France
- 3.4. Italy
- 3.5. Spain
- 3.6. Russia
- 3.7. Benelux
- 3.8. Nordics
- 3.9. Rest of Europe
-
4. Middle East & Africa
- 4.1. Turkey
- 4.2. Israel
- 4.3. GCC
- 4.4. North Africa
- 4.5. South Africa
- 4.6. Rest of Middle East & Africa
-
5. Asia Pacific
- 5.1. China
- 5.2. India
- 5.3. Japan
- 5.4. South Korea
- 5.5. ASEAN
- 5.6. Oceania
- 5.7. Rest of Asia Pacific
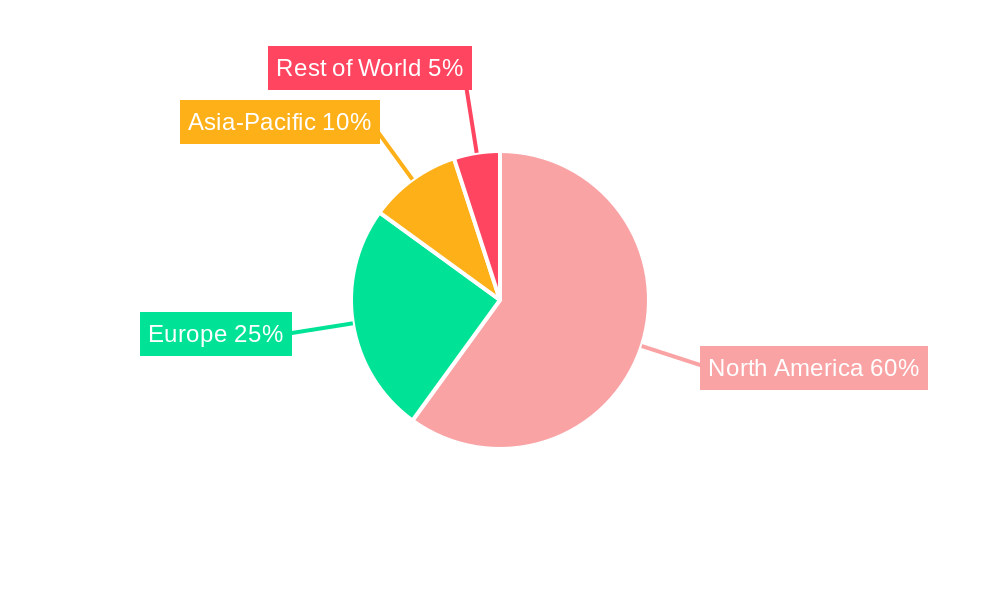
US Payment Cards Market Regional Market Share
Geographic Coverage of US Payment Cards Market
US Payment Cards Market REPORT HIGHLIGHTS
| Aspects | Details |
|---|---|
| Study Period | 2020-2034 |
| Base Year | 2025 |
| Estimated Year | 2026 |
| Forecast Period | 2026-2034 |
| Historical Period | 2020-2025 |
| Growth Rate | CAGR of 16.13% from 2020-2034 |
| Segmentation |
|
Table of Contents
- 1. Introduction
- 1.1. Research Scope
- 1.2. Market Segmentation
- 1.3. Research Objective
- 1.4. Definitions and Assumptions
- 2. Executive Summary
- 2.1. Market Snapshot
- 3. Market Dynamics
- 3.1. Market Drivers
- 3.2. Market Restrains
- 3.3. Market Trends
- 3.4. Market Opportunities
- 4. Market Factor Analysis
- 4.1. Porters Five Forces
- 4.1.1. Bargaining Power of Suppliers
- 4.1.2. Bargaining Power of Buyers
- 4.1.3. Threat of New Entrants
- 4.1.4. Threat of Substitutes
- 4.1.5. Competitive Rivalry
- 4.2. PESTEL analysis
- 4.3. BCG Analysis
- 4.3.1. Stars (High Growth, High Market Share)
- 4.3.2. Cash Cows (Low Growth, High Market Share)
- 4.3.3. Question Mark (High Growth, Low Market Share)
- 4.3.4. Dogs (Low Growth, Low Market Share)
- 4.4. Ansoff Matrix Analysis
- 4.5. Supply Chain Analysis
- 4.6. Regulatory Landscape
- 4.7. Current Market Potential and Opportunity Assessment (TAM–SAM–SOM Framework)
- 4.8. IMR Analyst Note
- 4.1. Porters Five Forces
- 5. Market Analysis, Insights and Forecast 2021-2033
- 5.1. Market Analysis, Insights and Forecast - by Product Type
- 5.1.1. B2B Virtual Cards
- 5.1.2. B2C Remote Payment Virtual Cards
- 5.1.3. B2C POS Virtual Cards
- 5.2. Market Analysis, Insights and Forecast - by End-User
- 5.2.1. Consumer Use
- 5.2.2. Business Use
- 5.3. Market Analysis, Insights and Forecast - by Region
- 5.3.1. North America
- 5.3.2. South America
- 5.3.3. Europe
- 5.3.4. Middle East & Africa
- 5.3.5. Asia Pacific
- 5.1. Market Analysis, Insights and Forecast - by Product Type
- 6. Global US Payment Cards Market Analysis, Insights and Forecast, 2021-2033
- 6.1. Market Analysis, Insights and Forecast - by Product Type
- 6.1.1. B2B Virtual Cards
- 6.1.2. B2C Remote Payment Virtual Cards
- 6.1.3. B2C POS Virtual Cards
- 6.2. Market Analysis, Insights and Forecast - by End-User
- 6.2.1. Consumer Use
- 6.2.2. Business Use
- 6.1. Market Analysis, Insights and Forecast - by Product Type
- 7. North America US Payment Cards Market Analysis, Insights and Forecast, 2020-2032
- 7.1. Market Analysis, Insights and Forecast - by Product Type
- 7.1.1. B2B Virtual Cards
- 7.1.2. B2C Remote Payment Virtual Cards
- 7.1.3. B2C POS Virtual Cards
- 7.2. Market Analysis, Insights and Forecast - by End-User
- 7.2.1. Consumer Use
- 7.2.2. Business Use
- 7.1. Market Analysis, Insights and Forecast - by Product Type
- 8. South America US Payment Cards Market Analysis, Insights and Forecast, 2020-2032
- 8.1. Market Analysis, Insights and Forecast - by Product Type
- 8.1.1. B2B Virtual Cards
- 8.1.2. B2C Remote Payment Virtual Cards
- 8.1.3. B2C POS Virtual Cards
- 8.2. Market Analysis, Insights and Forecast - by End-User
- 8.2.1. Consumer Use
- 8.2.2. Business Use
- 8.1. Market Analysis, Insights and Forecast - by Product Type
- 9. Europe US Payment Cards Market Analysis, Insights and Forecast, 2020-2032
- 9.1. Market Analysis, Insights and Forecast - by Product Type
- 9.1.1. B2B Virtual Cards
- 9.1.2. B2C Remote Payment Virtual Cards
- 9.1.3. B2C POS Virtual Cards
- 9.2. Market Analysis, Insights and Forecast - by End-User
- 9.2.1. Consumer Use
- 9.2.2. Business Use
- 9.1. Market Analysis, Insights and Forecast - by Product Type
- 10. Middle East & Africa US Payment Cards Market Analysis, Insights and Forecast, 2020-2032
- 10.1. Market Analysis, Insights and Forecast - by Product Type
- 10.1.1. B2B Virtual Cards
- 10.1.2. B2C Remote Payment Virtual Cards
- 10.1.3. B2C POS Virtual Cards
- 10.2. Market Analysis, Insights and Forecast - by End-User
- 10.2.1. Consumer Use
- 10.2.2. Business Use
- 10.1. Market Analysis, Insights and Forecast - by Product Type
- 11. Asia Pacific US Payment Cards Market Analysis, Insights and Forecast, 2020-2032
- 11.1. Market Analysis, Insights and Forecast - by Product Type
- 11.1.1. B2B Virtual Cards
- 11.1.2. B2C Remote Payment Virtual Cards
- 11.1.3. B2C POS Virtual Cards
- 11.2. Market Analysis, Insights and Forecast - by End-User
- 11.2.1. Consumer Use
- 11.2.2. Business Use
- 11.1. Market Analysis, Insights and Forecast - by Product Type
- 12. Competitive Analysis
- 12.1. Company Profiles
- 12.1.1 Abine Inc
- 12.1.1.1. Company Overview
- 12.1.1.2. Products
- 12.1.1.3. Company Financials
- 12.1.1.4. SWOT Analysis
- 12.1.2 Stripe
- 12.1.2.1. Company Overview
- 12.1.2.2. Products
- 12.1.2.3. Company Financials
- 12.1.2.4. SWOT Analysis
- 12.1.3 Qonto
- 12.1.3.1. Company Overview
- 12.1.3.2. Products
- 12.1.3.3. Company Financials
- 12.1.3.4. SWOT Analysis
- 12.1.4 WEX Inc **List Not Exhaustive
- 12.1.4.1. Company Overview
- 12.1.4.2. Products
- 12.1.4.3. Company Financials
- 12.1.4.4. SWOT Analysis
- 12.1.5 Billtrust Inc
- 12.1.5.1. Company Overview
- 12.1.5.2. Products
- 12.1.5.3. Company Financials
- 12.1.5.4. SWOT Analysis
- 12.1.6 JP Morgan Chase
- 12.1.6.1. Company Overview
- 12.1.6.2. Products
- 12.1.6.3. Company Financials
- 12.1.6.4. SWOT Analysis
- 12.1.7 American Express
- 12.1.7.1. Company Overview
- 12.1.7.2. Products
- 12.1.7.3. Company Financials
- 12.1.7.4. SWOT Analysis
- 12.1.8 Skrill
- 12.1.8.1. Company Overview
- 12.1.8.2. Products
- 12.1.8.3. Company Financials
- 12.1.8.4. SWOT Analysis
- 12.1.9 VISA
- 12.1.9.1. Company Overview
- 12.1.9.2. Products
- 12.1.9.3. Company Financials
- 12.1.9.4. SWOT Analysis
- 12.1.10 Vanguard
- 12.1.10.1. Company Overview
- 12.1.10.2. Products
- 12.1.10.3. Company Financials
- 12.1.10.4. SWOT Analysis
- 12.1.1 Abine Inc
- 12.2. Market Entropy
- 12.2.1 Company's Key Areas Served
- 12.2.2 Recent Developments
- 12.3. Company Market Share Analysis 2025
- 12.3.1 Top 5 Companies Market Share Analysis
- 12.3.2 Top 3 Companies Market Share Analysis
- 12.4. List of Potential Customers
- 13. Research Methodology
List of Figures
- Figure 1: Global US Payment Cards Market Revenue Breakdown (billion, %) by Region 2025 & 2033
- Figure 2: North America US Payment Cards Market Revenue (billion), by Product Type 2025 & 2033
- Figure 3: North America US Payment Cards Market Revenue Share (%), by Product Type 2025 & 2033
- Figure 4: North America US Payment Cards Market Revenue (billion), by End-User 2025 & 2033
- Figure 5: North America US Payment Cards Market Revenue Share (%), by End-User 2025 & 2033
- Figure 6: North America US Payment Cards Market Revenue (billion), by Country 2025 & 2033
- Figure 7: North America US Payment Cards Market Revenue Share (%), by Country 2025 & 2033
- Figure 8: South America US Payment Cards Market Revenue (billion), by Product Type 2025 & 2033
- Figure 9: South America US Payment Cards Market Revenue Share (%), by Product Type 2025 & 2033
- Figure 10: South America US Payment Cards Market Revenue (billion), by End-User 2025 & 2033
- Figure 11: South America US Payment Cards Market Revenue Share (%), by End-User 2025 & 2033
- Figure 12: South America US Payment Cards Market Revenue (billion), by Country 2025 & 2033
- Figure 13: South America US Payment Cards Market Revenue Share (%), by Country 2025 & 2033
- Figure 14: Europe US Payment Cards Market Revenue (billion), by Product Type 2025 & 2033
- Figure 15: Europe US Payment Cards Market Revenue Share (%), by Product Type 2025 & 2033
- Figure 16: Europe US Payment Cards Market Revenue (billion), by End-User 2025 & 2033
- Figure 17: Europe US Payment Cards Market Revenue Share (%), by End-User 2025 & 2033
- Figure 18: Europe US Payment Cards Market Revenue (billion), by Country 2025 & 2033
- Figure 19: Europe US Payment Cards Market Revenue Share (%), by Country 2025 & 2033
- Figure 20: Middle East & Africa US Payment Cards Market Revenue (billion), by Product Type 2025 & 2033
- Figure 21: Middle East & Africa US Payment Cards Market Revenue Share (%), by Product Type 2025 & 2033
- Figure 22: Middle East & Africa US Payment Cards Market Revenue (billion), by End-User 2025 & 2033
- Figure 23: Middle East & Africa US Payment Cards Market Revenue Share (%), by End-User 2025 & 2033
- Figure 24: Middle East & Africa US Payment Cards Market Revenue (billion), by Country 2025 & 2033
- Figure 25: Middle East & Africa US Payment Cards Market Revenue Share (%), by Country 2025 & 2033
- Figure 26: Asia Pacific US Payment Cards Market Revenue (billion), by Product Type 2025 & 2033
- Figure 27: Asia Pacific US Payment Cards Market Revenue Share (%), by Product Type 2025 & 2033
- Figure 28: Asia Pacific US Payment Cards Market Revenue (billion), by End-User 2025 & 2033
- Figure 29: Asia Pacific US Payment Cards Market Revenue Share (%), by End-User 2025 & 2033
- Figure 30: Asia Pacific US Payment Cards Market Revenue (billion), by Country 2025 & 2033
- Figure 31: Asia Pacific US Payment Cards Market Revenue Share (%), by Country 2025 & 2033
List of Tables
- Table 1: Global US Payment Cards Market Revenue billion Forecast, by Product Type 2020 & 2033
- Table 2: Global US Payment Cards Market Revenue billion Forecast, by End-User 2020 & 2033
- Table 3: Global US Payment Cards Market Revenue billion Forecast, by Region 2020 & 2033
- Table 4: Global US Payment Cards Market Revenue billion Forecast, by Product Type 2020 & 2033
- Table 5: Global US Payment Cards Market Revenue billion Forecast, by End-User 2020 & 2033
- Table 6: Global US Payment Cards Market Revenue billion Forecast, by Country 2020 & 2033
- Table 7: United States US Payment Cards Market Revenue (billion) Forecast, by Application 2020 & 2033
- Table 8: Canada US Payment Cards Market Revenue (billion) Forecast, by Application 2020 & 2033
- Table 9: Mexico US Payment Cards Market Revenue (billion) Forecast, by Application 2020 & 2033
- Table 10: Global US Payment Cards Market Revenue billion Forecast, by Product Type 2020 & 2033
- Table 11: Global US Payment Cards Market Revenue billion Forecast, by End-User 2020 & 2033
- Table 12: Global US Payment Cards Market Revenue billion Forecast, by Country 2020 & 2033
- Table 13: Brazil US Payment Cards Market Revenue (billion) Forecast, by Application 2020 & 2033
- Table 14: Argentina US Payment Cards Market Revenue (billion) Forecast, by Application 2020 & 2033
- Table 15: Rest of South America US Payment Cards Market Revenue (billion) Forecast, by Application 2020 & 2033
- Table 16: Global US Payment Cards Market Revenue billion Forecast, by Product Type 2020 & 2033
- Table 17: Global US Payment Cards Market Revenue billion Forecast, by End-User 2020 & 2033
- Table 18: Global US Payment Cards Market Revenue billion Forecast, by Country 2020 & 2033
- Table 19: United Kingdom US Payment Cards Market Revenue (billion) Forecast, by Application 2020 & 2033
- Table 20: Germany US Payment Cards Market Revenue (billion) Forecast, by Application 2020 & 2033
- Table 21: France US Payment Cards Market Revenue (billion) Forecast, by Application 2020 & 2033
- Table 22: Italy US Payment Cards Market Revenue (billion) Forecast, by Application 2020 & 2033
- Table 23: Spain US Payment Cards Market Revenue (billion) Forecast, by Application 2020 & 2033
- Table 24: Russia US Payment Cards Market Revenue (billion) Forecast, by Application 2020 & 2033
- Table 25: Benelux US Payment Cards Market Revenue (billion) Forecast, by Application 2020 & 2033
- Table 26: Nordics US Payment Cards Market Revenue (billion) Forecast, by Application 2020 & 2033
- Table 27: Rest of Europe US Payment Cards Market Revenue (billion) Forecast, by Application 2020 & 2033
- Table 28: Global US Payment Cards Market Revenue billion Forecast, by Product Type 2020 & 2033
- Table 29: Global US Payment Cards Market Revenue billion Forecast, by End-User 2020 & 2033
- Table 30: Global US Payment Cards Market Revenue billion Forecast, by Country 2020 & 2033
- Table 31: Turkey US Payment Cards Market Revenue (billion) Forecast, by Application 2020 & 2033
- Table 32: Israel US Payment Cards Market Revenue (billion) Forecast, by Application 2020 & 2033
- Table 33: GCC US Payment Cards Market Revenue (billion) Forecast, by Application 2020 & 2033
- Table 34: North Africa US Payment Cards Market Revenue (billion) Forecast, by Application 2020 & 2033
- Table 35: South Africa US Payment Cards Market Revenue (billion) Forecast, by Application 2020 & 2033
- Table 36: Rest of Middle East & Africa US Payment Cards Market Revenue (billion) Forecast, by Application 2020 & 2033
- Table 37: Global US Payment Cards Market Revenue billion Forecast, by Product Type 2020 & 2033
- Table 38: Global US Payment Cards Market Revenue billion Forecast, by End-User 2020 & 2033
- Table 39: Global US Payment Cards Market Revenue billion Forecast, by Country 2020 & 2033
- Table 40: China US Payment Cards Market Revenue (billion) Forecast, by Application 2020 & 2033
- Table 41: India US Payment Cards Market Revenue (billion) Forecast, by Application 2020 & 2033
- Table 42: Japan US Payment Cards Market Revenue (billion) Forecast, by Application 2020 & 2033
- Table 43: South Korea US Payment Cards Market Revenue (billion) Forecast, by Application 2020 & 2033
- Table 44: ASEAN US Payment Cards Market Revenue (billion) Forecast, by Application 2020 & 2033
- Table 45: Oceania US Payment Cards Market Revenue (billion) Forecast, by Application 2020 & 2033
- Table 46: Rest of Asia Pacific US Payment Cards Market Revenue (billion) Forecast, by Application 2020 & 2033
Frequently Asked Questions
1. What is the projected Compound Annual Growth Rate (CAGR) of the US Payment Cards Market?
The projected CAGR is approximately 16.13%.
2. Which companies are prominent players in the US Payment Cards Market?
Key companies in the market include Abine Inc, Stripe, Qonto, WEX Inc **List Not Exhaustive, Billtrust Inc, JP Morgan Chase, American Express, Skrill, VISA, Vanguard.
3. What are the main segments of the US Payment Cards Market?
The market segments include Product Type, End-User.
4. Can you provide details about the market size?
The market size is estimated to be USD 6.48 billion as of 2022.
5. What are some drivers contributing to market growth?
Usage of Credit Card give the bonus and reward points.
6. What are the notable trends driving market growth?
Increase in the Penetration of Internet in the USA.
7. Are there any restraints impacting market growth?
Interest rates on Credit Card.
8. Can you provide examples of recent developments in the market?
On June 2022, Global digital payments firm Visa and Safaricom, the operator of the M-Pesa mobile money product, have today launched a virtual card, enabling millions of M-Pesa users to make digital payments globally including the US region. The virtual card will enable 30 million M-Pesa users to make cashless payments at Visa's global network of merchants. Users can activate the virtual card through the M-Pesa mobile app or by USSD.
9. What pricing options are available for accessing the report?
Pricing options include single-user, multi-user, and enterprise licenses priced at USD 3800, USD 4500, and USD 5800 respectively.
10. Is the market size provided in terms of value or volume?
The market size is provided in terms of value, measured in billion.
11. Are there any specific market keywords associated with the report?
Yes, the market keyword associated with the report is "US Payment Cards Market," which aids in identifying and referencing the specific market segment covered.
12. How do I determine which pricing option suits my needs best?
The pricing options vary based on user requirements and access needs. Individual users may opt for single-user licenses, while businesses requiring broader access may choose multi-user or enterprise licenses for cost-effective access to the report.
13. Are there any additional resources or data provided in the US Payment Cards Market report?
While the report offers comprehensive insights, it's advisable to review the specific contents or supplementary materials provided to ascertain if additional resources or data are available.
14. How can I stay updated on further developments or reports in the US Payment Cards Market?
To stay informed about further developments, trends, and reports in the US Payment Cards Market, consider subscribing to industry newsletters, following relevant companies and organizations, or regularly checking reputable industry news sources and publications.
Methodology
Step 1 - Identification of Relevant Samples Size from Population Database


Step 2 - Approaches for Defining Global Market Size (Value, Volume* & Price*)

Note*: In applicable scenarios
Step 3 - Data Sources
Primary Research
- Web Analytics
- Survey Reports
- Research Institute
- Latest Research Reports
- Opinion Leaders
Secondary Research
- Annual Reports
- White Paper
- Latest Press Release
- Industry Association
- Paid Database
- Investor Presentations

Step 4 - Data Triangulation
Involves using different sources of information in order to increase the validity of a study
These sources are likely to be stakeholders in a program - participants, other researchers, program staff, other community members, and so on.
Then we put all data in single framework & apply various statistical tools to find out the dynamic on the market.
During the analysis stage, feedback from the stakeholder groups would be compared to determine areas of agreement as well as areas of divergence