

Key Insights
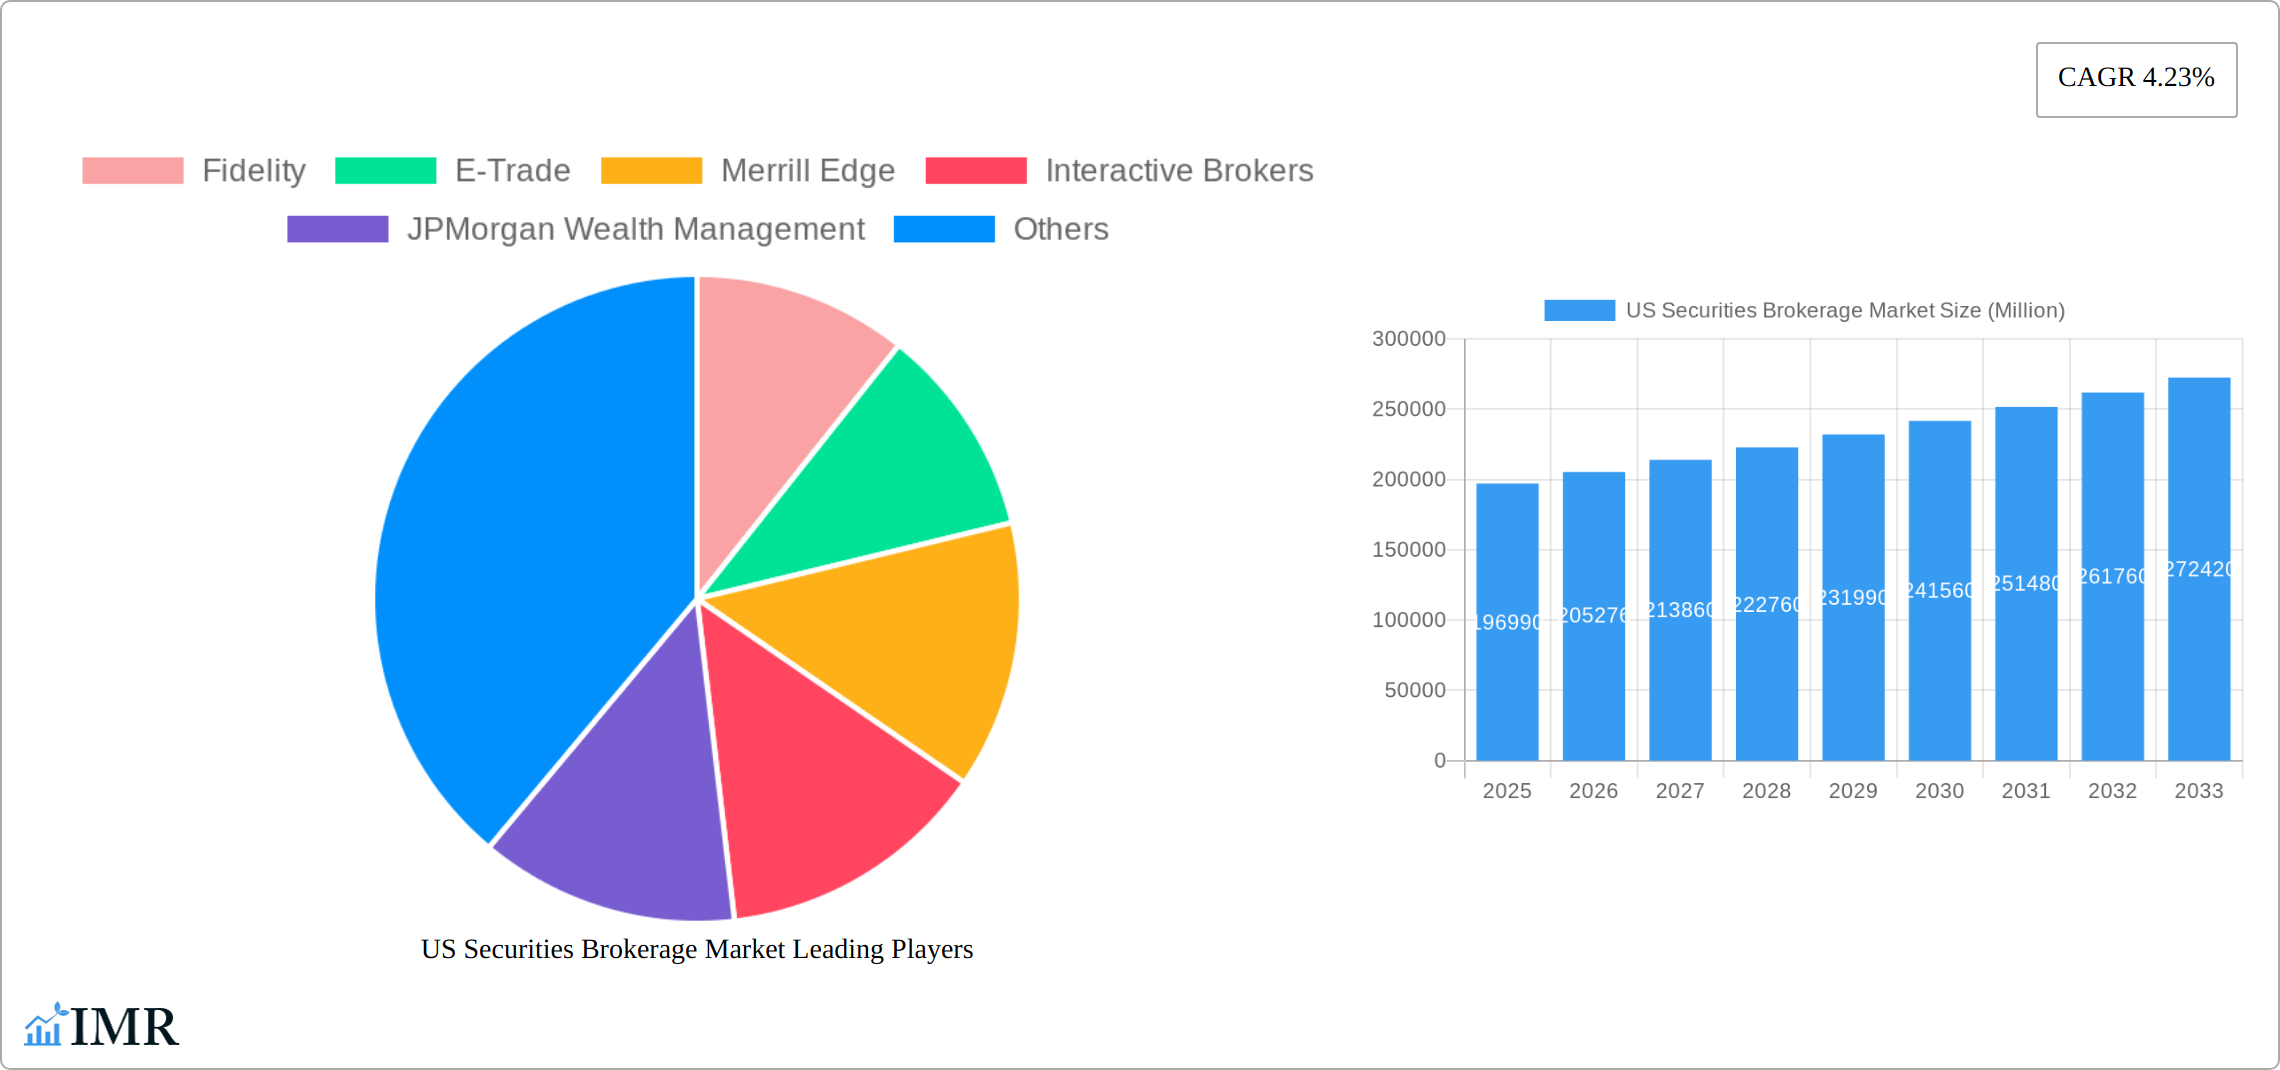
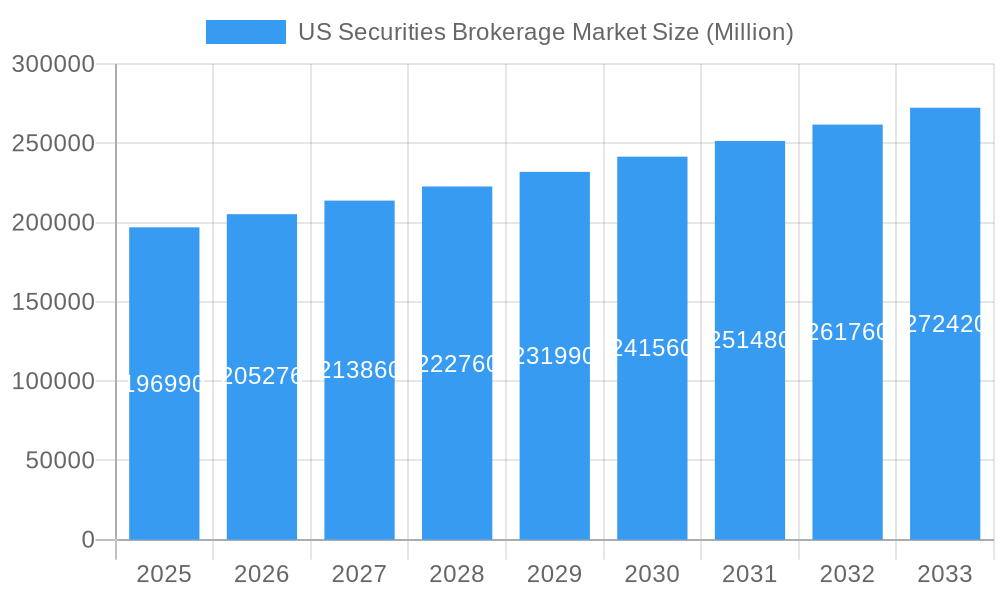
The US Securities Brokerage Market, valued at $196.99 billion in 2025, is projected to experience steady growth, driven by several key factors. Increased retail investor participation, fueled by the accessibility of online brokerage platforms and a growing interest in active trading and investing, is a significant driver. Technological advancements, including mobile trading apps and sophisticated algorithmic trading tools, are further enhancing market accessibility and efficiency. The market's expansion is also influenced by the rise of robo-advisors, offering automated portfolio management services at lower costs, appealing to both novice and seasoned investors. However, regulatory scrutiny and potential market volatility remain constraints. Competition amongst established players like Fidelity, Charles Schwab, and E-Trade, along with the emergence of disruptive fintech companies such as Robinhood and Webull, keeps pressure on pricing and service innovation. The market is segmented by service type (full-service, discount brokerage, robo-advisors), client type (individual, institutional), and technology used (web-based, mobile). The forecast period (2025-2033) anticipates continued growth, although the rate may fluctuate depending on macroeconomic conditions and evolving investor sentiment.
US Securities Brokerage Market Market Size (In Billion)
The projected Compound Annual Growth Rate (CAGR) of 4.23% suggests a gradual but consistent expansion. While the provided data lacks regional breakdowns, it's reasonable to assume that the majority of market activity concentrates within the US, reflecting the mature and robust nature of its capital markets. Future growth hinges on the adoption of innovative financial technologies, improvements in cybersecurity and data privacy, and the ability of brokerages to cater to the evolving needs of a diverse investor base. The consistent presence of major players indicates a degree of market stability, though the dynamic competitive landscape guarantees ongoing innovation and adaptation to sustain growth. The long-term outlook for the US Securities Brokerage Market appears positive, though subject to the inherent uncertainties of the financial sector.
US Securities Brokerage Market Company Market Share
US Securities Brokerage Market: A Comprehensive Market Report (2019-2033)
This in-depth report provides a comprehensive analysis of the US Securities Brokerage Market, encompassing market dynamics, growth trends, competitive landscape, and future outlook. The study period covers 2019-2033, with 2025 as the base and estimated year. This report is crucial for investors, industry professionals, and strategic decision-makers seeking a clear understanding of this dynamic market. The total market size in 2025 is estimated at xx Million.
Target Audience: Investors, financial analysts, brokerage firms, fintech companies, regulatory bodies, and market research professionals.
US Securities Brokerage Market Dynamics & Structure
The US securities brokerage market is characterized by a dynamic interplay of factors influencing its structure and growth trajectory. Market concentration is moderately high, with a few major players holding significant market share, but a multitude of smaller firms competing for niche segments. Technological innovation, particularly in areas like algorithmic trading, robo-advisors, and mobile trading platforms, is a major driver, constantly reshaping the competitive landscape. Regulatory frameworks, such as those imposed by the SEC, significantly impact operations and compliance. The market sees competitive pressure from product substitutes, like alternative investment platforms and direct-to-consumer offerings. End-user demographics are evolving, with increasing participation from millennials and Gen Z, influencing trading styles and technology preferences. M&A activity is relatively frequent, with larger firms acquiring smaller players to expand their market reach and product offerings.
- Market Concentration: Top 5 players hold approximately xx% of the market share in 2025.
- Technological Innovation: Adoption of AI, machine learning, and blockchain technology is driving efficiency and personalization.
- Regulatory Framework: SEC regulations on trading practices and investor protection are key considerations.
- M&A Activity: Average of xx M&A deals per year observed in the historical period (2019-2024).
- Innovation Barriers: High initial investment costs and regulatory compliance requirements pose challenges.
US Securities Brokerage Market Growth Trends & Insights
The US securities brokerage market experienced significant growth during the historical period (2019-2024), driven by factors such as increasing retail investor participation, technological advancements, and favorable economic conditions. The market size witnessed a CAGR of xx% during this period, reaching xx Million in 2024. The forecast period (2025-2033) projects continued growth, albeit at a slightly moderated pace, driven by the expansion of online brokerage services, the increasing adoption of mobile trading apps, and the growing popularity of fractional investing. The market penetration rate for online brokerage services is expected to reach xx% by 2033. Technological disruptions, particularly the rise of robo-advisors and AI-powered trading tools, are reshaping consumer behavior, leading to increased demand for personalized and automated investment solutions. The shifting demographics, with younger generations entering the market, will further influence growth trends.
Dominant Regions, Countries, or Segments in US Securities Brokerage Market
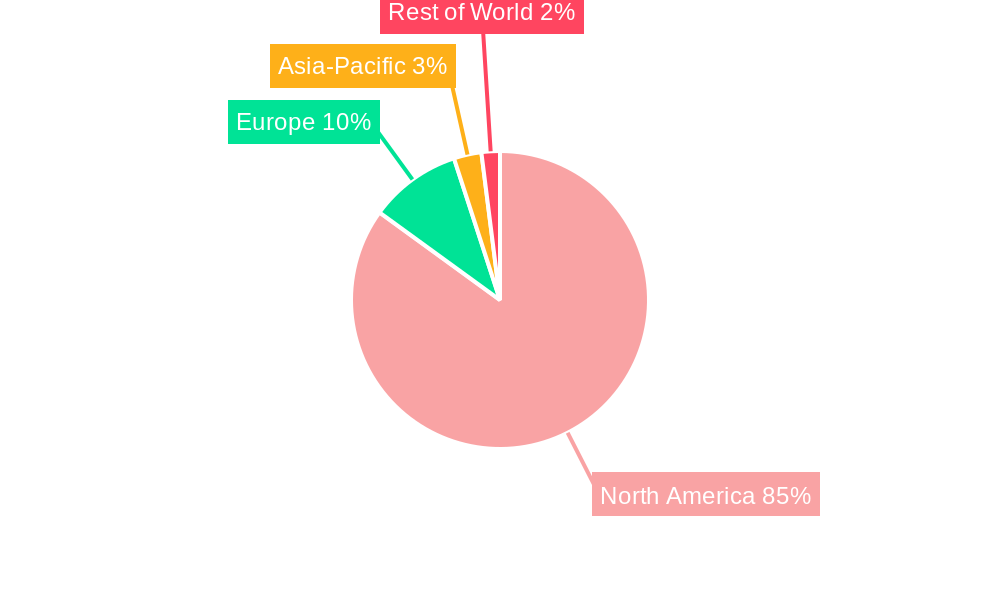
The US securities brokerage market exhibits a distinct geographical concentration, with significant activity primarily emanating from major metropolitan areas that serve as established financial hubs. New York, California, and Texas stand out as leading regions, benefiting from a higher density of high-net-worth individuals, sophisticated financial infrastructure, and a robust legal and regulatory framework that fosters financial operations.
- Key Drivers: A high concentration of leading financial institutions, strong overall economic activity, and a supportive and well-defined regulatory environment are foundational to the dominance of these regions.
- Dominance Factors: The presence of major, established brokerage firms, an extensive and diverse investor base, and a deeply developed financial infrastructure are crucial elements contributing to regional market leadership.
- Growth Potential: The continuous expansion of accessible online brokerage services and the increasing participation of younger, digitally-native investors are significant drivers of future growth. The online brokerage segment, in particular, is projected to experience the highest growth rate during the forecast period, reflecting a shift in investor behavior.
US Securities Brokerage Market Product Landscape
The US securities brokerage market offers a diverse range of products and services, including traditional brokerage accounts, retirement accounts (IRAs, 401(k)s), margin accounts, options trading, and increasingly sophisticated investment products tailored to specific investor needs. Recent innovations focus on enhancing user experience through mobile-first platforms, personalized investment recommendations driven by AI, and commission-free trading. Key performance metrics include account opening rates, average transaction values, and customer retention rates. Unique selling propositions often center around competitive pricing, advanced trading tools, and superior customer service.
Key Drivers, Barriers & Challenges in US Securities Brokerage Market
Key Drivers:
- Increasing retail investor participation fueled by ease of access through online platforms.
- Technological advancements lowering barriers to entry and increasing efficiency.
- Favorable regulatory environment promoting innovation and competition.
Key Challenges and Restraints:
- Intense competition among established players and emerging fintech firms.
- Regulatory scrutiny and compliance requirements increase operating costs.
- Cybersecurity threats and data breaches pose significant risks.
- xx% decrease in trading volume is observed from 2021 to 2022 due to the tightening of monetary policies.
Emerging Opportunities in US Securities Brokerage Market
- Expansion into underserved markets: Reaching out to underbanked and minority communities offers significant untapped potential.
- Development of innovative investment products: Offering ESG-focused investments and alternative asset classes will attract environmentally and socially conscious investors.
- Leveraging AI and machine learning: Personalized investment advice and robo-advisory services will further enhance customer experience.
Growth Accelerators in the US Securities Brokerage Market Industry
Technological breakthroughs are acting as powerful catalysts for growth within the US securities brokerage market. Innovations such as AI-driven investment strategies offer sophisticated analytical capabilities, while personalized financial planning tools are enhancing customer engagement and retention. Strategic collaborations and partnerships between established brokerage firms and agile fintech companies are further fostering innovation, accelerating the development of new products and services, and effectively expanding market reach. Beyond technology, proactive market expansion strategies, including thoughtful internationalization efforts and diversification into emerging or alternative asset classes, are poised to contribute significantly to overall market growth. The persistent and growing demand for investment options like fractional shares and the widespread adoption of commission-free trading models will continue to be substantial fuel for the market's expansion.
Key Players Shaping the US Securities Brokerage Market Market
Notable Milestones in US Securities Brokerage Market Sector
- February 2023: Fidelity Investments launched the Fidelity Municipal Core Plus Bond Fund (FMBAX), expanding its fixed-income offerings.
- February 2023: Robinhood announced plans to buy back Sam Bankman-Fried's 7% stake.
In-Depth US Securities Brokerage Market Market Outlook
The US securities brokerage market is on a trajectory for sustained and robust growth throughout the forecast period (2025-2033). This expansion will be propelled by the relentless pace of technological advancements, a discernible increase in retail investor participation, and the dynamic evolution of investor preferences and demands. Significant strategic opportunities are abundant for brokerage firms that can effectively harness the power of Artificial Intelligence and machine learning to elevate personalization and significantly enhance the overall customer experience. Furthermore, firms that strategically focus on expanding their reach into underserved markets and proactively offer innovative investment products designed to meet the nuanced and changing needs of investors will be well-positioned for success. The market is anticipated to achieve a valuation of approximately xx Million by 2033, presenting substantial and exciting opportunities for both established industry veterans and agile new market entrants.
US Securities Brokerage Market Segmentation
-
1. Type
- 1.1. Derivatives & Commodities Brokerage
- 1.2. Stock Exchanges
- 1.3. Bonds Brokerage
- 1.4. Equities Brokerage
- 1.5. Other Types
-
2. Mode
- 2.1. Online
- 2.2. Offline
-
3. Type of Establishment
- 3.1. Exclusive Brokers
- 3.2. Banks
- 3.3. Investment Firms
- 3.4. Other Types of Establishments
US Securities Brokerage Market Segmentation By Geography
-
1. North America
- 1.1. United States
- 1.2. Canada
- 1.3. Mexico
-
2. South America
- 2.1. Brazil
- 2.2. Argentina
- 2.3. Rest of South America
-
3. Europe
- 3.1. United Kingdom
- 3.2. Germany
- 3.3. France
- 3.4. Italy
- 3.5. Spain
- 3.6. Russia
- 3.7. Benelux
- 3.8. Nordics
- 3.9. Rest of Europe
-
4. Middle East & Africa
- 4.1. Turkey
- 4.2. Israel
- 4.3. GCC
- 4.4. North Africa
- 4.5. South Africa
- 4.6. Rest of Middle East & Africa
-
5. Asia Pacific
- 5.1. China
- 5.2. India
- 5.3. Japan
- 5.4. South Korea
- 5.5. ASEAN
- 5.6. Oceania
- 5.7. Rest of Asia Pacific
US Securities Brokerage Market Regional Market Share
Geographic Coverage of US Securities Brokerage Market
US Securities Brokerage Market REPORT HIGHLIGHTS
| Aspects | Details |
|---|---|
| Study Period | 2020-2034 |
| Base Year | 2025 |
| Estimated Year | 2026 |
| Forecast Period | 2026-2034 |
| Historical Period | 2020-2025 |
| Growth Rate | CAGR of 4.23% from 2020-2034 |
| Segmentation |
|
Table of Contents
- 1. Introduction
- 1.1. Research Scope
- 1.2. Market Segmentation
- 1.3. Research Objective
- 1.4. Definitions and Assumptions
- 2. Executive Summary
- 2.1. Market Snapshot
- 3. Market Dynamics
- 3.1. Market Drivers
- 3.2. Market Restrains
- 3.3. Market Trends
- 3.4. Market Opportunities
- 4. Market Factor Analysis
- 4.1. Porters Five Forces
- 4.1.1. Bargaining Power of Suppliers
- 4.1.2. Bargaining Power of Buyers
- 4.1.3. Threat of New Entrants
- 4.1.4. Threat of Substitutes
- 4.1.5. Competitive Rivalry
- 4.2. PESTEL analysis
- 4.3. BCG Analysis
- 4.3.1. Stars (High Growth, High Market Share)
- 4.3.2. Cash Cows (Low Growth, High Market Share)
- 4.3.3. Question Mark (High Growth, Low Market Share)
- 4.3.4. Dogs (Low Growth, Low Market Share)
- 4.4. Ansoff Matrix Analysis
- 4.5. Supply Chain Analysis
- 4.6. Regulatory Landscape
- 4.7. Current Market Potential and Opportunity Assessment (TAM–SAM–SOM Framework)
- 4.8. IMR Analyst Note
- 4.1. Porters Five Forces
- 5. Market Analysis, Insights and Forecast 2021-2033
- 5.1. Market Analysis, Insights and Forecast - by Type
- 5.1.1. Derivatives & Commodities Brokerage
- 5.1.2. Stock Exchanges
- 5.1.3. Bonds Brokerage
- 5.1.4. Equities Brokerage
- 5.1.5. Other Types
- 5.2. Market Analysis, Insights and Forecast - by Mode
- 5.2.1. Online
- 5.2.2. Offline
- 5.3. Market Analysis, Insights and Forecast - by Type of Establishment
- 5.3.1. Exclusive Brokers
- 5.3.2. Banks
- 5.3.3. Investment Firms
- 5.3.4. Other Types of Establishments
- 5.4. Market Analysis, Insights and Forecast - by Region
- 5.4.1. North America
- 5.4.2. South America
- 5.4.3. Europe
- 5.4.4. Middle East & Africa
- 5.4.5. Asia Pacific
- 5.1. Market Analysis, Insights and Forecast - by Type
- 6. Global US Securities Brokerage Market Analysis, Insights and Forecast, 2021-2033
- 6.1. Market Analysis, Insights and Forecast - by Type
- 6.1.1. Derivatives & Commodities Brokerage
- 6.1.2. Stock Exchanges
- 6.1.3. Bonds Brokerage
- 6.1.4. Equities Brokerage
- 6.1.5. Other Types
- 6.2. Market Analysis, Insights and Forecast - by Mode
- 6.2.1. Online
- 6.2.2. Offline
- 6.3. Market Analysis, Insights and Forecast - by Type of Establishment
- 6.3.1. Exclusive Brokers
- 6.3.2. Banks
- 6.3.3. Investment Firms
- 6.3.4. Other Types of Establishments
- 6.1. Market Analysis, Insights and Forecast - by Type
- 7. North America US Securities Brokerage Market Analysis, Insights and Forecast, 2020-2032
- 7.1. Market Analysis, Insights and Forecast - by Type
- 7.1.1. Derivatives & Commodities Brokerage
- 7.1.2. Stock Exchanges
- 7.1.3. Bonds Brokerage
- 7.1.4. Equities Brokerage
- 7.1.5. Other Types
- 7.2. Market Analysis, Insights and Forecast - by Mode
- 7.2.1. Online
- 7.2.2. Offline
- 7.3. Market Analysis, Insights and Forecast - by Type of Establishment
- 7.3.1. Exclusive Brokers
- 7.3.2. Banks
- 7.3.3. Investment Firms
- 7.3.4. Other Types of Establishments
- 7.1. Market Analysis, Insights and Forecast - by Type
- 8. South America US Securities Brokerage Market Analysis, Insights and Forecast, 2020-2032
- 8.1. Market Analysis, Insights and Forecast - by Type
- 8.1.1. Derivatives & Commodities Brokerage
- 8.1.2. Stock Exchanges
- 8.1.3. Bonds Brokerage
- 8.1.4. Equities Brokerage
- 8.1.5. Other Types
- 8.2. Market Analysis, Insights and Forecast - by Mode
- 8.2.1. Online
- 8.2.2. Offline
- 8.3. Market Analysis, Insights and Forecast - by Type of Establishment
- 8.3.1. Exclusive Brokers
- 8.3.2. Banks
- 8.3.3. Investment Firms
- 8.3.4. Other Types of Establishments
- 8.1. Market Analysis, Insights and Forecast - by Type
- 9. Europe US Securities Brokerage Market Analysis, Insights and Forecast, 2020-2032
- 9.1. Market Analysis, Insights and Forecast - by Type
- 9.1.1. Derivatives & Commodities Brokerage
- 9.1.2. Stock Exchanges
- 9.1.3. Bonds Brokerage
- 9.1.4. Equities Brokerage
- 9.1.5. Other Types
- 9.2. Market Analysis, Insights and Forecast - by Mode
- 9.2.1. Online
- 9.2.2. Offline
- 9.3. Market Analysis, Insights and Forecast - by Type of Establishment
- 9.3.1. Exclusive Brokers
- 9.3.2. Banks
- 9.3.3. Investment Firms
- 9.3.4. Other Types of Establishments
- 9.1. Market Analysis, Insights and Forecast - by Type
- 10. Middle East & Africa US Securities Brokerage Market Analysis, Insights and Forecast, 2020-2032
- 10.1. Market Analysis, Insights and Forecast - by Type
- 10.1.1. Derivatives & Commodities Brokerage
- 10.1.2. Stock Exchanges
- 10.1.3. Bonds Brokerage
- 10.1.4. Equities Brokerage
- 10.1.5. Other Types
- 10.2. Market Analysis, Insights and Forecast - by Mode
- 10.2.1. Online
- 10.2.2. Offline
- 10.3. Market Analysis, Insights and Forecast - by Type of Establishment
- 10.3.1. Exclusive Brokers
- 10.3.2. Banks
- 10.3.3. Investment Firms
- 10.3.4. Other Types of Establishments
- 10.1. Market Analysis, Insights and Forecast - by Type
- 11. Asia Pacific US Securities Brokerage Market Analysis, Insights and Forecast, 2020-2032
- 11.1. Market Analysis, Insights and Forecast - by Type
- 11.1.1. Derivatives & Commodities Brokerage
- 11.1.2. Stock Exchanges
- 11.1.3. Bonds Brokerage
- 11.1.4. Equities Brokerage
- 11.1.5. Other Types
- 11.2. Market Analysis, Insights and Forecast - by Mode
- 11.2.1. Online
- 11.2.2. Offline
- 11.3. Market Analysis, Insights and Forecast - by Type of Establishment
- 11.3.1. Exclusive Brokers
- 11.3.2. Banks
- 11.3.3. Investment Firms
- 11.3.4. Other Types of Establishments
- 11.1. Market Analysis, Insights and Forecast - by Type
- 12. Competitive Analysis
- 12.1. Company Profiles
- 12.1.1 Fidelity
- 12.1.1.1. Company Overview
- 12.1.1.2. Products
- 12.1.1.3. Company Financials
- 12.1.1.4. SWOT Analysis
- 12.1.2 E-Trade
- 12.1.2.1. Company Overview
- 12.1.2.2. Products
- 12.1.2.3. Company Financials
- 12.1.2.4. SWOT Analysis
- 12.1.3 Merrill Edge
- 12.1.3.1. Company Overview
- 12.1.3.2. Products
- 12.1.3.3. Company Financials
- 12.1.3.4. SWOT Analysis
- 12.1.4 Interactive Brokers
- 12.1.4.1. Company Overview
- 12.1.4.2. Products
- 12.1.4.3. Company Financials
- 12.1.4.4. SWOT Analysis
- 12.1.5 JPMorgan Wealth Management
- 12.1.5.1. Company Overview
- 12.1.5.2. Products
- 12.1.5.3. Company Financials
- 12.1.5.4. SWOT Analysis
- 12.1.6 Webull
- 12.1.6.1. Company Overview
- 12.1.6.2. Products
- 12.1.6.3. Company Financials
- 12.1.6.4. SWOT Analysis
- 12.1.7 Robinhood
- 12.1.7.1. Company Overview
- 12.1.7.2. Products
- 12.1.7.3. Company Financials
- 12.1.7.4. SWOT Analysis
- 12.1.8 Ally Invest
- 12.1.8.1. Company Overview
- 12.1.8.2. Products
- 12.1.8.3. Company Financials
- 12.1.8.4. SWOT Analysis
- 12.1.9 Firstrade
- 12.1.9.1. Company Overview
- 12.1.9.2. Products
- 12.1.9.3. Company Financials
- 12.1.9.4. SWOT Analysis
- 12.1.10 Charles Schwab**List Not Exhaustive
- 12.1.10.1. Company Overview
- 12.1.10.2. Products
- 12.1.10.3. Company Financials
- 12.1.10.4. SWOT Analysis
- 12.1.1 Fidelity
- 12.2. Market Entropy
- 12.2.1 Company's Key Areas Served
- 12.2.2 Recent Developments
- 12.3. Company Market Share Analysis 2025
- 12.3.1 Top 5 Companies Market Share Analysis
- 12.3.2 Top 3 Companies Market Share Analysis
- 12.4. List of Potential Customers
- 13. Research Methodology
List of Figures
- Figure 1: Global US Securities Brokerage Market Revenue Breakdown (Million, %) by Region 2025 & 2033
- Figure 2: Global US Securities Brokerage Market Volume Breakdown (Billion, %) by Region 2025 & 2033
- Figure 3: North America US Securities Brokerage Market Revenue (Million), by Type 2025 & 2033
- Figure 4: North America US Securities Brokerage Market Volume (Billion), by Type 2025 & 2033
- Figure 5: North America US Securities Brokerage Market Revenue Share (%), by Type 2025 & 2033
- Figure 6: North America US Securities Brokerage Market Volume Share (%), by Type 2025 & 2033
- Figure 7: North America US Securities Brokerage Market Revenue (Million), by Mode 2025 & 2033
- Figure 8: North America US Securities Brokerage Market Volume (Billion), by Mode 2025 & 2033
- Figure 9: North America US Securities Brokerage Market Revenue Share (%), by Mode 2025 & 2033
- Figure 10: North America US Securities Brokerage Market Volume Share (%), by Mode 2025 & 2033
- Figure 11: North America US Securities Brokerage Market Revenue (Million), by Type of Establishment 2025 & 2033
- Figure 12: North America US Securities Brokerage Market Volume (Billion), by Type of Establishment 2025 & 2033
- Figure 13: North America US Securities Brokerage Market Revenue Share (%), by Type of Establishment 2025 & 2033
- Figure 14: North America US Securities Brokerage Market Volume Share (%), by Type of Establishment 2025 & 2033
- Figure 15: North America US Securities Brokerage Market Revenue (Million), by Country 2025 & 2033
- Figure 16: North America US Securities Brokerage Market Volume (Billion), by Country 2025 & 2033
- Figure 17: North America US Securities Brokerage Market Revenue Share (%), by Country 2025 & 2033
- Figure 18: North America US Securities Brokerage Market Volume Share (%), by Country 2025 & 2033
- Figure 19: South America US Securities Brokerage Market Revenue (Million), by Type 2025 & 2033
- Figure 20: South America US Securities Brokerage Market Volume (Billion), by Type 2025 & 2033
- Figure 21: South America US Securities Brokerage Market Revenue Share (%), by Type 2025 & 2033
- Figure 22: South America US Securities Brokerage Market Volume Share (%), by Type 2025 & 2033
- Figure 23: South America US Securities Brokerage Market Revenue (Million), by Mode 2025 & 2033
- Figure 24: South America US Securities Brokerage Market Volume (Billion), by Mode 2025 & 2033
- Figure 25: South America US Securities Brokerage Market Revenue Share (%), by Mode 2025 & 2033
- Figure 26: South America US Securities Brokerage Market Volume Share (%), by Mode 2025 & 2033
- Figure 27: South America US Securities Brokerage Market Revenue (Million), by Type of Establishment 2025 & 2033
- Figure 28: South America US Securities Brokerage Market Volume (Billion), by Type of Establishment 2025 & 2033
- Figure 29: South America US Securities Brokerage Market Revenue Share (%), by Type of Establishment 2025 & 2033
- Figure 30: South America US Securities Brokerage Market Volume Share (%), by Type of Establishment 2025 & 2033
- Figure 31: South America US Securities Brokerage Market Revenue (Million), by Country 2025 & 2033
- Figure 32: South America US Securities Brokerage Market Volume (Billion), by Country 2025 & 2033
- Figure 33: South America US Securities Brokerage Market Revenue Share (%), by Country 2025 & 2033
- Figure 34: South America US Securities Brokerage Market Volume Share (%), by Country 2025 & 2033
- Figure 35: Europe US Securities Brokerage Market Revenue (Million), by Type 2025 & 2033
- Figure 36: Europe US Securities Brokerage Market Volume (Billion), by Type 2025 & 2033
- Figure 37: Europe US Securities Brokerage Market Revenue Share (%), by Type 2025 & 2033
- Figure 38: Europe US Securities Brokerage Market Volume Share (%), by Type 2025 & 2033
- Figure 39: Europe US Securities Brokerage Market Revenue (Million), by Mode 2025 & 2033
- Figure 40: Europe US Securities Brokerage Market Volume (Billion), by Mode 2025 & 2033
- Figure 41: Europe US Securities Brokerage Market Revenue Share (%), by Mode 2025 & 2033
- Figure 42: Europe US Securities Brokerage Market Volume Share (%), by Mode 2025 & 2033
- Figure 43: Europe US Securities Brokerage Market Revenue (Million), by Type of Establishment 2025 & 2033
- Figure 44: Europe US Securities Brokerage Market Volume (Billion), by Type of Establishment 2025 & 2033
- Figure 45: Europe US Securities Brokerage Market Revenue Share (%), by Type of Establishment 2025 & 2033
- Figure 46: Europe US Securities Brokerage Market Volume Share (%), by Type of Establishment 2025 & 2033
- Figure 47: Europe US Securities Brokerage Market Revenue (Million), by Country 2025 & 2033
- Figure 48: Europe US Securities Brokerage Market Volume (Billion), by Country 2025 & 2033
- Figure 49: Europe US Securities Brokerage Market Revenue Share (%), by Country 2025 & 2033
- Figure 50: Europe US Securities Brokerage Market Volume Share (%), by Country 2025 & 2033
- Figure 51: Middle East & Africa US Securities Brokerage Market Revenue (Million), by Type 2025 & 2033
- Figure 52: Middle East & Africa US Securities Brokerage Market Volume (Billion), by Type 2025 & 2033
- Figure 53: Middle East & Africa US Securities Brokerage Market Revenue Share (%), by Type 2025 & 2033
- Figure 54: Middle East & Africa US Securities Brokerage Market Volume Share (%), by Type 2025 & 2033
- Figure 55: Middle East & Africa US Securities Brokerage Market Revenue (Million), by Mode 2025 & 2033
- Figure 56: Middle East & Africa US Securities Brokerage Market Volume (Billion), by Mode 2025 & 2033
- Figure 57: Middle East & Africa US Securities Brokerage Market Revenue Share (%), by Mode 2025 & 2033
- Figure 58: Middle East & Africa US Securities Brokerage Market Volume Share (%), by Mode 2025 & 2033
- Figure 59: Middle East & Africa US Securities Brokerage Market Revenue (Million), by Type of Establishment 2025 & 2033
- Figure 60: Middle East & Africa US Securities Brokerage Market Volume (Billion), by Type of Establishment 2025 & 2033
- Figure 61: Middle East & Africa US Securities Brokerage Market Revenue Share (%), by Type of Establishment 2025 & 2033
- Figure 62: Middle East & Africa US Securities Brokerage Market Volume Share (%), by Type of Establishment 2025 & 2033
- Figure 63: Middle East & Africa US Securities Brokerage Market Revenue (Million), by Country 2025 & 2033
- Figure 64: Middle East & Africa US Securities Brokerage Market Volume (Billion), by Country 2025 & 2033
- Figure 65: Middle East & Africa US Securities Brokerage Market Revenue Share (%), by Country 2025 & 2033
- Figure 66: Middle East & Africa US Securities Brokerage Market Volume Share (%), by Country 2025 & 2033
- Figure 67: Asia Pacific US Securities Brokerage Market Revenue (Million), by Type 2025 & 2033
- Figure 68: Asia Pacific US Securities Brokerage Market Volume (Billion), by Type 2025 & 2033
- Figure 69: Asia Pacific US Securities Brokerage Market Revenue Share (%), by Type 2025 & 2033
- Figure 70: Asia Pacific US Securities Brokerage Market Volume Share (%), by Type 2025 & 2033
- Figure 71: Asia Pacific US Securities Brokerage Market Revenue (Million), by Mode 2025 & 2033
- Figure 72: Asia Pacific US Securities Brokerage Market Volume (Billion), by Mode 2025 & 2033
- Figure 73: Asia Pacific US Securities Brokerage Market Revenue Share (%), by Mode 2025 & 2033
- Figure 74: Asia Pacific US Securities Brokerage Market Volume Share (%), by Mode 2025 & 2033
- Figure 75: Asia Pacific US Securities Brokerage Market Revenue (Million), by Type of Establishment 2025 & 2033
- Figure 76: Asia Pacific US Securities Brokerage Market Volume (Billion), by Type of Establishment 2025 & 2033
- Figure 77: Asia Pacific US Securities Brokerage Market Revenue Share (%), by Type of Establishment 2025 & 2033
- Figure 78: Asia Pacific US Securities Brokerage Market Volume Share (%), by Type of Establishment 2025 & 2033
- Figure 79: Asia Pacific US Securities Brokerage Market Revenue (Million), by Country 2025 & 2033
- Figure 80: Asia Pacific US Securities Brokerage Market Volume (Billion), by Country 2025 & 2033
- Figure 81: Asia Pacific US Securities Brokerage Market Revenue Share (%), by Country 2025 & 2033
- Figure 82: Asia Pacific US Securities Brokerage Market Volume Share (%), by Country 2025 & 2033
List of Tables
- Table 1: Global US Securities Brokerage Market Revenue Million Forecast, by Type 2020 & 2033
- Table 2: Global US Securities Brokerage Market Volume Billion Forecast, by Type 2020 & 2033
- Table 3: Global US Securities Brokerage Market Revenue Million Forecast, by Mode 2020 & 2033
- Table 4: Global US Securities Brokerage Market Volume Billion Forecast, by Mode 2020 & 2033
- Table 5: Global US Securities Brokerage Market Revenue Million Forecast, by Type of Establishment 2020 & 2033
- Table 6: Global US Securities Brokerage Market Volume Billion Forecast, by Type of Establishment 2020 & 2033
- Table 7: Global US Securities Brokerage Market Revenue Million Forecast, by Region 2020 & 2033
- Table 8: Global US Securities Brokerage Market Volume Billion Forecast, by Region 2020 & 2033
- Table 9: Global US Securities Brokerage Market Revenue Million Forecast, by Type 2020 & 2033
- Table 10: Global US Securities Brokerage Market Volume Billion Forecast, by Type 2020 & 2033
- Table 11: Global US Securities Brokerage Market Revenue Million Forecast, by Mode 2020 & 2033
- Table 12: Global US Securities Brokerage Market Volume Billion Forecast, by Mode 2020 & 2033
- Table 13: Global US Securities Brokerage Market Revenue Million Forecast, by Type of Establishment 2020 & 2033
- Table 14: Global US Securities Brokerage Market Volume Billion Forecast, by Type of Establishment 2020 & 2033
- Table 15: Global US Securities Brokerage Market Revenue Million Forecast, by Country 2020 & 2033
- Table 16: Global US Securities Brokerage Market Volume Billion Forecast, by Country 2020 & 2033
- Table 17: United States US Securities Brokerage Market Revenue (Million) Forecast, by Application 2020 & 2033
- Table 18: United States US Securities Brokerage Market Volume (Billion) Forecast, by Application 2020 & 2033
- Table 19: Canada US Securities Brokerage Market Revenue (Million) Forecast, by Application 2020 & 2033
- Table 20: Canada US Securities Brokerage Market Volume (Billion) Forecast, by Application 2020 & 2033
- Table 21: Mexico US Securities Brokerage Market Revenue (Million) Forecast, by Application 2020 & 2033
- Table 22: Mexico US Securities Brokerage Market Volume (Billion) Forecast, by Application 2020 & 2033
- Table 23: Global US Securities Brokerage Market Revenue Million Forecast, by Type 2020 & 2033
- Table 24: Global US Securities Brokerage Market Volume Billion Forecast, by Type 2020 & 2033
- Table 25: Global US Securities Brokerage Market Revenue Million Forecast, by Mode 2020 & 2033
- Table 26: Global US Securities Brokerage Market Volume Billion Forecast, by Mode 2020 & 2033
- Table 27: Global US Securities Brokerage Market Revenue Million Forecast, by Type of Establishment 2020 & 2033
- Table 28: Global US Securities Brokerage Market Volume Billion Forecast, by Type of Establishment 2020 & 2033
- Table 29: Global US Securities Brokerage Market Revenue Million Forecast, by Country 2020 & 2033
- Table 30: Global US Securities Brokerage Market Volume Billion Forecast, by Country 2020 & 2033
- Table 31: Brazil US Securities Brokerage Market Revenue (Million) Forecast, by Application 2020 & 2033
- Table 32: Brazil US Securities Brokerage Market Volume (Billion) Forecast, by Application 2020 & 2033
- Table 33: Argentina US Securities Brokerage Market Revenue (Million) Forecast, by Application 2020 & 2033
- Table 34: Argentina US Securities Brokerage Market Volume (Billion) Forecast, by Application 2020 & 2033
- Table 35: Rest of South America US Securities Brokerage Market Revenue (Million) Forecast, by Application 2020 & 2033
- Table 36: Rest of South America US Securities Brokerage Market Volume (Billion) Forecast, by Application 2020 & 2033
- Table 37: Global US Securities Brokerage Market Revenue Million Forecast, by Type 2020 & 2033
- Table 38: Global US Securities Brokerage Market Volume Billion Forecast, by Type 2020 & 2033
- Table 39: Global US Securities Brokerage Market Revenue Million Forecast, by Mode 2020 & 2033
- Table 40: Global US Securities Brokerage Market Volume Billion Forecast, by Mode 2020 & 2033
- Table 41: Global US Securities Brokerage Market Revenue Million Forecast, by Type of Establishment 2020 & 2033
- Table 42: Global US Securities Brokerage Market Volume Billion Forecast, by Type of Establishment 2020 & 2033
- Table 43: Global US Securities Brokerage Market Revenue Million Forecast, by Country 2020 & 2033
- Table 44: Global US Securities Brokerage Market Volume Billion Forecast, by Country 2020 & 2033
- Table 45: United Kingdom US Securities Brokerage Market Revenue (Million) Forecast, by Application 2020 & 2033
- Table 46: United Kingdom US Securities Brokerage Market Volume (Billion) Forecast, by Application 2020 & 2033
- Table 47: Germany US Securities Brokerage Market Revenue (Million) Forecast, by Application 2020 & 2033
- Table 48: Germany US Securities Brokerage Market Volume (Billion) Forecast, by Application 2020 & 2033
- Table 49: France US Securities Brokerage Market Revenue (Million) Forecast, by Application 2020 & 2033
- Table 50: France US Securities Brokerage Market Volume (Billion) Forecast, by Application 2020 & 2033
- Table 51: Italy US Securities Brokerage Market Revenue (Million) Forecast, by Application 2020 & 2033
- Table 52: Italy US Securities Brokerage Market Volume (Billion) Forecast, by Application 2020 & 2033
- Table 53: Spain US Securities Brokerage Market Revenue (Million) Forecast, by Application 2020 & 2033
- Table 54: Spain US Securities Brokerage Market Volume (Billion) Forecast, by Application 2020 & 2033
- Table 55: Russia US Securities Brokerage Market Revenue (Million) Forecast, by Application 2020 & 2033
- Table 56: Russia US Securities Brokerage Market Volume (Billion) Forecast, by Application 2020 & 2033
- Table 57: Benelux US Securities Brokerage Market Revenue (Million) Forecast, by Application 2020 & 2033
- Table 58: Benelux US Securities Brokerage Market Volume (Billion) Forecast, by Application 2020 & 2033
- Table 59: Nordics US Securities Brokerage Market Revenue (Million) Forecast, by Application 2020 & 2033
- Table 60: Nordics US Securities Brokerage Market Volume (Billion) Forecast, by Application 2020 & 2033
- Table 61: Rest of Europe US Securities Brokerage Market Revenue (Million) Forecast, by Application 2020 & 2033
- Table 62: Rest of Europe US Securities Brokerage Market Volume (Billion) Forecast, by Application 2020 & 2033
- Table 63: Global US Securities Brokerage Market Revenue Million Forecast, by Type 2020 & 2033
- Table 64: Global US Securities Brokerage Market Volume Billion Forecast, by Type 2020 & 2033
- Table 65: Global US Securities Brokerage Market Revenue Million Forecast, by Mode 2020 & 2033
- Table 66: Global US Securities Brokerage Market Volume Billion Forecast, by Mode 2020 & 2033
- Table 67: Global US Securities Brokerage Market Revenue Million Forecast, by Type of Establishment 2020 & 2033
- Table 68: Global US Securities Brokerage Market Volume Billion Forecast, by Type of Establishment 2020 & 2033
- Table 69: Global US Securities Brokerage Market Revenue Million Forecast, by Country 2020 & 2033
- Table 70: Global US Securities Brokerage Market Volume Billion Forecast, by Country 2020 & 2033
- Table 71: Turkey US Securities Brokerage Market Revenue (Million) Forecast, by Application 2020 & 2033
- Table 72: Turkey US Securities Brokerage Market Volume (Billion) Forecast, by Application 2020 & 2033
- Table 73: Israel US Securities Brokerage Market Revenue (Million) Forecast, by Application 2020 & 2033
- Table 74: Israel US Securities Brokerage Market Volume (Billion) Forecast, by Application 2020 & 2033
- Table 75: GCC US Securities Brokerage Market Revenue (Million) Forecast, by Application 2020 & 2033
- Table 76: GCC US Securities Brokerage Market Volume (Billion) Forecast, by Application 2020 & 2033
- Table 77: North Africa US Securities Brokerage Market Revenue (Million) Forecast, by Application 2020 & 2033
- Table 78: North Africa US Securities Brokerage Market Volume (Billion) Forecast, by Application 2020 & 2033
- Table 79: South Africa US Securities Brokerage Market Revenue (Million) Forecast, by Application 2020 & 2033
- Table 80: South Africa US Securities Brokerage Market Volume (Billion) Forecast, by Application 2020 & 2033
- Table 81: Rest of Middle East & Africa US Securities Brokerage Market Revenue (Million) Forecast, by Application 2020 & 2033
- Table 82: Rest of Middle East & Africa US Securities Brokerage Market Volume (Billion) Forecast, by Application 2020 & 2033
- Table 83: Global US Securities Brokerage Market Revenue Million Forecast, by Type 2020 & 2033
- Table 84: Global US Securities Brokerage Market Volume Billion Forecast, by Type 2020 & 2033
- Table 85: Global US Securities Brokerage Market Revenue Million Forecast, by Mode 2020 & 2033
- Table 86: Global US Securities Brokerage Market Volume Billion Forecast, by Mode 2020 & 2033
- Table 87: Global US Securities Brokerage Market Revenue Million Forecast, by Type of Establishment 2020 & 2033
- Table 88: Global US Securities Brokerage Market Volume Billion Forecast, by Type of Establishment 2020 & 2033
- Table 89: Global US Securities Brokerage Market Revenue Million Forecast, by Country 2020 & 2033
- Table 90: Global US Securities Brokerage Market Volume Billion Forecast, by Country 2020 & 2033
- Table 91: China US Securities Brokerage Market Revenue (Million) Forecast, by Application 2020 & 2033
- Table 92: China US Securities Brokerage Market Volume (Billion) Forecast, by Application 2020 & 2033
- Table 93: India US Securities Brokerage Market Revenue (Million) Forecast, by Application 2020 & 2033
- Table 94: India US Securities Brokerage Market Volume (Billion) Forecast, by Application 2020 & 2033
- Table 95: Japan US Securities Brokerage Market Revenue (Million) Forecast, by Application 2020 & 2033
- Table 96: Japan US Securities Brokerage Market Volume (Billion) Forecast, by Application 2020 & 2033
- Table 97: South Korea US Securities Brokerage Market Revenue (Million) Forecast, by Application 2020 & 2033
- Table 98: South Korea US Securities Brokerage Market Volume (Billion) Forecast, by Application 2020 & 2033
- Table 99: ASEAN US Securities Brokerage Market Revenue (Million) Forecast, by Application 2020 & 2033
- Table 100: ASEAN US Securities Brokerage Market Volume (Billion) Forecast, by Application 2020 & 2033
- Table 101: Oceania US Securities Brokerage Market Revenue (Million) Forecast, by Application 2020 & 2033
- Table 102: Oceania US Securities Brokerage Market Volume (Billion) Forecast, by Application 2020 & 2033
- Table 103: Rest of Asia Pacific US Securities Brokerage Market Revenue (Million) Forecast, by Application 2020 & 2033
- Table 104: Rest of Asia Pacific US Securities Brokerage Market Volume (Billion) Forecast, by Application 2020 & 2033
Frequently Asked Questions
1. What is the projected Compound Annual Growth Rate (CAGR) of the US Securities Brokerage Market?
The projected CAGR is approximately 4.23%.
2. Which companies are prominent players in the US Securities Brokerage Market?
Key companies in the market include Fidelity, E-Trade, Merrill Edge, Interactive Brokers, JPMorgan Wealth Management, Webull, Robinhood, Ally Invest, Firstrade, Charles Schwab**List Not Exhaustive.
3. What are the main segments of the US Securities Brokerage Market?
The market segments include Type, Mode, Type of Establishment.
4. Can you provide details about the market size?
The market size is estimated to be USD 196.99 Million as of 2022.
5. What are some drivers contributing to market growth?
N/A
6. What are the notable trends driving market growth?
Securities Brokerage is the leading Revenue generating in US Market.
7. Are there any restraints impacting market growth?
N/A
8. Can you provide examples of recent developments in the market?
February 2023: Fidelity Investments, one of the world's leading global fixed-income investment managers, announced the launch of the Fidelity Municipal Core Plus Bond Fund (FMBAX), adding to Fidelity's diverse lineup of active fixed-income strategies reaching across the risk spectrum. The fund, which allows Fidelity to participate in a fast-growing subset within the municipal bond space, is available commission-free and with no investment minimum to individual investors and financial advisors through Fidelity's online brokerage platforms.
9. What pricing options are available for accessing the report?
Pricing options include single-user, multi-user, and enterprise licenses priced at USD 3800, USD 4500, and USD 5800 respectively.
10. Is the market size provided in terms of value or volume?
The market size is provided in terms of value, measured in Million and volume, measured in Billion.
11. Are there any specific market keywords associated with the report?
Yes, the market keyword associated with the report is "US Securities Brokerage Market," which aids in identifying and referencing the specific market segment covered.
12. How do I determine which pricing option suits my needs best?
The pricing options vary based on user requirements and access needs. Individual users may opt for single-user licenses, while businesses requiring broader access may choose multi-user or enterprise licenses for cost-effective access to the report.
13. Are there any additional resources or data provided in the US Securities Brokerage Market report?
While the report offers comprehensive insights, it's advisable to review the specific contents or supplementary materials provided to ascertain if additional resources or data are available.
14. How can I stay updated on further developments or reports in the US Securities Brokerage Market?
To stay informed about further developments, trends, and reports in the US Securities Brokerage Market, consider subscribing to industry newsletters, following relevant companies and organizations, or regularly checking reputable industry news sources and publications.
Methodology
Step 1 - Identification of Relevant Samples Size from Population Database


Step 2 - Approaches for Defining Global Market Size (Value, Volume* & Price*)

Note*: In applicable scenarios
Step 3 - Data Sources
Primary Research
- Web Analytics
- Survey Reports
- Research Institute
- Latest Research Reports
- Opinion Leaders
Secondary Research
- Annual Reports
- White Paper
- Latest Press Release
- Industry Association
- Paid Database
- Investor Presentations

Step 4 - Data Triangulation
Involves using different sources of information in order to increase the validity of a study
These sources are likely to be stakeholders in a program - participants, other researchers, program staff, other community members, and so on.
Then we put all data in single framework & apply various statistical tools to find out the dynamic on the market.
During the analysis stage, feedback from the stakeholder groups would be compared to determine areas of agreement as well as areas of divergence