

Key Insights
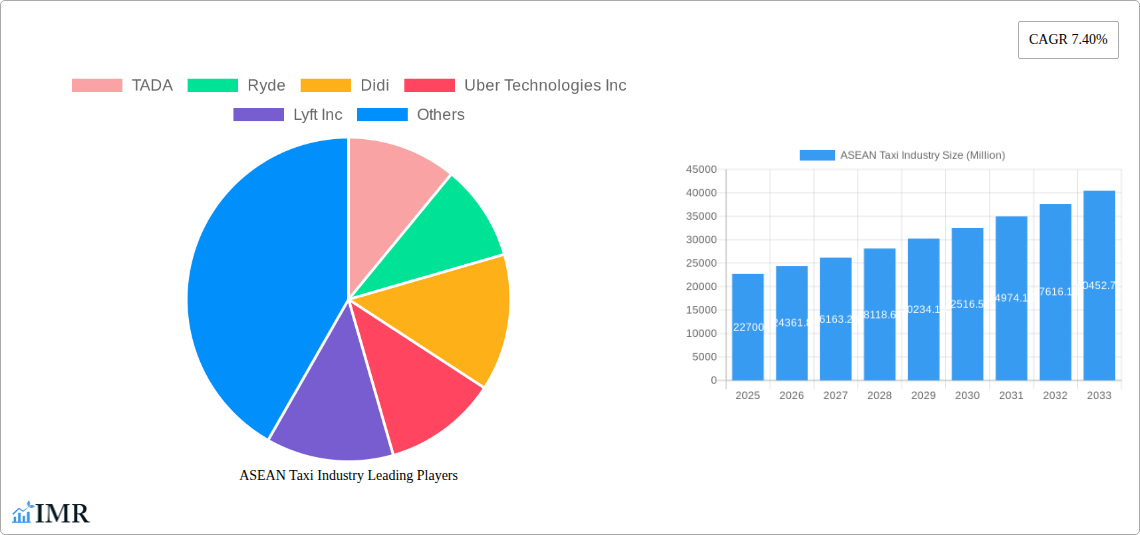
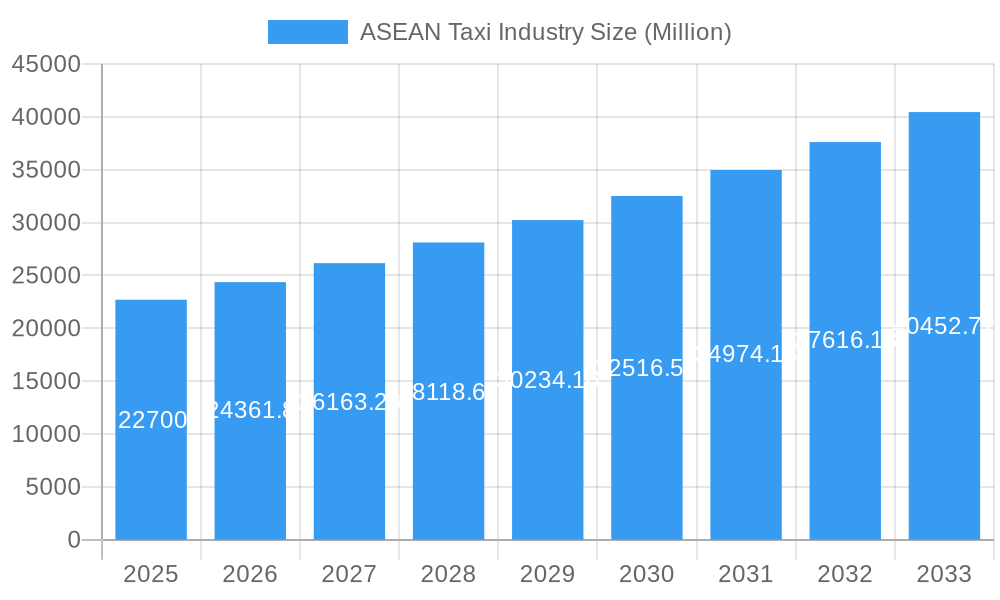
The ASEAN taxi industry, valued at $22.70 billion in 2025, is experiencing robust growth, projected to expand at a Compound Annual Growth Rate (CAGR) of 7.40% from 2025 to 2033. This surge is driven by several factors. Rapid urbanization across the region is fueling increased demand for convenient and affordable transportation. The rising adoption of smartphones and the expanding internet penetration are boosting the popularity of ride-hailing apps, significantly impacting the online booking segment's growth. Furthermore, increasing disposable incomes, particularly amongst the burgeoning middle class, are enabling greater access to ride-sharing services, contributing to the overall market expansion. While the motorcycle taxi segment maintains a significant presence, particularly in densely populated areas, the car segment is witnessing substantial growth, fueled by a rising preference for comfort and safety. Competition within the industry is fierce, with established players like Grab Holdings Inc. vying for market share against regional and international competitors such as Gojek and Didi. Regulatory frameworks and infrastructure development will significantly influence future growth. The industry faces challenges such as traffic congestion in major cities, fluctuating fuel prices, and the need for consistent regulatory clarity to ensure fair competition and sustainable growth.
ASEAN Taxi Industry Market Size (In Billion)
The Philippines, Malaysia, Thailand, and Singapore represent the largest markets within ASEAN, driving a substantial portion of the overall market size. However, the "Rest of ASEAN" segment also holds significant potential for future growth, given the rising urbanization and economic development within these nations. The offline booking segment, while still substantial, is gradually losing ground to the rapidly expanding online booking segment, reflecting the increasing preference for digital convenience. The industry’s future growth trajectory will be shaped by factors like government policies promoting sustainable transportation, investments in technological advancements within the ride-hailing sector, and the continued penetration of smartphones and reliable internet access across the region. Continuous innovation, including the integration of electric vehicles and improved safety measures, will be crucial for long-term success and sustainable growth within the dynamic ASEAN taxi industry.
ASEAN Taxi Industry Company Market Share
This comprehensive report provides an in-depth analysis of the ASEAN taxi industry, encompassing market dynamics, growth trends, key players, and future outlook from 2019 to 2033. With a focus on key segments – including Ride-hailing, Ride-sharing services across the Philippines, Malaysia, Thailand, Singapore, and the Rest of ASEAN – this report is an essential resource for industry professionals, investors, and strategic planners. The Base Year is 2025, with the Estimated Year also being 2025, and the Forecast Period spanning 2025-2033. The Historical Period covered is 2019-2024. Market values are presented in Million units.
ASEAN Taxi Industry Market Dynamics & Structure
The ASEAN taxi industry is characterized by a dynamic interplay of technological advancements, evolving regulatory landscapes, and intense competition. Market concentration is high, with a few dominant players controlling significant market share. The industry is witnessing rapid technological innovation, driven by the adoption of mobile apps, GPS technology, and AI-powered dispatch systems. However, regulatory hurdles and varying legal frameworks across different ASEAN nations present significant challenges. The emergence of ride-hailing services has significantly altered the competitive landscape, creating both opportunities and challenges for traditional taxi operators. The rise of e-hailing apps, coupled with evolving consumer preferences, further complicates market dynamics. Mergers and acquisitions (M&A) activity remains relatively high, reflecting consolidation efforts and strategic expansion strategies among major players.
- Market Concentration: Grab Holdings Inc. holds a dominant market share, estimated at xx%. Other major players like Gojek and Uber Technologies Inc. collectively account for approximately xx%.
- Technological Innovation Drivers: The integration of GPS, mobile apps, and cashless payment systems significantly enhance user experience and operational efficiency.
- Regulatory Frameworks: Varying regulations across ASEAN countries create complexity for operators navigating different licensing, pricing, and safety standards.
- Competitive Product Substitutes: Public transportation, personal vehicles, and motorbike taxis are key competitive substitutes, especially in areas with robust public transit options.
- End-User Demographics: The industry primarily serves a young, tech-savvy demographic, with increasing adoption among older generations.
- M&A Trends: The past five years have witnessed xx M&A deals in the ASEAN taxi industry, primarily driven by consolidation and expansion strategies.
ASEAN Taxi Industry Growth Trends & Insights
The ASEAN taxi industry has experienced significant growth over the past few years, fueled by increasing urbanization, rising disposable incomes, and the rapid adoption of smartphone technology. The market size expanded from xx million units in 2019 to xx million units in 2024, exhibiting a CAGR of xx%. This growth trajectory is expected to continue, with the market projected to reach xx million units by 2033, driven by increasing smartphone penetration, expanding middle class, and government initiatives promoting digitalization in the transportation sector. Technological disruptions, such as the introduction of electric vehicles and autonomous driving technologies, are expected to further reshape the industry landscape. Consumer behavior is shifting towards greater convenience, affordability, and safety, influencing the demand for ride-hailing services.
Dominant Regions, Countries, or Segments in ASEAN Taxi Industry
The Philippines and Indonesia are currently the dominant markets within the ASEAN region, driven by high population density, increasing urbanization, and relatively high smartphone penetration. Online booking dominates the market across ASEAN, accounting for xx% of all rides. Cars remain the most popular vehicle type, due to their capacity and suitability for various needs. Ride-hailing services constitute the majority of the market share, indicating high consumer demand for app-based taxi services.
- Key Drivers (Philippines): High smartphone penetration, robust e-commerce infrastructure, and a large, young population contribute to the high adoption rate of ride-hailing apps.
- Key Drivers (Indonesia): Extensive motorbike taxi networks, coupled with increasing middle-class income and urbanization, drive growth within the country.
- Key Drivers (Online Booking): Convenience, ease of payment, and transparent pricing are key reasons for the dominance of online booking platforms.
- Key Drivers (Cars): Flexibility, comfort, and capacity make cars a preferred choice for various trip purposes.
- Key Drivers (Ride-hailing): Demand for convenient, on-demand transportation services fuels the prominence of ride-hailing platforms.
ASEAN Taxi Industry Product Landscape
The ASEAN taxi industry showcases a diverse product landscape, ranging from traditional taxis to advanced ride-hailing platforms. Technological advancements, such as real-time tracking, fare estimation, and integrated payment systems, enhance the user experience. Unique selling propositions include features like ride-sharing options, premium services, and specialized transportation for various needs. Innovation in electric and hybrid vehicles is shaping the future of sustainable transportation within the industry.
Key Drivers, Barriers & Challenges in ASEAN Taxi Industry
Key Drivers: Rapid urbanization, rising disposable incomes, increasing smartphone penetration, and government support for digitalization are driving the market's growth. The convenience and affordability offered by ride-hailing platforms are key factors contributing to this growth.
Key Barriers and Challenges: Regulatory uncertainties, intense competition among ride-hailing platforms, and infrastructure limitations in certain areas pose significant challenges. Driver shortages, safety concerns, and the need for continuous technological upgrades also hinder industry growth. For instance, varying regulations across countries result in increased operational complexities for companies seeking regional expansion. Driver income inequality and safety concerns are also impactful challenges.
Emerging Opportunities in ASEAN Taxi Industry
Untapped markets in rural areas and the growing demand for specialized transportation services present significant opportunities. The integration of autonomous vehicles and the adoption of sustainable transportation solutions offer potential for long-term growth. Evolving consumer preferences towards personalized experiences and enhanced safety features provide further avenues for market expansion.
Growth Accelerators in the ASEAN Taxi Industry Industry
Technological advancements in autonomous driving, electric vehicles, and AI-powered dispatch systems are key growth accelerators. Strategic partnerships between ride-hailing platforms and traditional taxi operators are facilitating market consolidation and expansion. Government initiatives to promote digitalization and improve transportation infrastructure further contribute to industry growth.
Key Players Shaping the ASEAN Taxi Industry Market
- TADA
- Ryde
- Didi
- Uber Technologies Inc
- Lyft Inc
- Public Cab Sdn Bhd
- PT Gojek
- Blue Cab Malaysia
- Grab Holdings Inc
Notable Milestones in ASEAN Taxi Industry Sector
- 2020: Grab Holdings Inc. launches its electric vehicle initiative in Singapore.
- 2021: Didi expands its operations into several new cities across the Philippines.
- 2022: Several new ride-sharing regulations are implemented in Malaysia.
- 2023: Gojek partners with a local car manufacturer to introduce a new fleet of electric vehicles.
- 2024: Uber expands its food delivery services across Southeast Asia.
In-Depth ASEAN Taxi Industry Market Outlook
The ASEAN taxi industry is poised for continued growth, driven by technological advancements, evolving consumer preferences, and supportive government policies. The increasing adoption of electric and autonomous vehicles, coupled with strategic partnerships and market expansions, will create significant opportunities for growth. This report highlights the market's potential for innovation and sustainable development within the ASEAN region, offering valuable insights for strategic decision-making in this dynamic sector.
ASEAN Taxi Industry Segmentation
-
1. Booking Type
- 1.1. Online
- 1.2. Offline
-
2. Vehicle Type
- 2.1. Motorcycles
- 2.2. Cars
- 2.3. Other Vehicle Types
-
3. Service Type
- 3.1. Ride Hailing
- 3.2. Ride Sharing
ASEAN Taxi Industry Segmentation By Geography
-
1. North America
- 1.1. United States
- 1.2. Canada
- 1.3. Mexico
-
2. South America
- 2.1. Brazil
- 2.2. Argentina
- 2.3. Rest of South America
-
3. Europe
- 3.1. United Kingdom
- 3.2. Germany
- 3.3. France
- 3.4. Italy
- 3.5. Spain
- 3.6. Russia
- 3.7. Benelux
- 3.8. Nordics
- 3.9. Rest of Europe
-
4. Middle East & Africa
- 4.1. Turkey
- 4.2. Israel
- 4.3. GCC
- 4.4. North Africa
- 4.5. South Africa
- 4.6. Rest of Middle East & Africa
-
5. Asia Pacific
- 5.1. China
- 5.2. India
- 5.3. Japan
- 5.4. South Korea
- 5.5. ASEAN
- 5.6. Oceania
- 5.7. Rest of Asia Pacific
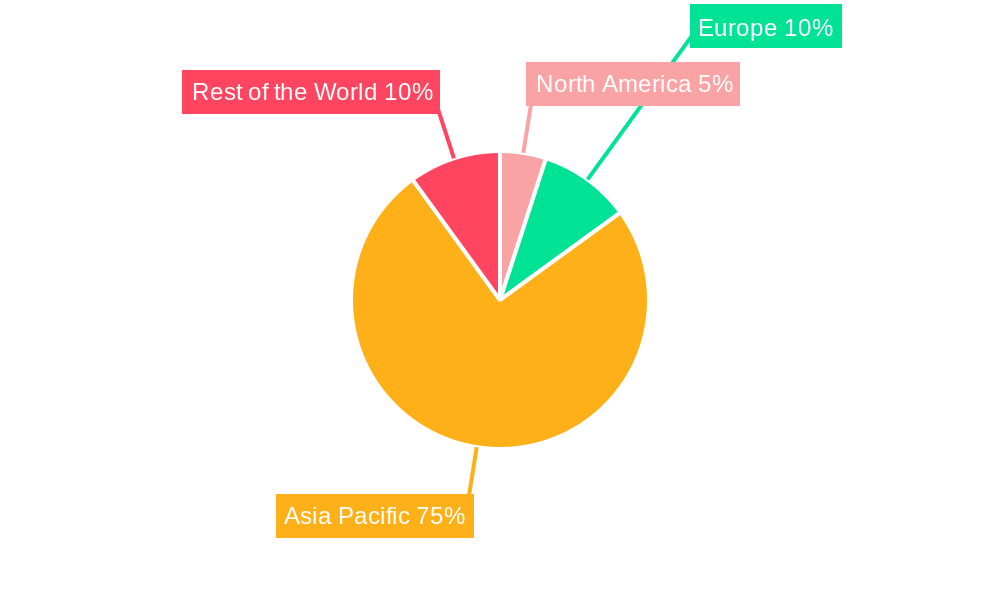
ASEAN Taxi Industry Regional Market Share
Geographic Coverage of ASEAN Taxi Industry
ASEAN Taxi Industry REPORT HIGHLIGHTS
| Aspects | Details |
|---|---|
| Study Period | 2020-2034 |
| Base Year | 2025 |
| Estimated Year | 2026 |
| Forecast Period | 2026-2034 |
| Historical Period | 2020-2025 |
| Growth Rate | CAGR of 7.40% from 2020-2034 |
| Segmentation |
|
Table of Contents
- 1. Introduction
- 1.1. Research Scope
- 1.2. Market Segmentation
- 1.3. Research Objective
- 1.4. Definitions and Assumptions
- 2. Executive Summary
- 2.1. Market Snapshot
- 3. Market Dynamics
- 3.1. Market Drivers
- 3.2. Market Restrains
- 3.3. Market Trends
- 3.4. Market Opportunities
- 4. Market Factor Analysis
- 4.1. Porters Five Forces
- 4.1.1. Bargaining Power of Suppliers
- 4.1.2. Bargaining Power of Buyers
- 4.1.3. Threat of New Entrants
- 4.1.4. Threat of Substitutes
- 4.1.5. Competitive Rivalry
- 4.2. PESTEL analysis
- 4.3. BCG Analysis
- 4.3.1. Stars (High Growth, High Market Share)
- 4.3.2. Cash Cows (Low Growth, High Market Share)
- 4.3.3. Question Mark (High Growth, Low Market Share)
- 4.3.4. Dogs (Low Growth, Low Market Share)
- 4.4. Ansoff Matrix Analysis
- 4.5. Supply Chain Analysis
- 4.6. Regulatory Landscape
- 4.7. Current Market Potential and Opportunity Assessment (TAM–SAM–SOM Framework)
- 4.8. IMR Analyst Note
- 4.1. Porters Five Forces
- 5. Market Analysis, Insights and Forecast 2021-2033
- 5.1. Market Analysis, Insights and Forecast - by Booking Type
- 5.1.1. Online
- 5.1.2. Offline
- 5.2. Market Analysis, Insights and Forecast - by Vehicle Type
- 5.2.1. Motorcycles
- 5.2.2. Cars
- 5.2.3. Other Vehicle Types
- 5.3. Market Analysis, Insights and Forecast - by Service Type
- 5.3.1. Ride Hailing
- 5.3.2. Ride Sharing
- 5.4. Market Analysis, Insights and Forecast - by Region
- 5.4.1. North America
- 5.4.2. South America
- 5.4.3. Europe
- 5.4.4. Middle East & Africa
- 5.4.5. Asia Pacific
- 5.1. Market Analysis, Insights and Forecast - by Booking Type
- 6. Global ASEAN Taxi Industry Analysis, Insights and Forecast, 2021-2033
- 6.1. Market Analysis, Insights and Forecast - by Booking Type
- 6.1.1. Online
- 6.1.2. Offline
- 6.2. Market Analysis, Insights and Forecast - by Vehicle Type
- 6.2.1. Motorcycles
- 6.2.2. Cars
- 6.2.3. Other Vehicle Types
- 6.3. Market Analysis, Insights and Forecast - by Service Type
- 6.3.1. Ride Hailing
- 6.3.2. Ride Sharing
- 6.1. Market Analysis, Insights and Forecast - by Booking Type
- 7. North America ASEAN Taxi Industry Analysis, Insights and Forecast, 2020-2032
- 7.1. Market Analysis, Insights and Forecast - by Booking Type
- 7.1.1. Online
- 7.1.2. Offline
- 7.2. Market Analysis, Insights and Forecast - by Vehicle Type
- 7.2.1. Motorcycles
- 7.2.2. Cars
- 7.2.3. Other Vehicle Types
- 7.3. Market Analysis, Insights and Forecast - by Service Type
- 7.3.1. Ride Hailing
- 7.3.2. Ride Sharing
- 7.1. Market Analysis, Insights and Forecast - by Booking Type
- 8. South America ASEAN Taxi Industry Analysis, Insights and Forecast, 2020-2032
- 8.1. Market Analysis, Insights and Forecast - by Booking Type
- 8.1.1. Online
- 8.1.2. Offline
- 8.2. Market Analysis, Insights and Forecast - by Vehicle Type
- 8.2.1. Motorcycles
- 8.2.2. Cars
- 8.2.3. Other Vehicle Types
- 8.3. Market Analysis, Insights and Forecast - by Service Type
- 8.3.1. Ride Hailing
- 8.3.2. Ride Sharing
- 8.1. Market Analysis, Insights and Forecast - by Booking Type
- 9. Europe ASEAN Taxi Industry Analysis, Insights and Forecast, 2020-2032
- 9.1. Market Analysis, Insights and Forecast - by Booking Type
- 9.1.1. Online
- 9.1.2. Offline
- 9.2. Market Analysis, Insights and Forecast - by Vehicle Type
- 9.2.1. Motorcycles
- 9.2.2. Cars
- 9.2.3. Other Vehicle Types
- 9.3. Market Analysis, Insights and Forecast - by Service Type
- 9.3.1. Ride Hailing
- 9.3.2. Ride Sharing
- 9.1. Market Analysis, Insights and Forecast - by Booking Type
- 10. Middle East & Africa ASEAN Taxi Industry Analysis, Insights and Forecast, 2020-2032
- 10.1. Market Analysis, Insights and Forecast - by Booking Type
- 10.1.1. Online
- 10.1.2. Offline
- 10.2. Market Analysis, Insights and Forecast - by Vehicle Type
- 10.2.1. Motorcycles
- 10.2.2. Cars
- 10.2.3. Other Vehicle Types
- 10.3. Market Analysis, Insights and Forecast - by Service Type
- 10.3.1. Ride Hailing
- 10.3.2. Ride Sharing
- 10.1. Market Analysis, Insights and Forecast - by Booking Type
- 11. Asia Pacific ASEAN Taxi Industry Analysis, Insights and Forecast, 2020-2032
- 11.1. Market Analysis, Insights and Forecast - by Booking Type
- 11.1.1. Online
- 11.1.2. Offline
- 11.2. Market Analysis, Insights and Forecast - by Vehicle Type
- 11.2.1. Motorcycles
- 11.2.2. Cars
- 11.2.3. Other Vehicle Types
- 11.3. Market Analysis, Insights and Forecast - by Service Type
- 11.3.1. Ride Hailing
- 11.3.2. Ride Sharing
- 11.1. Market Analysis, Insights and Forecast - by Booking Type
- 12. Competitive Analysis
- 12.1. Company Profiles
- 12.1.1 TADA
- 12.1.1.1. Company Overview
- 12.1.1.2. Products
- 12.1.1.3. Company Financials
- 12.1.1.4. SWOT Analysis
- 12.1.2 Ryde
- 12.1.2.1. Company Overview
- 12.1.2.2. Products
- 12.1.2.3. Company Financials
- 12.1.2.4. SWOT Analysis
- 12.1.3 Didi
- 12.1.3.1. Company Overview
- 12.1.3.2. Products
- 12.1.3.3. Company Financials
- 12.1.3.4. SWOT Analysis
- 12.1.4 Uber Technologies Inc
- 12.1.4.1. Company Overview
- 12.1.4.2. Products
- 12.1.4.3. Company Financials
- 12.1.4.4. SWOT Analysis
- 12.1.5 Lyft Inc
- 12.1.5.1. Company Overview
- 12.1.5.2. Products
- 12.1.5.3. Company Financials
- 12.1.5.4. SWOT Analysis
- 12.1.6 Public Cab Sdn Bhd
- 12.1.6.1. Company Overview
- 12.1.6.2. Products
- 12.1.6.3. Company Financials
- 12.1.6.4. SWOT Analysis
- 12.1.7 PT Gojek
- 12.1.7.1. Company Overview
- 12.1.7.2. Products
- 12.1.7.3. Company Financials
- 12.1.7.4. SWOT Analysis
- 12.1.8 Blue Cab Malaysi
- 12.1.8.1. Company Overview
- 12.1.8.2. Products
- 12.1.8.3. Company Financials
- 12.1.8.4. SWOT Analysis
- 12.1.9 Grab Holdings Inc
- 12.1.9.1. Company Overview
- 12.1.9.2. Products
- 12.1.9.3. Company Financials
- 12.1.9.4. SWOT Analysis
- 12.1.1 TADA
- 12.2. Market Entropy
- 12.2.1 Company's Key Areas Served
- 12.2.2 Recent Developments
- 12.3. Company Market Share Analysis 2025
- 12.3.1 Top 5 Companies Market Share Analysis
- 12.3.2 Top 3 Companies Market Share Analysis
- 12.4. List of Potential Customers
- 13. Research Methodology
List of Figures
- Figure 1: Global ASEAN Taxi Industry Revenue Breakdown (Million, %) by Region 2025 & 2033
- Figure 2: North America ASEAN Taxi Industry Revenue (Million), by Booking Type 2025 & 2033
- Figure 3: North America ASEAN Taxi Industry Revenue Share (%), by Booking Type 2025 & 2033
- Figure 4: North America ASEAN Taxi Industry Revenue (Million), by Vehicle Type 2025 & 2033
- Figure 5: North America ASEAN Taxi Industry Revenue Share (%), by Vehicle Type 2025 & 2033
- Figure 6: North America ASEAN Taxi Industry Revenue (Million), by Service Type 2025 & 2033
- Figure 7: North America ASEAN Taxi Industry Revenue Share (%), by Service Type 2025 & 2033
- Figure 8: North America ASEAN Taxi Industry Revenue (Million), by Country 2025 & 2033
- Figure 9: North America ASEAN Taxi Industry Revenue Share (%), by Country 2025 & 2033
- Figure 10: South America ASEAN Taxi Industry Revenue (Million), by Booking Type 2025 & 2033
- Figure 11: South America ASEAN Taxi Industry Revenue Share (%), by Booking Type 2025 & 2033
- Figure 12: South America ASEAN Taxi Industry Revenue (Million), by Vehicle Type 2025 & 2033
- Figure 13: South America ASEAN Taxi Industry Revenue Share (%), by Vehicle Type 2025 & 2033
- Figure 14: South America ASEAN Taxi Industry Revenue (Million), by Service Type 2025 & 2033
- Figure 15: South America ASEAN Taxi Industry Revenue Share (%), by Service Type 2025 & 2033
- Figure 16: South America ASEAN Taxi Industry Revenue (Million), by Country 2025 & 2033
- Figure 17: South America ASEAN Taxi Industry Revenue Share (%), by Country 2025 & 2033
- Figure 18: Europe ASEAN Taxi Industry Revenue (Million), by Booking Type 2025 & 2033
- Figure 19: Europe ASEAN Taxi Industry Revenue Share (%), by Booking Type 2025 & 2033
- Figure 20: Europe ASEAN Taxi Industry Revenue (Million), by Vehicle Type 2025 & 2033
- Figure 21: Europe ASEAN Taxi Industry Revenue Share (%), by Vehicle Type 2025 & 2033
- Figure 22: Europe ASEAN Taxi Industry Revenue (Million), by Service Type 2025 & 2033
- Figure 23: Europe ASEAN Taxi Industry Revenue Share (%), by Service Type 2025 & 2033
- Figure 24: Europe ASEAN Taxi Industry Revenue (Million), by Country 2025 & 2033
- Figure 25: Europe ASEAN Taxi Industry Revenue Share (%), by Country 2025 & 2033
- Figure 26: Middle East & Africa ASEAN Taxi Industry Revenue (Million), by Booking Type 2025 & 2033
- Figure 27: Middle East & Africa ASEAN Taxi Industry Revenue Share (%), by Booking Type 2025 & 2033
- Figure 28: Middle East & Africa ASEAN Taxi Industry Revenue (Million), by Vehicle Type 2025 & 2033
- Figure 29: Middle East & Africa ASEAN Taxi Industry Revenue Share (%), by Vehicle Type 2025 & 2033
- Figure 30: Middle East & Africa ASEAN Taxi Industry Revenue (Million), by Service Type 2025 & 2033
- Figure 31: Middle East & Africa ASEAN Taxi Industry Revenue Share (%), by Service Type 2025 & 2033
- Figure 32: Middle East & Africa ASEAN Taxi Industry Revenue (Million), by Country 2025 & 2033
- Figure 33: Middle East & Africa ASEAN Taxi Industry Revenue Share (%), by Country 2025 & 2033
- Figure 34: Asia Pacific ASEAN Taxi Industry Revenue (Million), by Booking Type 2025 & 2033
- Figure 35: Asia Pacific ASEAN Taxi Industry Revenue Share (%), by Booking Type 2025 & 2033
- Figure 36: Asia Pacific ASEAN Taxi Industry Revenue (Million), by Vehicle Type 2025 & 2033
- Figure 37: Asia Pacific ASEAN Taxi Industry Revenue Share (%), by Vehicle Type 2025 & 2033
- Figure 38: Asia Pacific ASEAN Taxi Industry Revenue (Million), by Service Type 2025 & 2033
- Figure 39: Asia Pacific ASEAN Taxi Industry Revenue Share (%), by Service Type 2025 & 2033
- Figure 40: Asia Pacific ASEAN Taxi Industry Revenue (Million), by Country 2025 & 2033
- Figure 41: Asia Pacific ASEAN Taxi Industry Revenue Share (%), by Country 2025 & 2033
List of Tables
- Table 1: Global ASEAN Taxi Industry Revenue Million Forecast, by Booking Type 2020 & 2033
- Table 2: Global ASEAN Taxi Industry Revenue Million Forecast, by Vehicle Type 2020 & 2033
- Table 3: Global ASEAN Taxi Industry Revenue Million Forecast, by Service Type 2020 & 2033
- Table 4: Global ASEAN Taxi Industry Revenue Million Forecast, by Region 2020 & 2033
- Table 5: Global ASEAN Taxi Industry Revenue Million Forecast, by Booking Type 2020 & 2033
- Table 6: Global ASEAN Taxi Industry Revenue Million Forecast, by Vehicle Type 2020 & 2033
- Table 7: Global ASEAN Taxi Industry Revenue Million Forecast, by Service Type 2020 & 2033
- Table 8: Global ASEAN Taxi Industry Revenue Million Forecast, by Country 2020 & 2033
- Table 9: United States ASEAN Taxi Industry Revenue (Million) Forecast, by Application 2020 & 2033
- Table 10: Canada ASEAN Taxi Industry Revenue (Million) Forecast, by Application 2020 & 2033
- Table 11: Mexico ASEAN Taxi Industry Revenue (Million) Forecast, by Application 2020 & 2033
- Table 12: Global ASEAN Taxi Industry Revenue Million Forecast, by Booking Type 2020 & 2033
- Table 13: Global ASEAN Taxi Industry Revenue Million Forecast, by Vehicle Type 2020 & 2033
- Table 14: Global ASEAN Taxi Industry Revenue Million Forecast, by Service Type 2020 & 2033
- Table 15: Global ASEAN Taxi Industry Revenue Million Forecast, by Country 2020 & 2033
- Table 16: Brazil ASEAN Taxi Industry Revenue (Million) Forecast, by Application 2020 & 2033
- Table 17: Argentina ASEAN Taxi Industry Revenue (Million) Forecast, by Application 2020 & 2033
- Table 18: Rest of South America ASEAN Taxi Industry Revenue (Million) Forecast, by Application 2020 & 2033
- Table 19: Global ASEAN Taxi Industry Revenue Million Forecast, by Booking Type 2020 & 2033
- Table 20: Global ASEAN Taxi Industry Revenue Million Forecast, by Vehicle Type 2020 & 2033
- Table 21: Global ASEAN Taxi Industry Revenue Million Forecast, by Service Type 2020 & 2033
- Table 22: Global ASEAN Taxi Industry Revenue Million Forecast, by Country 2020 & 2033
- Table 23: United Kingdom ASEAN Taxi Industry Revenue (Million) Forecast, by Application 2020 & 2033
- Table 24: Germany ASEAN Taxi Industry Revenue (Million) Forecast, by Application 2020 & 2033
- Table 25: France ASEAN Taxi Industry Revenue (Million) Forecast, by Application 2020 & 2033
- Table 26: Italy ASEAN Taxi Industry Revenue (Million) Forecast, by Application 2020 & 2033
- Table 27: Spain ASEAN Taxi Industry Revenue (Million) Forecast, by Application 2020 & 2033
- Table 28: Russia ASEAN Taxi Industry Revenue (Million) Forecast, by Application 2020 & 2033
- Table 29: Benelux ASEAN Taxi Industry Revenue (Million) Forecast, by Application 2020 & 2033
- Table 30: Nordics ASEAN Taxi Industry Revenue (Million) Forecast, by Application 2020 & 2033
- Table 31: Rest of Europe ASEAN Taxi Industry Revenue (Million) Forecast, by Application 2020 & 2033
- Table 32: Global ASEAN Taxi Industry Revenue Million Forecast, by Booking Type 2020 & 2033
- Table 33: Global ASEAN Taxi Industry Revenue Million Forecast, by Vehicle Type 2020 & 2033
- Table 34: Global ASEAN Taxi Industry Revenue Million Forecast, by Service Type 2020 & 2033
- Table 35: Global ASEAN Taxi Industry Revenue Million Forecast, by Country 2020 & 2033
- Table 36: Turkey ASEAN Taxi Industry Revenue (Million) Forecast, by Application 2020 & 2033
- Table 37: Israel ASEAN Taxi Industry Revenue (Million) Forecast, by Application 2020 & 2033
- Table 38: GCC ASEAN Taxi Industry Revenue (Million) Forecast, by Application 2020 & 2033
- Table 39: North Africa ASEAN Taxi Industry Revenue (Million) Forecast, by Application 2020 & 2033
- Table 40: South Africa ASEAN Taxi Industry Revenue (Million) Forecast, by Application 2020 & 2033
- Table 41: Rest of Middle East & Africa ASEAN Taxi Industry Revenue (Million) Forecast, by Application 2020 & 2033
- Table 42: Global ASEAN Taxi Industry Revenue Million Forecast, by Booking Type 2020 & 2033
- Table 43: Global ASEAN Taxi Industry Revenue Million Forecast, by Vehicle Type 2020 & 2033
- Table 44: Global ASEAN Taxi Industry Revenue Million Forecast, by Service Type 2020 & 2033
- Table 45: Global ASEAN Taxi Industry Revenue Million Forecast, by Country 2020 & 2033
- Table 46: China ASEAN Taxi Industry Revenue (Million) Forecast, by Application 2020 & 2033
- Table 47: India ASEAN Taxi Industry Revenue (Million) Forecast, by Application 2020 & 2033
- Table 48: Japan ASEAN Taxi Industry Revenue (Million) Forecast, by Application 2020 & 2033
- Table 49: South Korea ASEAN Taxi Industry Revenue (Million) Forecast, by Application 2020 & 2033
- Table 50: ASEAN ASEAN Taxi Industry Revenue (Million) Forecast, by Application 2020 & 2033
- Table 51: Oceania ASEAN Taxi Industry Revenue (Million) Forecast, by Application 2020 & 2033
- Table 52: Rest of Asia Pacific ASEAN Taxi Industry Revenue (Million) Forecast, by Application 2020 & 2033
Frequently Asked Questions
1. What is the projected Compound Annual Growth Rate (CAGR) of the ASEAN Taxi Industry?
The projected CAGR is approximately 7.40%.
2. Which companies are prominent players in the ASEAN Taxi Industry?
Key companies in the market include TADA, Ryde, Didi, Uber Technologies Inc, Lyft Inc, Public Cab Sdn Bhd, PT Gojek, Blue Cab Malaysi, Grab Holdings Inc.
3. What are the main segments of the ASEAN Taxi Industry?
The market segments include Booking Type, Vehicle Type, Service Type.
4. Can you provide details about the market size?
The market size is estimated to be USD 22.70 Million as of 2022.
5. What are some drivers contributing to market growth?
Increasing Demand From Online Channel.
6. What are the notable trends driving market growth?
Increasing Penetration of Online Channels for Booking Taxis.
7. Are there any restraints impacting market growth?
Increasing Traffic Problems And Reliability Issues.
8. Can you provide examples of recent developments in the market?
N/A
9. What pricing options are available for accessing the report?
Pricing options include single-user, multi-user, and enterprise licenses priced at USD 3800, USD 4500, and USD 5800 respectively.
10. Is the market size provided in terms of value or volume?
The market size is provided in terms of value, measured in Million.
11. Are there any specific market keywords associated with the report?
Yes, the market keyword associated with the report is "ASEAN Taxi Industry," which aids in identifying and referencing the specific market segment covered.
12. How do I determine which pricing option suits my needs best?
The pricing options vary based on user requirements and access needs. Individual users may opt for single-user licenses, while businesses requiring broader access may choose multi-user or enterprise licenses for cost-effective access to the report.
13. Are there any additional resources or data provided in the ASEAN Taxi Industry report?
While the report offers comprehensive insights, it's advisable to review the specific contents or supplementary materials provided to ascertain if additional resources or data are available.
14. How can I stay updated on further developments or reports in the ASEAN Taxi Industry?
To stay informed about further developments, trends, and reports in the ASEAN Taxi Industry, consider subscribing to industry newsletters, following relevant companies and organizations, or regularly checking reputable industry news sources and publications.
Methodology
Step 1 - Identification of Relevant Samples Size from Population Database


Step 2 - Approaches for Defining Global Market Size (Value, Volume* & Price*)

Note*: In applicable scenarios
Step 3 - Data Sources
Primary Research
- Web Analytics
- Survey Reports
- Research Institute
- Latest Research Reports
- Opinion Leaders
Secondary Research
- Annual Reports
- White Paper
- Latest Press Release
- Industry Association
- Paid Database
- Investor Presentations

Step 4 - Data Triangulation
Involves using different sources of information in order to increase the validity of a study
These sources are likely to be stakeholders in a program - participants, other researchers, program staff, other community members, and so on.
Then we put all data in single framework & apply various statistical tools to find out the dynamic on the market.
During the analysis stage, feedback from the stakeholder groups would be compared to determine areas of agreement as well as areas of divergence