

Key Insights
The global bar top cork market, though specialized, is poised for significant expansion. This growth is propelled by the dynamic craft beverage sector and a growing consumer inclination towards natural and sustainable packaging solutions. The market, valued at $0.5 billion in the 2024 base year, is forecast to grow at a Compound Annual Growth Rate (CAGR) of 6% from 2024 to 2033. This upward trajectory is underpinned by the escalating popularity of craft beers, wines, and spirits, particularly among discerning consumers prioritizing authenticity and environmental responsibility. The ongoing premiumization trend in the beverage industry further stimulates demand for high-quality, visually appealing closures like bar top corks, enhancing brand perception and consumer experience. Leading industry participants such as ACIC Cork and Closures, Corticeira Amorim, and Guala Closures Group are actively investing in product development and market reach to capitalize on this burgeoning demand.
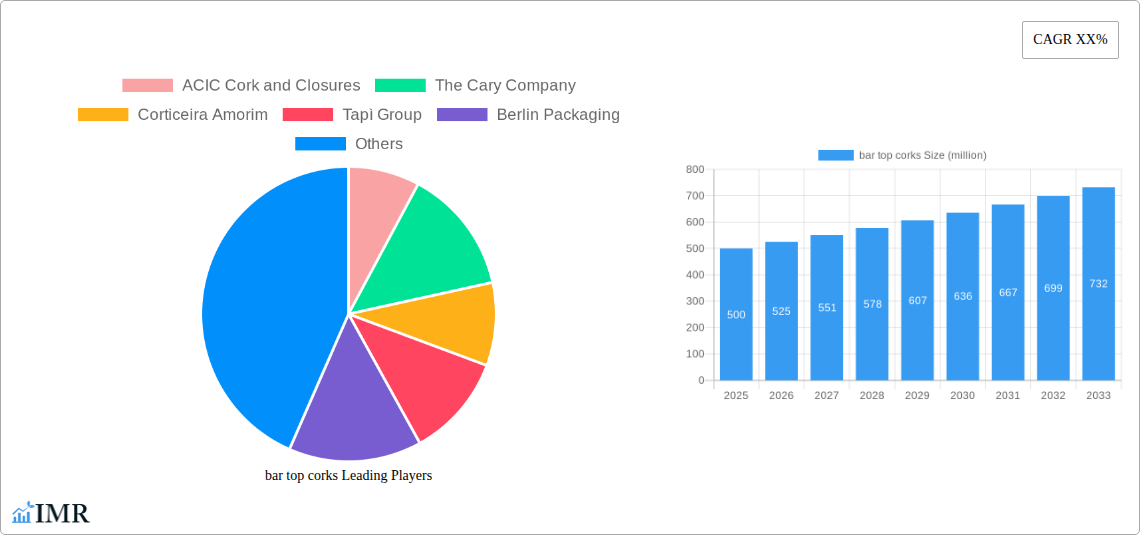
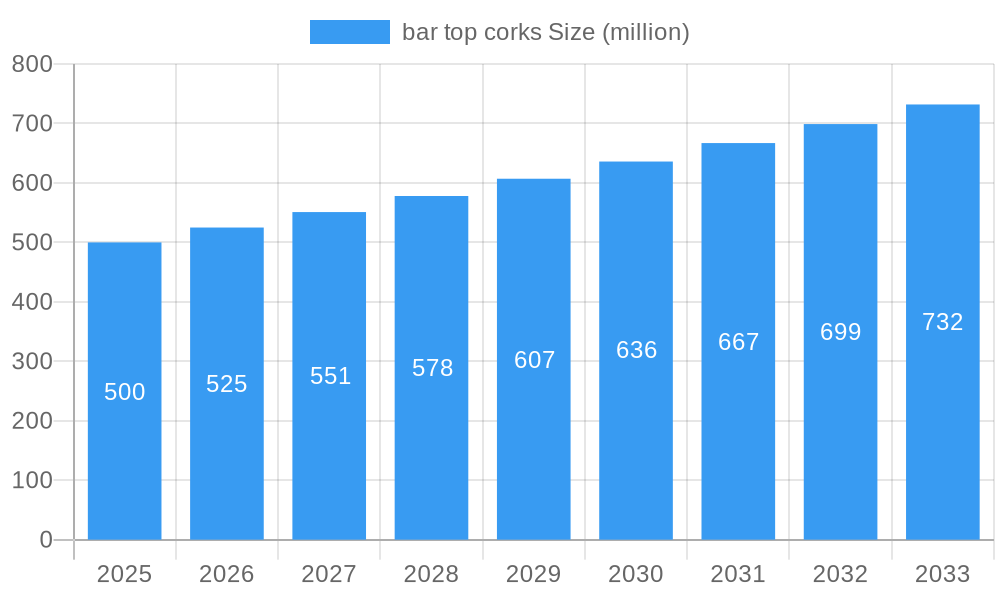
bar top corks Market Size (In Million)
Despite its promising outlook, the market confronts specific challenges. Volatility in cork pricing, influenced by raw material availability and environmental conditions, can affect profitability. The persistent competition from alternative closure materials, including plastic and metal caps, presents an ongoing hurdle. To navigate these restraints, manufacturers are prioritizing the development of innovative cork materials and advanced production techniques to bolster sustainability and optimize cost-efficiency. Strategic market diversification into premium segments and fostering robust partnerships within the beverage ecosystem are critical for sustained market growth. Regional consumption trends and regulatory frameworks necessitate adaptive strategies from market players. While North America and Europe currently dominate market share, emerging economies in Asia and Latin America offer substantial opportunities for future penetration and expansion.
bar top corks Company Market Share
Bar Top Corks Market Report: 2019-2033
This comprehensive report provides an in-depth analysis of the global bar top corks market, encompassing historical data (2019-2024), current estimations (2025), and future projections (2025-2033). Targeting industry professionals in the wine and spirits, packaging, and hospitality sectors, this report offers invaluable insights into market dynamics, growth trends, key players, and emerging opportunities. The study period covers 2019-2033, with 2025 serving as both the base and estimated year. The report analyzes xx million units of bar top corks in the global market.
Bar Top Corks Market Dynamics & Structure
This section delves into the intricate structure of the bar top corks market, analyzing market concentration, technological innovation, regulatory landscapes, competitive substitutes, and end-user demographics. We examine M&A activities within the industry, providing both qualitative and quantitative insights.
- Market Concentration: The market is moderately concentrated, with the top five players holding an estimated xx% market share in 2025. This is expected to slightly decrease to xx% by 2033 due to increased competition from smaller, specialized companies.
- Technological Innovation: Innovation focuses on sustainable materials (e.g., recycled cork), improved sealing technologies, and enhanced aesthetics (e.g., custom designs, unique shapes). However, high R&D costs and established industry practices pose significant barriers to innovation.
- Regulatory Frameworks: Regulations concerning food safety and material sourcing significantly impact the industry. Compliance costs vary across regions and influence production and pricing.
- Competitive Product Substitutes: Plastic and synthetic corks represent the primary substitutes, impacting market share through cost-competitiveness and availability. However, growing consumer preference for natural and sustainable products creates a countervailing force.
- End-User Demographics: The primary end-users are wineries, breweries, distilleries, and high-end bars and restaurants. Changing consumer preferences and the growing demand for premium alcoholic beverages drive market growth.
- M&A Trends: The past five years have witnessed xx M&A deals, primarily driven by strategies for market expansion and product diversification. The average deal size is estimated at xx million USD.
Bar Top Corks Growth Trends & Insights
Analyzing market size evolution, adoption rates, technological disruptions, and shifts in consumer behavior, this section provides a detailed understanding of the bar top corks market's trajectory.
The global bar top corks market experienced a CAGR of xx% during the historical period (2019-2024), driven primarily by the rising demand for premium alcoholic beverages and the increasing popularity of craft breweries and distilleries. The market size is projected to reach xx million units by 2025 and xx million units by 2033, exhibiting a CAGR of xx% during the forecast period (2025-2033). Increased consumer awareness of sustainability and the associated preference for natural corks over synthetic alternatives are also contributing factors to this growth. However, economic downturns and fluctuations in raw material prices pose challenges to consistent growth. Technological advancements such as improved sealing mechanisms and aesthetically pleasing designs are driving market penetration among premium spirit brands, further boosting demand.
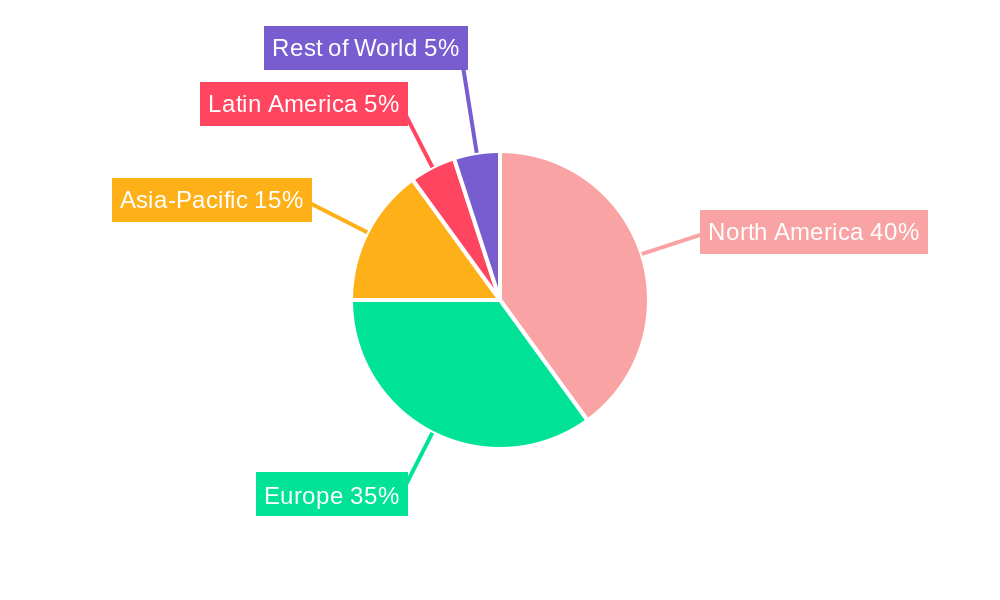
Dominant Regions, Countries, or Segments in Bar Top Corks
This section identifies the leading regions and segments driving market growth.
The North American region holds the largest market share in 2025, accounting for approximately xx% of the global market. This dominance is attributed to:
- High disposable incomes: A strong purchasing power fuels demand for premium alcoholic beverages.
- Established wine and spirits industry: A mature industry provides a strong foundation for bar top cork adoption.
- Favorable regulatory environment: Supportive policies encourage innovation and market growth.
Europe is also a significant market, representing approximately xx% of the global market in 2025. While growth rates may be slower compared to other regions, the established wine production and robust tourism sector contribute to the market's consistent performance. Asia-Pacific is exhibiting the fastest growth rate, driven by increasing consumption of alcoholic beverages and rising disposable incomes in emerging economies.
Bar Top Corks Product Landscape
Bar top corks are available in various sizes, shapes, and materials, catering to diverse needs across the wine and spirits industry. Innovations focus on improved sealing performance and sustainable materials, such as recycled cork, to meet environmental concerns and consumer demand. The market also features premium corks with unique finishes and designs, enhancing the aesthetic appeal for high-end products. These enhanced features differentiate products and command higher prices.
Key Drivers, Barriers & Challenges in Bar Top Corks
Key Drivers:
- Growing demand for premium alcoholic beverages.
- Rising consumer preference for natural and sustainable products.
- Technological advancements in cork production and sealing.
Key Challenges:
- Fluctuations in raw material (cork) prices.
- Intense competition from synthetic cork alternatives.
- Potential supply chain disruptions.
Emerging Opportunities in Bar Top Corks
Emerging opportunities include expanding into untapped markets in developing economies, exploring innovative applications in craft spirits, and catering to evolving consumer preferences for personalized and sustainable products. The potential lies in developing new, eco-friendly materials and customizing cork designs to meet the specific needs of premium brands.
Growth Accelerators in the Bar Top Corks Industry
Strategic partnerships, mergers and acquisitions, expansion into emerging markets, and the development of sustainable manufacturing processes all contribute to sustained market growth. Technological innovation in sealing technology and eco-friendly materials is crucial for maintaining a competitive edge.
Key Players Shaping the Bar Top Corks Market
- ACIC Cork and Closures
- The Cary Company
- Corticeira Amorim
- Tapì Group
- Berlin Packaging
- WidgetCo
- Bottle Express
- Vinolok Closure
- W. Langguth Erben GmbH
- Guala Closures Group
Notable Milestones in Bar Top Corks Sector
- 2020: Increased adoption of sustainable cork sourcing practices by major players.
- 2022: Launch of a new generation of high-performance bar top corks with improved sealing technology.
- 2023: Significant investment in R&D for developing bio-based cork alternatives.
In-Depth Bar Top Corks Market Outlook
The future of the bar top corks market looks promising, driven by consistent growth in the premium alcoholic beverage sector and the increasing emphasis on sustainability. Strategic partnerships and innovations in cork materials and production processes will be key to unlocking the full potential of this market. The focus on eco-friendly solutions presents a significant opportunity for manufacturers to capture a larger market share by appealing to environmentally conscious consumers.
bar top corks Segmentation
-
1. Application
- 1.1. Food and Beverages
- 1.2. Oil and Lubricants
- 1.3. Chemicals Solvents
- 1.4. Pharmaceuticals and Healthcare
- 1.5. Paints and Dyes
- 1.6. Others
-
2. Types
- 2.1. Gloss or Matte Finish
- 2.2. Embossed Finish
- 2.3. Others
bar top corks Segmentation By Geography
-
1. North America
- 1.1. United States
- 1.2. Canada
- 1.3. Mexico
-
2. South America
- 2.1. Brazil
- 2.2. Argentina
- 2.3. Rest of South America
-
3. Europe
- 3.1. United Kingdom
- 3.2. Germany
- 3.3. France
- 3.4. Italy
- 3.5. Spain
- 3.6. Russia
- 3.7. Benelux
- 3.8. Nordics
- 3.9. Rest of Europe
-
4. Middle East & Africa
- 4.1. Turkey
- 4.2. Israel
- 4.3. GCC
- 4.4. North Africa
- 4.5. South Africa
- 4.6. Rest of Middle East & Africa
-
5. Asia Pacific
- 5.1. China
- 5.2. India
- 5.3. Japan
- 5.4. South Korea
- 5.5. ASEAN
- 5.6. Oceania
- 5.7. Rest of Asia Pacific
bar top corks Regional Market Share
Geographic Coverage of bar top corks
bar top corks REPORT HIGHLIGHTS
| Aspects | Details |
|---|---|
| Study Period | 2020-2034 |
| Base Year | 2025 |
| Estimated Year | 2026 |
| Forecast Period | 2026-2034 |
| Historical Period | 2020-2025 |
| Growth Rate | CAGR of 6% from 2020-2034 |
| Segmentation |
|
Table of Contents
- 1. Introduction
- 1.1. Research Scope
- 1.2. Market Segmentation
- 1.3. Research Methodology
- 1.4. Definitions and Assumptions
- 2. Executive Summary
- 2.1. Introduction
- 3. Market Dynamics
- 3.1. Introduction
- 3.2. Market Drivers
- 3.3. Market Restrains
- 3.4. Market Trends
- 4. Market Factor Analysis
- 4.1. Porters Five Forces
- 4.2. Supply/Value Chain
- 4.3. PESTEL analysis
- 4.4. Market Entropy
- 4.5. Patent/Trademark Analysis
- 5. Global bar top corks Analysis, Insights and Forecast, 2020-2032
- 5.1. Market Analysis, Insights and Forecast - by Application
- 5.1.1. Food and Beverages
- 5.1.2. Oil and Lubricants
- 5.1.3. Chemicals Solvents
- 5.1.4. Pharmaceuticals and Healthcare
- 5.1.5. Paints and Dyes
- 5.1.6. Others
- 5.2. Market Analysis, Insights and Forecast - by Types
- 5.2.1. Gloss or Matte Finish
- 5.2.2. Embossed Finish
- 5.2.3. Others
- 5.3. Market Analysis, Insights and Forecast - by Region
- 5.3.1. North America
- 5.3.2. South America
- 5.3.3. Europe
- 5.3.4. Middle East & Africa
- 5.3.5. Asia Pacific
- 5.1. Market Analysis, Insights and Forecast - by Application
- 6. North America bar top corks Analysis, Insights and Forecast, 2020-2032
- 6.1. Market Analysis, Insights and Forecast - by Application
- 6.1.1. Food and Beverages
- 6.1.2. Oil and Lubricants
- 6.1.3. Chemicals Solvents
- 6.1.4. Pharmaceuticals and Healthcare
- 6.1.5. Paints and Dyes
- 6.1.6. Others
- 6.2. Market Analysis, Insights and Forecast - by Types
- 6.2.1. Gloss or Matte Finish
- 6.2.2. Embossed Finish
- 6.2.3. Others
- 6.1. Market Analysis, Insights and Forecast - by Application
- 7. South America bar top corks Analysis, Insights and Forecast, 2020-2032
- 7.1. Market Analysis, Insights and Forecast - by Application
- 7.1.1. Food and Beverages
- 7.1.2. Oil and Lubricants
- 7.1.3. Chemicals Solvents
- 7.1.4. Pharmaceuticals and Healthcare
- 7.1.5. Paints and Dyes
- 7.1.6. Others
- 7.2. Market Analysis, Insights and Forecast - by Types
- 7.2.1. Gloss or Matte Finish
- 7.2.2. Embossed Finish
- 7.2.3. Others
- 7.1. Market Analysis, Insights and Forecast - by Application
- 8. Europe bar top corks Analysis, Insights and Forecast, 2020-2032
- 8.1. Market Analysis, Insights and Forecast - by Application
- 8.1.1. Food and Beverages
- 8.1.2. Oil and Lubricants
- 8.1.3. Chemicals Solvents
- 8.1.4. Pharmaceuticals and Healthcare
- 8.1.5. Paints and Dyes
- 8.1.6. Others
- 8.2. Market Analysis, Insights and Forecast - by Types
- 8.2.1. Gloss or Matte Finish
- 8.2.2. Embossed Finish
- 8.2.3. Others
- 8.1. Market Analysis, Insights and Forecast - by Application
- 9. Middle East & Africa bar top corks Analysis, Insights and Forecast, 2020-2032
- 9.1. Market Analysis, Insights and Forecast - by Application
- 9.1.1. Food and Beverages
- 9.1.2. Oil and Lubricants
- 9.1.3. Chemicals Solvents
- 9.1.4. Pharmaceuticals and Healthcare
- 9.1.5. Paints and Dyes
- 9.1.6. Others
- 9.2. Market Analysis, Insights and Forecast - by Types
- 9.2.1. Gloss or Matte Finish
- 9.2.2. Embossed Finish
- 9.2.3. Others
- 9.1. Market Analysis, Insights and Forecast - by Application
- 10. Asia Pacific bar top corks Analysis, Insights and Forecast, 2020-2032
- 10.1. Market Analysis, Insights and Forecast - by Application
- 10.1.1. Food and Beverages
- 10.1.2. Oil and Lubricants
- 10.1.3. Chemicals Solvents
- 10.1.4. Pharmaceuticals and Healthcare
- 10.1.5. Paints and Dyes
- 10.1.6. Others
- 10.2. Market Analysis, Insights and Forecast - by Types
- 10.2.1. Gloss or Matte Finish
- 10.2.2. Embossed Finish
- 10.2.3. Others
- 10.1. Market Analysis, Insights and Forecast - by Application
- 11. Competitive Analysis
- 11.1. Global Market Share Analysis 2025
- 11.2. Company Profiles
- 11.2.1 ACIC Cork and Closures
- 11.2.1.1. Overview
- 11.2.1.2. Products
- 11.2.1.3. SWOT Analysis
- 11.2.1.4. Recent Developments
- 11.2.1.5. Financials (Based on Availability)
- 11.2.2 The Cary Company
- 11.2.2.1. Overview
- 11.2.2.2. Products
- 11.2.2.3. SWOT Analysis
- 11.2.2.4. Recent Developments
- 11.2.2.5. Financials (Based on Availability)
- 11.2.3 Corticeira Amorim
- 11.2.3.1. Overview
- 11.2.3.2. Products
- 11.2.3.3. SWOT Analysis
- 11.2.3.4. Recent Developments
- 11.2.3.5. Financials (Based on Availability)
- 11.2.4 Tapì Group
- 11.2.4.1. Overview
- 11.2.4.2. Products
- 11.2.4.3. SWOT Analysis
- 11.2.4.4. Recent Developments
- 11.2.4.5. Financials (Based on Availability)
- 11.2.5 Berlin Packaging
- 11.2.5.1. Overview
- 11.2.5.2. Products
- 11.2.5.3. SWOT Analysis
- 11.2.5.4. Recent Developments
- 11.2.5.5. Financials (Based on Availability)
- 11.2.6 WidgetCo
- 11.2.6.1. Overview
- 11.2.6.2. Products
- 11.2.6.3. SWOT Analysis
- 11.2.6.4. Recent Developments
- 11.2.6.5. Financials (Based on Availability)
- 11.2.7 Bottle Express
- 11.2.7.1. Overview
- 11.2.7.2. Products
- 11.2.7.3. SWOT Analysis
- 11.2.7.4. Recent Developments
- 11.2.7.5. Financials (Based on Availability)
- 11.2.8 Vinolok Closure
- 11.2.8.1. Overview
- 11.2.8.2. Products
- 11.2.8.3. SWOT Analysis
- 11.2.8.4. Recent Developments
- 11.2.8.5. Financials (Based on Availability)
- 11.2.9 W. Langguth Erben GmbH
- 11.2.9.1. Overview
- 11.2.9.2. Products
- 11.2.9.3. SWOT Analysis
- 11.2.9.4. Recent Developments
- 11.2.9.5. Financials (Based on Availability)
- 11.2.10 Guala Closures Group
- 11.2.10.1. Overview
- 11.2.10.2. Products
- 11.2.10.3. SWOT Analysis
- 11.2.10.4. Recent Developments
- 11.2.10.5. Financials (Based on Availability)
- 11.2.1 ACIC Cork and Closures
List of Figures
- Figure 1: Global bar top corks Revenue Breakdown (billion, %) by Region 2025 & 2033
- Figure 2: Global bar top corks Volume Breakdown (K, %) by Region 2025 & 2033
- Figure 3: North America bar top corks Revenue (billion), by Application 2025 & 2033
- Figure 4: North America bar top corks Volume (K), by Application 2025 & 2033
- Figure 5: North America bar top corks Revenue Share (%), by Application 2025 & 2033
- Figure 6: North America bar top corks Volume Share (%), by Application 2025 & 2033
- Figure 7: North America bar top corks Revenue (billion), by Types 2025 & 2033
- Figure 8: North America bar top corks Volume (K), by Types 2025 & 2033
- Figure 9: North America bar top corks Revenue Share (%), by Types 2025 & 2033
- Figure 10: North America bar top corks Volume Share (%), by Types 2025 & 2033
- Figure 11: North America bar top corks Revenue (billion), by Country 2025 & 2033
- Figure 12: North America bar top corks Volume (K), by Country 2025 & 2033
- Figure 13: North America bar top corks Revenue Share (%), by Country 2025 & 2033
- Figure 14: North America bar top corks Volume Share (%), by Country 2025 & 2033
- Figure 15: South America bar top corks Revenue (billion), by Application 2025 & 2033
- Figure 16: South America bar top corks Volume (K), by Application 2025 & 2033
- Figure 17: South America bar top corks Revenue Share (%), by Application 2025 & 2033
- Figure 18: South America bar top corks Volume Share (%), by Application 2025 & 2033
- Figure 19: South America bar top corks Revenue (billion), by Types 2025 & 2033
- Figure 20: South America bar top corks Volume (K), by Types 2025 & 2033
- Figure 21: South America bar top corks Revenue Share (%), by Types 2025 & 2033
- Figure 22: South America bar top corks Volume Share (%), by Types 2025 & 2033
- Figure 23: South America bar top corks Revenue (billion), by Country 2025 & 2033
- Figure 24: South America bar top corks Volume (K), by Country 2025 & 2033
- Figure 25: South America bar top corks Revenue Share (%), by Country 2025 & 2033
- Figure 26: South America bar top corks Volume Share (%), by Country 2025 & 2033
- Figure 27: Europe bar top corks Revenue (billion), by Application 2025 & 2033
- Figure 28: Europe bar top corks Volume (K), by Application 2025 & 2033
- Figure 29: Europe bar top corks Revenue Share (%), by Application 2025 & 2033
- Figure 30: Europe bar top corks Volume Share (%), by Application 2025 & 2033
- Figure 31: Europe bar top corks Revenue (billion), by Types 2025 & 2033
- Figure 32: Europe bar top corks Volume (K), by Types 2025 & 2033
- Figure 33: Europe bar top corks Revenue Share (%), by Types 2025 & 2033
- Figure 34: Europe bar top corks Volume Share (%), by Types 2025 & 2033
- Figure 35: Europe bar top corks Revenue (billion), by Country 2025 & 2033
- Figure 36: Europe bar top corks Volume (K), by Country 2025 & 2033
- Figure 37: Europe bar top corks Revenue Share (%), by Country 2025 & 2033
- Figure 38: Europe bar top corks Volume Share (%), by Country 2025 & 2033
- Figure 39: Middle East & Africa bar top corks Revenue (billion), by Application 2025 & 2033
- Figure 40: Middle East & Africa bar top corks Volume (K), by Application 2025 & 2033
- Figure 41: Middle East & Africa bar top corks Revenue Share (%), by Application 2025 & 2033
- Figure 42: Middle East & Africa bar top corks Volume Share (%), by Application 2025 & 2033
- Figure 43: Middle East & Africa bar top corks Revenue (billion), by Types 2025 & 2033
- Figure 44: Middle East & Africa bar top corks Volume (K), by Types 2025 & 2033
- Figure 45: Middle East & Africa bar top corks Revenue Share (%), by Types 2025 & 2033
- Figure 46: Middle East & Africa bar top corks Volume Share (%), by Types 2025 & 2033
- Figure 47: Middle East & Africa bar top corks Revenue (billion), by Country 2025 & 2033
- Figure 48: Middle East & Africa bar top corks Volume (K), by Country 2025 & 2033
- Figure 49: Middle East & Africa bar top corks Revenue Share (%), by Country 2025 & 2033
- Figure 50: Middle East & Africa bar top corks Volume Share (%), by Country 2025 & 2033
- Figure 51: Asia Pacific bar top corks Revenue (billion), by Application 2025 & 2033
- Figure 52: Asia Pacific bar top corks Volume (K), by Application 2025 & 2033
- Figure 53: Asia Pacific bar top corks Revenue Share (%), by Application 2025 & 2033
- Figure 54: Asia Pacific bar top corks Volume Share (%), by Application 2025 & 2033
- Figure 55: Asia Pacific bar top corks Revenue (billion), by Types 2025 & 2033
- Figure 56: Asia Pacific bar top corks Volume (K), by Types 2025 & 2033
- Figure 57: Asia Pacific bar top corks Revenue Share (%), by Types 2025 & 2033
- Figure 58: Asia Pacific bar top corks Volume Share (%), by Types 2025 & 2033
- Figure 59: Asia Pacific bar top corks Revenue (billion), by Country 2025 & 2033
- Figure 60: Asia Pacific bar top corks Volume (K), by Country 2025 & 2033
- Figure 61: Asia Pacific bar top corks Revenue Share (%), by Country 2025 & 2033
- Figure 62: Asia Pacific bar top corks Volume Share (%), by Country 2025 & 2033
List of Tables
- Table 1: Global bar top corks Revenue billion Forecast, by Application 2020 & 2033
- Table 2: Global bar top corks Volume K Forecast, by Application 2020 & 2033
- Table 3: Global bar top corks Revenue billion Forecast, by Types 2020 & 2033
- Table 4: Global bar top corks Volume K Forecast, by Types 2020 & 2033
- Table 5: Global bar top corks Revenue billion Forecast, by Region 2020 & 2033
- Table 6: Global bar top corks Volume K Forecast, by Region 2020 & 2033
- Table 7: Global bar top corks Revenue billion Forecast, by Application 2020 & 2033
- Table 8: Global bar top corks Volume K Forecast, by Application 2020 & 2033
- Table 9: Global bar top corks Revenue billion Forecast, by Types 2020 & 2033
- Table 10: Global bar top corks Volume K Forecast, by Types 2020 & 2033
- Table 11: Global bar top corks Revenue billion Forecast, by Country 2020 & 2033
- Table 12: Global bar top corks Volume K Forecast, by Country 2020 & 2033
- Table 13: United States bar top corks Revenue (billion) Forecast, by Application 2020 & 2033
- Table 14: United States bar top corks Volume (K) Forecast, by Application 2020 & 2033
- Table 15: Canada bar top corks Revenue (billion) Forecast, by Application 2020 & 2033
- Table 16: Canada bar top corks Volume (K) Forecast, by Application 2020 & 2033
- Table 17: Mexico bar top corks Revenue (billion) Forecast, by Application 2020 & 2033
- Table 18: Mexico bar top corks Volume (K) Forecast, by Application 2020 & 2033
- Table 19: Global bar top corks Revenue billion Forecast, by Application 2020 & 2033
- Table 20: Global bar top corks Volume K Forecast, by Application 2020 & 2033
- Table 21: Global bar top corks Revenue billion Forecast, by Types 2020 & 2033
- Table 22: Global bar top corks Volume K Forecast, by Types 2020 & 2033
- Table 23: Global bar top corks Revenue billion Forecast, by Country 2020 & 2033
- Table 24: Global bar top corks Volume K Forecast, by Country 2020 & 2033
- Table 25: Brazil bar top corks Revenue (billion) Forecast, by Application 2020 & 2033
- Table 26: Brazil bar top corks Volume (K) Forecast, by Application 2020 & 2033
- Table 27: Argentina bar top corks Revenue (billion) Forecast, by Application 2020 & 2033
- Table 28: Argentina bar top corks Volume (K) Forecast, by Application 2020 & 2033
- Table 29: Rest of South America bar top corks Revenue (billion) Forecast, by Application 2020 & 2033
- Table 30: Rest of South America bar top corks Volume (K) Forecast, by Application 2020 & 2033
- Table 31: Global bar top corks Revenue billion Forecast, by Application 2020 & 2033
- Table 32: Global bar top corks Volume K Forecast, by Application 2020 & 2033
- Table 33: Global bar top corks Revenue billion Forecast, by Types 2020 & 2033
- Table 34: Global bar top corks Volume K Forecast, by Types 2020 & 2033
- Table 35: Global bar top corks Revenue billion Forecast, by Country 2020 & 2033
- Table 36: Global bar top corks Volume K Forecast, by Country 2020 & 2033
- Table 37: United Kingdom bar top corks Revenue (billion) Forecast, by Application 2020 & 2033
- Table 38: United Kingdom bar top corks Volume (K) Forecast, by Application 2020 & 2033
- Table 39: Germany bar top corks Revenue (billion) Forecast, by Application 2020 & 2033
- Table 40: Germany bar top corks Volume (K) Forecast, by Application 2020 & 2033
- Table 41: France bar top corks Revenue (billion) Forecast, by Application 2020 & 2033
- Table 42: France bar top corks Volume (K) Forecast, by Application 2020 & 2033
- Table 43: Italy bar top corks Revenue (billion) Forecast, by Application 2020 & 2033
- Table 44: Italy bar top corks Volume (K) Forecast, by Application 2020 & 2033
- Table 45: Spain bar top corks Revenue (billion) Forecast, by Application 2020 & 2033
- Table 46: Spain bar top corks Volume (K) Forecast, by Application 2020 & 2033
- Table 47: Russia bar top corks Revenue (billion) Forecast, by Application 2020 & 2033
- Table 48: Russia bar top corks Volume (K) Forecast, by Application 2020 & 2033
- Table 49: Benelux bar top corks Revenue (billion) Forecast, by Application 2020 & 2033
- Table 50: Benelux bar top corks Volume (K) Forecast, by Application 2020 & 2033
- Table 51: Nordics bar top corks Revenue (billion) Forecast, by Application 2020 & 2033
- Table 52: Nordics bar top corks Volume (K) Forecast, by Application 2020 & 2033
- Table 53: Rest of Europe bar top corks Revenue (billion) Forecast, by Application 2020 & 2033
- Table 54: Rest of Europe bar top corks Volume (K) Forecast, by Application 2020 & 2033
- Table 55: Global bar top corks Revenue billion Forecast, by Application 2020 & 2033
- Table 56: Global bar top corks Volume K Forecast, by Application 2020 & 2033
- Table 57: Global bar top corks Revenue billion Forecast, by Types 2020 & 2033
- Table 58: Global bar top corks Volume K Forecast, by Types 2020 & 2033
- Table 59: Global bar top corks Revenue billion Forecast, by Country 2020 & 2033
- Table 60: Global bar top corks Volume K Forecast, by Country 2020 & 2033
- Table 61: Turkey bar top corks Revenue (billion) Forecast, by Application 2020 & 2033
- Table 62: Turkey bar top corks Volume (K) Forecast, by Application 2020 & 2033
- Table 63: Israel bar top corks Revenue (billion) Forecast, by Application 2020 & 2033
- Table 64: Israel bar top corks Volume (K) Forecast, by Application 2020 & 2033
- Table 65: GCC bar top corks Revenue (billion) Forecast, by Application 2020 & 2033
- Table 66: GCC bar top corks Volume (K) Forecast, by Application 2020 & 2033
- Table 67: North Africa bar top corks Revenue (billion) Forecast, by Application 2020 & 2033
- Table 68: North Africa bar top corks Volume (K) Forecast, by Application 2020 & 2033
- Table 69: South Africa bar top corks Revenue (billion) Forecast, by Application 2020 & 2033
- Table 70: South Africa bar top corks Volume (K) Forecast, by Application 2020 & 2033
- Table 71: Rest of Middle East & Africa bar top corks Revenue (billion) Forecast, by Application 2020 & 2033
- Table 72: Rest of Middle East & Africa bar top corks Volume (K) Forecast, by Application 2020 & 2033
- Table 73: Global bar top corks Revenue billion Forecast, by Application 2020 & 2033
- Table 74: Global bar top corks Volume K Forecast, by Application 2020 & 2033
- Table 75: Global bar top corks Revenue billion Forecast, by Types 2020 & 2033
- Table 76: Global bar top corks Volume K Forecast, by Types 2020 & 2033
- Table 77: Global bar top corks Revenue billion Forecast, by Country 2020 & 2033
- Table 78: Global bar top corks Volume K Forecast, by Country 2020 & 2033
- Table 79: China bar top corks Revenue (billion) Forecast, by Application 2020 & 2033
- Table 80: China bar top corks Volume (K) Forecast, by Application 2020 & 2033
- Table 81: India bar top corks Revenue (billion) Forecast, by Application 2020 & 2033
- Table 82: India bar top corks Volume (K) Forecast, by Application 2020 & 2033
- Table 83: Japan bar top corks Revenue (billion) Forecast, by Application 2020 & 2033
- Table 84: Japan bar top corks Volume (K) Forecast, by Application 2020 & 2033
- Table 85: South Korea bar top corks Revenue (billion) Forecast, by Application 2020 & 2033
- Table 86: South Korea bar top corks Volume (K) Forecast, by Application 2020 & 2033
- Table 87: ASEAN bar top corks Revenue (billion) Forecast, by Application 2020 & 2033
- Table 88: ASEAN bar top corks Volume (K) Forecast, by Application 2020 & 2033
- Table 89: Oceania bar top corks Revenue (billion) Forecast, by Application 2020 & 2033
- Table 90: Oceania bar top corks Volume (K) Forecast, by Application 2020 & 2033
- Table 91: Rest of Asia Pacific bar top corks Revenue (billion) Forecast, by Application 2020 & 2033
- Table 92: Rest of Asia Pacific bar top corks Volume (K) Forecast, by Application 2020 & 2033
Frequently Asked Questions
1. What is the projected Compound Annual Growth Rate (CAGR) of the bar top corks?
The projected CAGR is approximately 6%.
2. Which companies are prominent players in the bar top corks?
Key companies in the market include ACIC Cork and Closures, The Cary Company, Corticeira Amorim, Tapì Group, Berlin Packaging, WidgetCo, Bottle Express, Vinolok Closure, W. Langguth Erben GmbH, Guala Closures Group.
3. What are the main segments of the bar top corks?
The market segments include Application, Types.
4. Can you provide details about the market size?
The market size is estimated to be USD 0.5 billion as of 2022.
5. What are some drivers contributing to market growth?
N/A
6. What are the notable trends driving market growth?
N/A
7. Are there any restraints impacting market growth?
N/A
8. Can you provide examples of recent developments in the market?
N/A
9. What pricing options are available for accessing the report?
Pricing options include single-user, multi-user, and enterprise licenses priced at USD 4350.00, USD 6525.00, and USD 8700.00 respectively.
10. Is the market size provided in terms of value or volume?
The market size is provided in terms of value, measured in billion and volume, measured in K.
11. Are there any specific market keywords associated with the report?
Yes, the market keyword associated with the report is "bar top corks," which aids in identifying and referencing the specific market segment covered.
12. How do I determine which pricing option suits my needs best?
The pricing options vary based on user requirements and access needs. Individual users may opt for single-user licenses, while businesses requiring broader access may choose multi-user or enterprise licenses for cost-effective access to the report.
13. Are there any additional resources or data provided in the bar top corks report?
While the report offers comprehensive insights, it's advisable to review the specific contents or supplementary materials provided to ascertain if additional resources or data are available.
14. How can I stay updated on further developments or reports in the bar top corks?
To stay informed about further developments, trends, and reports in the bar top corks, consider subscribing to industry newsletters, following relevant companies and organizations, or regularly checking reputable industry news sources and publications.
Methodology
Step 1 - Identification of Relevant Samples Size from Population Database


Step 2 - Approaches for Defining Global Market Size (Value, Volume* & Price*)

Note*: In applicable scenarios
Step 3 - Data Sources
Primary Research
- Web Analytics
- Survey Reports
- Research Institute
- Latest Research Reports
- Opinion Leaders
Secondary Research
- Annual Reports
- White Paper
- Latest Press Release
- Industry Association
- Paid Database
- Investor Presentations

Step 4 - Data Triangulation
Involves using different sources of information in order to increase the validity of a study
These sources are likely to be stakeholders in a program - participants, other researchers, program staff, other community members, and so on.
Then we put all data in single framework & apply various statistical tools to find out the dynamic on the market.
During the analysis stage, feedback from the stakeholder groups would be compared to determine areas of agreement as well as areas of divergence