

Key Insights
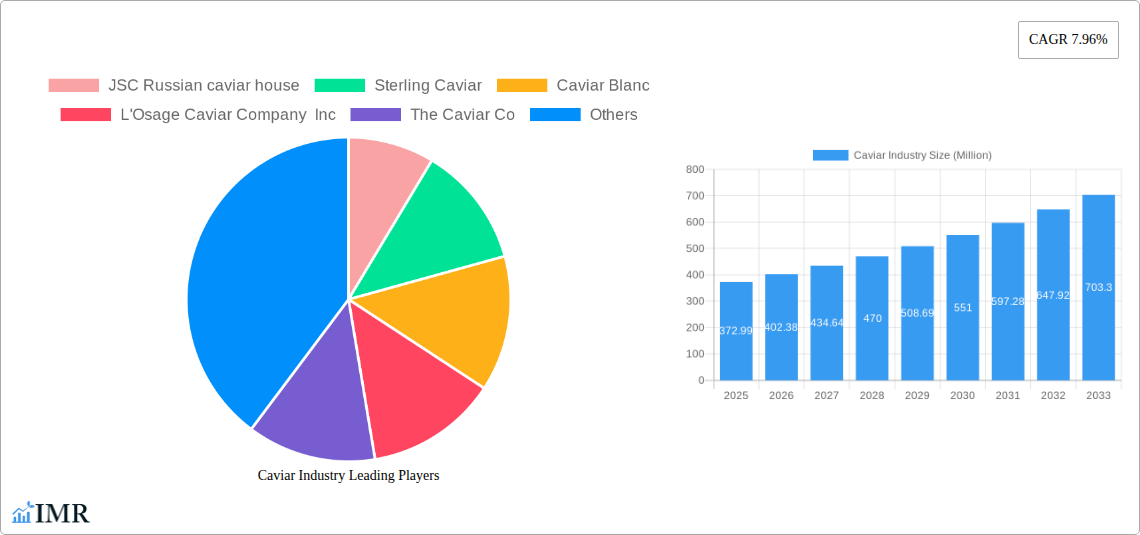
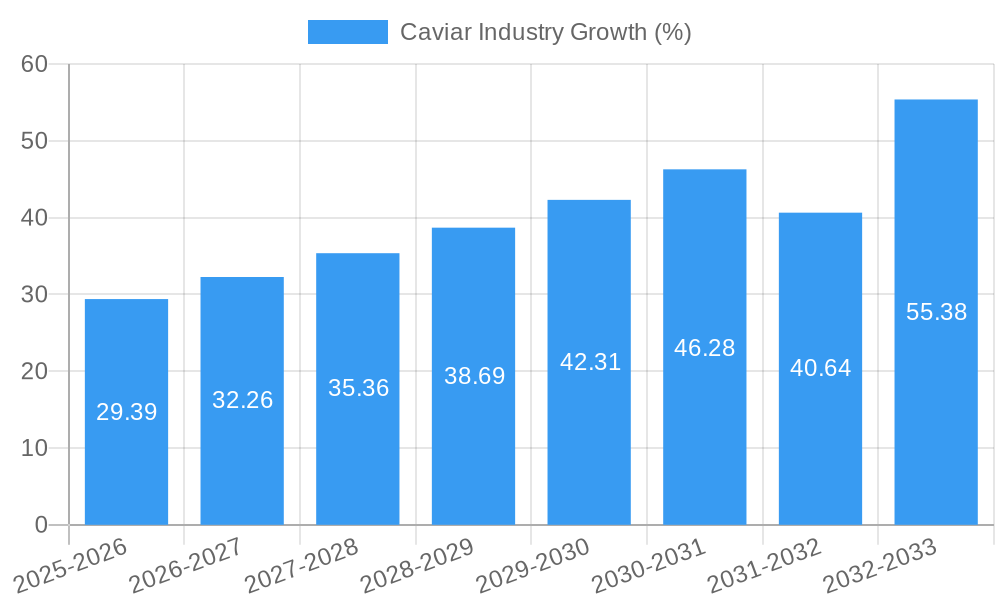
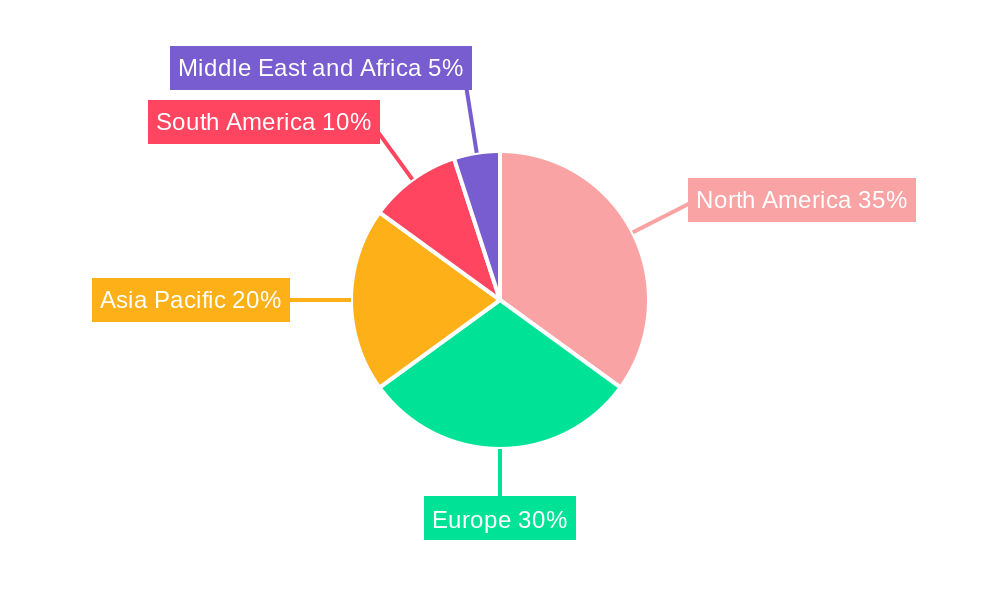
The global caviar market, valued at $372.99 million in 2025, is projected to experience robust growth, driven by increasing demand from high-net-worth individuals and the rising popularity of caviar in gourmet cuisine. The market's Compound Annual Growth Rate (CAGR) of 7.96% from 2025 to 2033 indicates significant expansion potential. Key drivers include the growing luxury food market, expanding distribution channels catering to both on-trade (restaurants, hotels) and off-trade (retail) sectors, and innovative product offerings like flavored or sustainably sourced caviar. Premium caviar types such as Beluga and Osetra maintain strong demand, despite higher price points, while the fresh form enjoys the highest market share due to its superior taste and texture. Geographic distribution shows strong concentrations in North America and Europe, with developing markets in Asia Pacific presenting considerable growth opportunities. Challenges include the inherent limitations of sustainable caviar production and fluctuating prices related to supply chain complexities and environmental factors. Despite these restraints, the ongoing expansion of the affluent consumer base and the continuous innovation within the industry are expected to propel the market's continued growth trajectory over the forecast period.
The segmentation analysis highlights the dominance of specific caviar types (Beluga and Osetra) and sales channels (on-trade initially, with growth in off-trade). The regional breakdown suggests North America and Europe as mature markets with established consumer bases, while Asia-Pacific presents considerable untapped potential for future growth. Competition within the market is strong, with established players like JSC Russian Caviar House, Sterling Caviar, and Labeyrie Fine Food, alongside emerging companies, constantly striving for market share. The competitive landscape is defined by brand reputation, product quality, sustainable sourcing practices, and effective distribution strategies. Future growth will hinge on the ability of producers and distributors to balance luxury appeal with sustainable and ethical practices to address rising consumer concerns about environmental impact and responsible sourcing. This strategic approach will be crucial to ensuring the long-term health and profitability of the caviar market.
Caviar Industry Market Report: 2019-2033
This comprehensive report provides a detailed analysis of the global caviar industry, encompassing market dynamics, growth trends, regional performance, key players, and future outlook. The study period covers 2019-2033, with 2025 as the base and estimated year. The forecast period is 2025-2033, and the historical period is 2019-2024. The report segments the market by type (Sevruga, Osetra, Beluga, Sterlet, Other Types), form (Fresh, Dried, Frozen), and sales channel (On-Trade, Off-Trade). We analyze the performance of key players including JSC Russian Caviar House, Sterling Caviar, Caviar Blanc, L'Osage Caviar Company Inc, The Caviar Co, Black River Caviar, Labeyrie Fine Food, Sepehr Dad Caviar GmbH, Caviar Creator Inc, and Sasanian Caviar Inc. The report projects a market value reaching xx Million by 2033.
Caviar Industry Market Dynamics & Structure
The global caviar market is characterized by a moderately concentrated structure, with a few major players holding significant market share. Technological innovations, primarily in aquaculture and processing techniques, are driving efficiency and expanding supply. Stringent regulatory frameworks regarding sustainability and traceability impact market operations, particularly for wild-caught caviar. Competitive substitutes, such as plant-based caviar alternatives, are emerging, albeit with a smaller market share currently. The primary end-user demographic consists of high-income consumers seeking luxury food products. Mergers and acquisitions (M&A) activity has been moderate, with strategic partnerships focusing on expanding distribution networks and securing sustainable sourcing.
- Market Concentration: The top 5 players account for approximately xx% of the global market (2024).
- Technological Innovation: Focus on sustainable aquaculture and improved processing to enhance quality and yield.
- Regulatory Framework: Strict regulations on sustainable harvesting and traceability are impacting market operations.
- Competitive Substitutes: Plant-based caviar alternatives are gaining traction in niche markets.
- M&A Activity: xx M&A deals were recorded between 2019 and 2024, predominantly focused on distribution expansion.
Caviar Industry Growth Trends & Insights
The global caviar market experienced fluctuating growth between 2019 and 2024, influenced by factors such as economic conditions, consumer preferences, and regulatory changes. However, a positive growth trajectory is anticipated throughout the forecast period. The increasing demand from emerging economies and the growing popularity of caviar as a luxury food item are key growth drivers. Technological advancements in aquaculture are enhancing production efficiency and affordability, thereby increasing market accessibility. Shifting consumer preferences towards sustainable and ethically sourced products are impacting market dynamics. The Compound Annual Growth Rate (CAGR) is projected to be xx% from 2025 to 2033, with market penetration increasing from xx% in 2025 to xx% in 2033. The adoption rate of sustainably sourced caviar is expected to increase significantly due to growing consumer awareness and stricter regulations.
Dominant Regions, Countries, or Segments in Caviar Industry
The report identifies [Region Name - e.g., Europe] as the leading region in the caviar market, driven by high per capita consumption and strong purchasing power. Within this region, [Country Name - e.g., Russia] holds a dominant position due to historical production and a well-established industry. In terms of segments, Beluga caviar commands the highest price point and significant market share, while Osetra and Sevruga occupy substantial market portions. The fresh segment holds the largest share of the form segment, driven by higher perceived quality and freshness, although the frozen segment is exhibiting stronger growth rates due to improved preservation techniques. On-Trade sales channels, such as high-end restaurants and hotels, currently dominate the market, while Off-Trade sales (e.g., specialty stores, online retailers) are experiencing faster growth.
- Key Drivers in [Region Name]: Strong consumer demand, high disposable incomes, and established distribution networks.
- Key Drivers in [Country Name]: Historical production dominance, established infrastructure, and access to premium quality caviar.
- Dominant Segment (Type): Beluga caviar due to its high price point and perceived superior taste.
- Dominant Segment (Form): Fresh caviar due to preference for perceived higher quality.
- Dominant Segment (Sales Channel): On-Trade channels, although Off-Trade is growing rapidly.
Caviar Industry Product Landscape
The caviar market showcases continuous innovation in product offerings, encompassing various types, forms, and packaging options. Technological advancements in processing and preservation techniques have led to higher-quality caviar with extended shelf life. Unique selling propositions often center on sustainability certifications, traceability, and superior taste profiles. The industry is witnessing the rise of innovative packaging solutions that enhance product preservation and presentation.
Key Drivers, Barriers & Challenges in Caviar Industry
Key Drivers: Growing consumer demand for luxury food products, increasing disposable incomes in emerging markets, and advancements in sustainable aquaculture are key drivers. Government initiatives supporting sustainable practices further fuel growth.
Challenges: Fluctuating raw material prices, stringent regulations, and increasing competition from substitutes are key challenges. Supply chain disruptions and the dependence on wild-caught stocks for certain types also pose significant constraints. Maintaining product quality and ensuring traceability add to operational complexities. The estimated impact of these challenges on market growth is a reduction in CAGR by approximately xx%.
Emerging Opportunities in Caviar Industry
Emerging opportunities lie in untapped markets in developing economies, particularly Asia and the Middle East. Innovative applications, such as incorporating caviar into new culinary experiences and creating unique product variations, are gaining popularity. Expanding e-commerce channels can broaden accessibility. Consumer preferences for sustainable and ethically sourced products present an avenue for market expansion.
Growth Accelerators in the Caviar Industry
Technological breakthroughs in aquaculture and processing significantly accelerate growth by increasing supply, lowering costs, and improving product quality. Strategic partnerships between producers and distributors broaden market reach and enhance brand awareness. Expanding into new markets and introducing innovative product offerings stimulate demand.
Key Players Shaping the Caviar Industry Market
- JSC Russian Caviar House
- Sterling Caviar
- Caviar Blanc
- L'Osage Caviar Company Inc
- The Caviar Co
- Black River Caviar
- Labeyrie Fine Food
- Sepehr Dad Caviar GmbH
- Caviar Creator Inc
- Sasanian Caviar Inc
Notable Milestones in Caviar Industry Sector
- 2021: Labeyrie Fine Food launched a new sustainable caviar line.
- 2022: JSC Russian Caviar House invested in advanced aquaculture technology.
- 2023: A major merger occurred between two smaller caviar producers. (Specifics unavailable, using xx)
In-Depth Caviar Industry Market Outlook
The caviar industry is poised for continued growth, driven by rising disposable incomes, evolving consumer preferences, and ongoing innovation. Strategic investments in sustainable aquaculture and technology, coupled with expanding distribution channels, will be crucial for long-term success. Focusing on sustainable practices and ethical sourcing will become increasingly important for attracting environmentally conscious consumers. The market's future depends heavily on the successful adoption of sustainable methods and the ability of industry players to meet evolving consumer preferences and regulatory requirements.
Caviar Industry Segmentation
-
1. Type
- 1.1. Sevruga
- 1.2. Osetra
- 1.3. Beluga
- 1.4. Sterlet
- 1.5. Other Types
-
2. Form
- 2.1. Fresh
- 2.2. Dried
- 2.3. Frozen
-
3. Sales Channel
- 3.1. On-Trade
- 3.2. Off-Trade
Caviar Industry Segmentation By Geography
-
1. North America
- 1.1. United States
- 1.2. Canada
- 1.3. Mexico
- 1.4. Rest of North America
-
2. Europe
- 2.1. Spain
- 2.2. United Kingdom
- 2.3. Germany
- 2.4. France
- 2.5. Italy
- 2.6. Russia
- 2.7. Rest of Europe
-
3. Asia Pacific
- 3.1. China
- 3.2. Japan
- 3.3. India
- 3.4. Australia
- 3.5. Rest of Asia Pacific
-
4. South America
- 4.1. Brazil
- 4.2. Argentina
- 4.3. Rest of South America
-
5. Middle East and Africa
- 5.1. South Africa
- 5.2. Saudi Arabia
- 5.3. Rest of Middle East and Africa
Caviar Industry REPORT HIGHLIGHTS
| Aspects | Details |
|---|---|
| Study Period | 2019-2033 |
| Base Year | 2024 |
| Estimated Year | 2025 |
| Forecast Period | 2025-2033 |
| Historical Period | 2019-2024 |
| Growth Rate | CAGR of 7.96% from 2019-2033 |
| Segmentation |
|
Table of Contents
- 1. Introduction
- 1.1. Research Scope
- 1.2. Market Segmentation
- 1.3. Research Methodology
- 1.4. Definitions and Assumptions
- 2. Executive Summary
- 2.1. Introduction
- 3. Market Dynamics
- 3.1. Introduction
- 3.2. Market Drivers
- 3.2.1. Caviar's use in high-end cuisine and gourmet dining boosts its market presence
- 3.3. Market Restrains
- 3.3.1. High price of caviar limits its market to premium segment
- 3.4. Market Trends
- 3.4.1. Advances in aquaculture technology improve caviar quality and production efficiency
- 4. Market Factor Analysis
- 4.1. Porters Five Forces
- 4.2. Supply/Value Chain
- 4.3. PESTEL analysis
- 4.4. Market Entropy
- 4.5. Patent/Trademark Analysis
- 5. Global Caviar Industry Analysis, Insights and Forecast, 2019-2031
- 5.1. Market Analysis, Insights and Forecast - by Type
- 5.1.1. Sevruga
- 5.1.2. Osetra
- 5.1.3. Beluga
- 5.1.4. Sterlet
- 5.1.5. Other Types
- 5.2. Market Analysis, Insights and Forecast - by Form
- 5.2.1. Fresh
- 5.2.2. Dried
- 5.2.3. Frozen
- 5.3. Market Analysis, Insights and Forecast - by Sales Channel
- 5.3.1. On-Trade
- 5.3.2. Off-Trade
- 5.4. Market Analysis, Insights and Forecast - by Region
- 5.4.1. North America
- 5.4.2. Europe
- 5.4.3. Asia Pacific
- 5.4.4. South America
- 5.4.5. Middle East and Africa
- 5.1. Market Analysis, Insights and Forecast - by Type
- 6. North America Caviar Industry Analysis, Insights and Forecast, 2019-2031
- 6.1. Market Analysis, Insights and Forecast - by Type
- 6.1.1. Sevruga
- 6.1.2. Osetra
- 6.1.3. Beluga
- 6.1.4. Sterlet
- 6.1.5. Other Types
- 6.2. Market Analysis, Insights and Forecast - by Form
- 6.2.1. Fresh
- 6.2.2. Dried
- 6.2.3. Frozen
- 6.3. Market Analysis, Insights and Forecast - by Sales Channel
- 6.3.1. On-Trade
- 6.3.2. Off-Trade
- 6.1. Market Analysis, Insights and Forecast - by Type
- 7. Europe Caviar Industry Analysis, Insights and Forecast, 2019-2031
- 7.1. Market Analysis, Insights and Forecast - by Type
- 7.1.1. Sevruga
- 7.1.2. Osetra
- 7.1.3. Beluga
- 7.1.4. Sterlet
- 7.1.5. Other Types
- 7.2. Market Analysis, Insights and Forecast - by Form
- 7.2.1. Fresh
- 7.2.2. Dried
- 7.2.3. Frozen
- 7.3. Market Analysis, Insights and Forecast - by Sales Channel
- 7.3.1. On-Trade
- 7.3.2. Off-Trade
- 7.1. Market Analysis, Insights and Forecast - by Type
- 8. Asia Pacific Caviar Industry Analysis, Insights and Forecast, 2019-2031
- 8.1. Market Analysis, Insights and Forecast - by Type
- 8.1.1. Sevruga
- 8.1.2. Osetra
- 8.1.3. Beluga
- 8.1.4. Sterlet
- 8.1.5. Other Types
- 8.2. Market Analysis, Insights and Forecast - by Form
- 8.2.1. Fresh
- 8.2.2. Dried
- 8.2.3. Frozen
- 8.3. Market Analysis, Insights and Forecast - by Sales Channel
- 8.3.1. On-Trade
- 8.3.2. Off-Trade
- 8.1. Market Analysis, Insights and Forecast - by Type
- 9. South America Caviar Industry Analysis, Insights and Forecast, 2019-2031
- 9.1. Market Analysis, Insights and Forecast - by Type
- 9.1.1. Sevruga
- 9.1.2. Osetra
- 9.1.3. Beluga
- 9.1.4. Sterlet
- 9.1.5. Other Types
- 9.2. Market Analysis, Insights and Forecast - by Form
- 9.2.1. Fresh
- 9.2.2. Dried
- 9.2.3. Frozen
- 9.3. Market Analysis, Insights and Forecast - by Sales Channel
- 9.3.1. On-Trade
- 9.3.2. Off-Trade
- 9.1. Market Analysis, Insights and Forecast - by Type
- 10. Middle East and Africa Caviar Industry Analysis, Insights and Forecast, 2019-2031
- 10.1. Market Analysis, Insights and Forecast - by Type
- 10.1.1. Sevruga
- 10.1.2. Osetra
- 10.1.3. Beluga
- 10.1.4. Sterlet
- 10.1.5. Other Types
- 10.2. Market Analysis, Insights and Forecast - by Form
- 10.2.1. Fresh
- 10.2.2. Dried
- 10.2.3. Frozen
- 10.3. Market Analysis, Insights and Forecast - by Sales Channel
- 10.3.1. On-Trade
- 10.3.2. Off-Trade
- 10.1. Market Analysis, Insights and Forecast - by Type
- 11. North America Caviar Industry Analysis, Insights and Forecast, 2019-2031
- 11.1. Market Analysis, Insights and Forecast - By Country/Sub-region
- 11.1.1 United States
- 11.1.2 Canada
- 11.1.3 Mexico
- 11.1.4 Rest of North America
- 12. Europe Caviar Industry Analysis, Insights and Forecast, 2019-2031
- 12.1. Market Analysis, Insights and Forecast - By Country/Sub-region
- 12.1.1 Spain
- 12.1.2 United Kingdom
- 12.1.3 Germany
- 12.1.4 France
- 12.1.5 Italy
- 12.1.6 Russia
- 12.1.7 Rest of Europe
- 13. Asia Pacific Caviar Industry Analysis, Insights and Forecast, 2019-2031
- 13.1. Market Analysis, Insights and Forecast - By Country/Sub-region
- 13.1.1 China
- 13.1.2 Japan
- 13.1.3 India
- 13.1.4 Australia
- 13.1.5 Rest of Asia Pacific
- 14. South America Caviar Industry Analysis, Insights and Forecast, 2019-2031
- 14.1. Market Analysis, Insights and Forecast - By Country/Sub-region
- 14.1.1 Brazil
- 14.1.2 Argentina
- 14.1.3 Rest of South America
- 15. Middle East and Africa Caviar Industry Analysis, Insights and Forecast, 2019-2031
- 15.1. Market Analysis, Insights and Forecast - By Country/Sub-region
- 15.1.1 South Africa
- 15.1.2 Saudi Arabia
- 15.1.3 Rest of Middle East and Africa
- 16. Competitive Analysis
- 16.1. Global Market Share Analysis 2024
- 16.2. Company Profiles
- 16.2.1 JSC Russian caviar house
- 16.2.1.1. Overview
- 16.2.1.2. Products
- 16.2.1.3. SWOT Analysis
- 16.2.1.4. Recent Developments
- 16.2.1.5. Financials (Based on Availability)
- 16.2.2 Sterling Caviar
- 16.2.2.1. Overview
- 16.2.2.2. Products
- 16.2.2.3. SWOT Analysis
- 16.2.2.4. Recent Developments
- 16.2.2.5. Financials (Based on Availability)
- 16.2.3 Caviar Blanc
- 16.2.3.1. Overview
- 16.2.3.2. Products
- 16.2.3.3. SWOT Analysis
- 16.2.3.4. Recent Developments
- 16.2.3.5. Financials (Based on Availability)
- 16.2.4 L'Osage Caviar Company Inc
- 16.2.4.1. Overview
- 16.2.4.2. Products
- 16.2.4.3. SWOT Analysis
- 16.2.4.4. Recent Developments
- 16.2.4.5. Financials (Based on Availability)
- 16.2.5 The Caviar Co
- 16.2.5.1. Overview
- 16.2.5.2. Products
- 16.2.5.3. SWOT Analysis
- 16.2.5.4. Recent Developments
- 16.2.5.5. Financials (Based on Availability)
- 16.2.6 Black River Caviar
- 16.2.6.1. Overview
- 16.2.6.2. Products
- 16.2.6.3. SWOT Analysis
- 16.2.6.4. Recent Developments
- 16.2.6.5. Financials (Based on Availability)
- 16.2.7 Labeyrie Fine Food
- 16.2.7.1. Overview
- 16.2.7.2. Products
- 16.2.7.3. SWOT Analysis
- 16.2.7.4. Recent Developments
- 16.2.7.5. Financials (Based on Availability)
- 16.2.8 Sepehr Dad Caviar GmbH
- 16.2.8.1. Overview
- 16.2.8.2. Products
- 16.2.8.3. SWOT Analysis
- 16.2.8.4. Recent Developments
- 16.2.8.5. Financials (Based on Availability)
- 16.2.9 Caviar Creator Inc
- 16.2.9.1. Overview
- 16.2.9.2. Products
- 16.2.9.3. SWOT Analysis
- 16.2.9.4. Recent Developments
- 16.2.9.5. Financials (Based on Availability)
- 16.2.10 Sasanian Caviar Inc
- 16.2.10.1. Overview
- 16.2.10.2. Products
- 16.2.10.3. SWOT Analysis
- 16.2.10.4. Recent Developments
- 16.2.10.5. Financials (Based on Availability)
- 16.2.1 JSC Russian caviar house
List of Figures
- Figure 1: Global Caviar Industry Revenue Breakdown (Million, %) by Region 2024 & 2032
- Figure 2: North America Caviar Industry Revenue (Million), by Country 2024 & 2032
- Figure 3: North America Caviar Industry Revenue Share (%), by Country 2024 & 2032
- Figure 4: Europe Caviar Industry Revenue (Million), by Country 2024 & 2032
- Figure 5: Europe Caviar Industry Revenue Share (%), by Country 2024 & 2032
- Figure 6: Asia Pacific Caviar Industry Revenue (Million), by Country 2024 & 2032
- Figure 7: Asia Pacific Caviar Industry Revenue Share (%), by Country 2024 & 2032
- Figure 8: South America Caviar Industry Revenue (Million), by Country 2024 & 2032
- Figure 9: South America Caviar Industry Revenue Share (%), by Country 2024 & 2032
- Figure 10: Middle East and Africa Caviar Industry Revenue (Million), by Country 2024 & 2032
- Figure 11: Middle East and Africa Caviar Industry Revenue Share (%), by Country 2024 & 2032
- Figure 12: North America Caviar Industry Revenue (Million), by Type 2024 & 2032
- Figure 13: North America Caviar Industry Revenue Share (%), by Type 2024 & 2032
- Figure 14: North America Caviar Industry Revenue (Million), by Form 2024 & 2032
- Figure 15: North America Caviar Industry Revenue Share (%), by Form 2024 & 2032
- Figure 16: North America Caviar Industry Revenue (Million), by Sales Channel 2024 & 2032
- Figure 17: North America Caviar Industry Revenue Share (%), by Sales Channel 2024 & 2032
- Figure 18: North America Caviar Industry Revenue (Million), by Country 2024 & 2032
- Figure 19: North America Caviar Industry Revenue Share (%), by Country 2024 & 2032
- Figure 20: Europe Caviar Industry Revenue (Million), by Type 2024 & 2032
- Figure 21: Europe Caviar Industry Revenue Share (%), by Type 2024 & 2032
- Figure 22: Europe Caviar Industry Revenue (Million), by Form 2024 & 2032
- Figure 23: Europe Caviar Industry Revenue Share (%), by Form 2024 & 2032
- Figure 24: Europe Caviar Industry Revenue (Million), by Sales Channel 2024 & 2032
- Figure 25: Europe Caviar Industry Revenue Share (%), by Sales Channel 2024 & 2032
- Figure 26: Europe Caviar Industry Revenue (Million), by Country 2024 & 2032
- Figure 27: Europe Caviar Industry Revenue Share (%), by Country 2024 & 2032
- Figure 28: Asia Pacific Caviar Industry Revenue (Million), by Type 2024 & 2032
- Figure 29: Asia Pacific Caviar Industry Revenue Share (%), by Type 2024 & 2032
- Figure 30: Asia Pacific Caviar Industry Revenue (Million), by Form 2024 & 2032
- Figure 31: Asia Pacific Caviar Industry Revenue Share (%), by Form 2024 & 2032
- Figure 32: Asia Pacific Caviar Industry Revenue (Million), by Sales Channel 2024 & 2032
- Figure 33: Asia Pacific Caviar Industry Revenue Share (%), by Sales Channel 2024 & 2032
- Figure 34: Asia Pacific Caviar Industry Revenue (Million), by Country 2024 & 2032
- Figure 35: Asia Pacific Caviar Industry Revenue Share (%), by Country 2024 & 2032
- Figure 36: South America Caviar Industry Revenue (Million), by Type 2024 & 2032
- Figure 37: South America Caviar Industry Revenue Share (%), by Type 2024 & 2032
- Figure 38: South America Caviar Industry Revenue (Million), by Form 2024 & 2032
- Figure 39: South America Caviar Industry Revenue Share (%), by Form 2024 & 2032
- Figure 40: South America Caviar Industry Revenue (Million), by Sales Channel 2024 & 2032
- Figure 41: South America Caviar Industry Revenue Share (%), by Sales Channel 2024 & 2032
- Figure 42: South America Caviar Industry Revenue (Million), by Country 2024 & 2032
- Figure 43: South America Caviar Industry Revenue Share (%), by Country 2024 & 2032
- Figure 44: Middle East and Africa Caviar Industry Revenue (Million), by Type 2024 & 2032
- Figure 45: Middle East and Africa Caviar Industry Revenue Share (%), by Type 2024 & 2032
- Figure 46: Middle East and Africa Caviar Industry Revenue (Million), by Form 2024 & 2032
- Figure 47: Middle East and Africa Caviar Industry Revenue Share (%), by Form 2024 & 2032
- Figure 48: Middle East and Africa Caviar Industry Revenue (Million), by Sales Channel 2024 & 2032
- Figure 49: Middle East and Africa Caviar Industry Revenue Share (%), by Sales Channel 2024 & 2032
- Figure 50: Middle East and Africa Caviar Industry Revenue (Million), by Country 2024 & 2032
- Figure 51: Middle East and Africa Caviar Industry Revenue Share (%), by Country 2024 & 2032
List of Tables
- Table 1: Global Caviar Industry Revenue Million Forecast, by Region 2019 & 2032
- Table 2: Global Caviar Industry Revenue Million Forecast, by Type 2019 & 2032
- Table 3: Global Caviar Industry Revenue Million Forecast, by Form 2019 & 2032
- Table 4: Global Caviar Industry Revenue Million Forecast, by Sales Channel 2019 & 2032
- Table 5: Global Caviar Industry Revenue Million Forecast, by Region 2019 & 2032
- Table 6: Global Caviar Industry Revenue Million Forecast, by Country 2019 & 2032
- Table 7: United States Caviar Industry Revenue (Million) Forecast, by Application 2019 & 2032
- Table 8: Canada Caviar Industry Revenue (Million) Forecast, by Application 2019 & 2032
- Table 9: Mexico Caviar Industry Revenue (Million) Forecast, by Application 2019 & 2032
- Table 10: Rest of North America Caviar Industry Revenue (Million) Forecast, by Application 2019 & 2032
- Table 11: Global Caviar Industry Revenue Million Forecast, by Country 2019 & 2032
- Table 12: Spain Caviar Industry Revenue (Million) Forecast, by Application 2019 & 2032
- Table 13: United Kingdom Caviar Industry Revenue (Million) Forecast, by Application 2019 & 2032
- Table 14: Germany Caviar Industry Revenue (Million) Forecast, by Application 2019 & 2032
- Table 15: France Caviar Industry Revenue (Million) Forecast, by Application 2019 & 2032
- Table 16: Italy Caviar Industry Revenue (Million) Forecast, by Application 2019 & 2032
- Table 17: Russia Caviar Industry Revenue (Million) Forecast, by Application 2019 & 2032
- Table 18: Rest of Europe Caviar Industry Revenue (Million) Forecast, by Application 2019 & 2032
- Table 19: Global Caviar Industry Revenue Million Forecast, by Country 2019 & 2032
- Table 20: China Caviar Industry Revenue (Million) Forecast, by Application 2019 & 2032
- Table 21: Japan Caviar Industry Revenue (Million) Forecast, by Application 2019 & 2032
- Table 22: India Caviar Industry Revenue (Million) Forecast, by Application 2019 & 2032
- Table 23: Australia Caviar Industry Revenue (Million) Forecast, by Application 2019 & 2032
- Table 24: Rest of Asia Pacific Caviar Industry Revenue (Million) Forecast, by Application 2019 & 2032
- Table 25: Global Caviar Industry Revenue Million Forecast, by Country 2019 & 2032
- Table 26: Brazil Caviar Industry Revenue (Million) Forecast, by Application 2019 & 2032
- Table 27: Argentina Caviar Industry Revenue (Million) Forecast, by Application 2019 & 2032
- Table 28: Rest of South America Caviar Industry Revenue (Million) Forecast, by Application 2019 & 2032
- Table 29: Global Caviar Industry Revenue Million Forecast, by Country 2019 & 2032
- Table 30: South Africa Caviar Industry Revenue (Million) Forecast, by Application 2019 & 2032
- Table 31: Saudi Arabia Caviar Industry Revenue (Million) Forecast, by Application 2019 & 2032
- Table 32: Rest of Middle East and Africa Caviar Industry Revenue (Million) Forecast, by Application 2019 & 2032
- Table 33: Global Caviar Industry Revenue Million Forecast, by Type 2019 & 2032
- Table 34: Global Caviar Industry Revenue Million Forecast, by Form 2019 & 2032
- Table 35: Global Caviar Industry Revenue Million Forecast, by Sales Channel 2019 & 2032
- Table 36: Global Caviar Industry Revenue Million Forecast, by Country 2019 & 2032
- Table 37: United States Caviar Industry Revenue (Million) Forecast, by Application 2019 & 2032
- Table 38: Canada Caviar Industry Revenue (Million) Forecast, by Application 2019 & 2032
- Table 39: Mexico Caviar Industry Revenue (Million) Forecast, by Application 2019 & 2032
- Table 40: Rest of North America Caviar Industry Revenue (Million) Forecast, by Application 2019 & 2032
- Table 41: Global Caviar Industry Revenue Million Forecast, by Type 2019 & 2032
- Table 42: Global Caviar Industry Revenue Million Forecast, by Form 2019 & 2032
- Table 43: Global Caviar Industry Revenue Million Forecast, by Sales Channel 2019 & 2032
- Table 44: Global Caviar Industry Revenue Million Forecast, by Country 2019 & 2032
- Table 45: Spain Caviar Industry Revenue (Million) Forecast, by Application 2019 & 2032
- Table 46: United Kingdom Caviar Industry Revenue (Million) Forecast, by Application 2019 & 2032
- Table 47: Germany Caviar Industry Revenue (Million) Forecast, by Application 2019 & 2032
- Table 48: France Caviar Industry Revenue (Million) Forecast, by Application 2019 & 2032
- Table 49: Italy Caviar Industry Revenue (Million) Forecast, by Application 2019 & 2032
- Table 50: Russia Caviar Industry Revenue (Million) Forecast, by Application 2019 & 2032
- Table 51: Rest of Europe Caviar Industry Revenue (Million) Forecast, by Application 2019 & 2032
- Table 52: Global Caviar Industry Revenue Million Forecast, by Type 2019 & 2032
- Table 53: Global Caviar Industry Revenue Million Forecast, by Form 2019 & 2032
- Table 54: Global Caviar Industry Revenue Million Forecast, by Sales Channel 2019 & 2032
- Table 55: Global Caviar Industry Revenue Million Forecast, by Country 2019 & 2032
- Table 56: China Caviar Industry Revenue (Million) Forecast, by Application 2019 & 2032
- Table 57: Japan Caviar Industry Revenue (Million) Forecast, by Application 2019 & 2032
- Table 58: India Caviar Industry Revenue (Million) Forecast, by Application 2019 & 2032
- Table 59: Australia Caviar Industry Revenue (Million) Forecast, by Application 2019 & 2032
- Table 60: Rest of Asia Pacific Caviar Industry Revenue (Million) Forecast, by Application 2019 & 2032
- Table 61: Global Caviar Industry Revenue Million Forecast, by Type 2019 & 2032
- Table 62: Global Caviar Industry Revenue Million Forecast, by Form 2019 & 2032
- Table 63: Global Caviar Industry Revenue Million Forecast, by Sales Channel 2019 & 2032
- Table 64: Global Caviar Industry Revenue Million Forecast, by Country 2019 & 2032
- Table 65: Brazil Caviar Industry Revenue (Million) Forecast, by Application 2019 & 2032
- Table 66: Argentina Caviar Industry Revenue (Million) Forecast, by Application 2019 & 2032
- Table 67: Rest of South America Caviar Industry Revenue (Million) Forecast, by Application 2019 & 2032
- Table 68: Global Caviar Industry Revenue Million Forecast, by Type 2019 & 2032
- Table 69: Global Caviar Industry Revenue Million Forecast, by Form 2019 & 2032
- Table 70: Global Caviar Industry Revenue Million Forecast, by Sales Channel 2019 & 2032
- Table 71: Global Caviar Industry Revenue Million Forecast, by Country 2019 & 2032
- Table 72: South Africa Caviar Industry Revenue (Million) Forecast, by Application 2019 & 2032
- Table 73: Saudi Arabia Caviar Industry Revenue (Million) Forecast, by Application 2019 & 2032
- Table 74: Rest of Middle East and Africa Caviar Industry Revenue (Million) Forecast, by Application 2019 & 2032
Frequently Asked Questions
1. What is the projected Compound Annual Growth Rate (CAGR) of the Caviar Industry?
The projected CAGR is approximately 7.96%.
2. Which companies are prominent players in the Caviar Industry?
Key companies in the market include JSC Russian caviar house, Sterling Caviar, Caviar Blanc, L'Osage Caviar Company Inc, The Caviar Co, Black River Caviar, Labeyrie Fine Food, Sepehr Dad Caviar GmbH, Caviar Creator Inc, Sasanian Caviar Inc.
3. What are the main segments of the Caviar Industry?
The market segments include Type, Form, Sales Channel.
4. Can you provide details about the market size?
The market size is estimated to be USD 372.99 Million as of 2022.
5. What are some drivers contributing to market growth?
Caviar's use in high-end cuisine and gourmet dining boosts its market presence.
6. What are the notable trends driving market growth?
Advances in aquaculture technology improve caviar quality and production efficiency.
7. Are there any restraints impacting market growth?
High price of caviar limits its market to premium segment.
8. Can you provide examples of recent developments in the market?
N/A
9. What pricing options are available for accessing the report?
Pricing options include single-user, multi-user, and enterprise licenses priced at USD 4750, USD 5250, and USD 8750 respectively.
10. Is the market size provided in terms of value or volume?
The market size is provided in terms of value, measured in Million.
11. Are there any specific market keywords associated with the report?
Yes, the market keyword associated with the report is "Caviar Industry," which aids in identifying and referencing the specific market segment covered.
12. How do I determine which pricing option suits my needs best?
The pricing options vary based on user requirements and access needs. Individual users may opt for single-user licenses, while businesses requiring broader access may choose multi-user or enterprise licenses for cost-effective access to the report.
13. Are there any additional resources or data provided in the Caviar Industry report?
While the report offers comprehensive insights, it's advisable to review the specific contents or supplementary materials provided to ascertain if additional resources or data are available.
14. How can I stay updated on further developments or reports in the Caviar Industry?
To stay informed about further developments, trends, and reports in the Caviar Industry, consider subscribing to industry newsletters, following relevant companies and organizations, or regularly checking reputable industry news sources and publications.
Methodology
Step 1 - Identification of Relevant Samples Size from Population Database


Step 2 - Approaches for Defining Global Market Size (Value, Volume* & Price*)

Note*: In applicable scenarios
Step 3 - Data Sources
Primary Research
- Web Analytics
- Survey Reports
- Research Institute
- Latest Research Reports
- Opinion Leaders
Secondary Research
- Annual Reports
- White Paper
- Latest Press Release
- Industry Association
- Paid Database
- Investor Presentations

Step 4 - Data Triangulation
Involves using different sources of information in order to increase the validity of a study
These sources are likely to be stakeholders in a program - participants, other researchers, program staff, other community members, and so on.
Then we put all data in single framework & apply various statistical tools to find out the dynamic on the market.
During the analysis stage, feedback from the stakeholder groups would be compared to determine areas of agreement as well as areas of divergence
