

Key Insights
The global commercial vehicle market is projected for significant expansion, anticipated to reach $839.97 billion by 2024, exhibiting a compound annual growth rate (CAGR) of 5.74%. This growth is propelled by escalating demand for efficient logistics, expanding e-commerce operations, and increasing global trade. Technological advancements, particularly the adoption of hybrid and electric vehicles (HEVs and EVs), are reshaping the industry landscape. Government mandates promoting reduced carbon emissions are further accelerating the shift towards sustainable propulsion systems. Within market segments, LPG-powered vehicles demonstrate notable traction as a cost-effective and cleaner alternative. However, the high initial investment for electrification and underdeveloped charging infrastructure in select regions present strategic challenges and opportunities for manufacturers. Leading companies, including Scania, Nissan, and General Motors, are actively pursuing innovation and strategic alliances to leverage emerging market dynamics. Continued technological innovation, supportive government policies, and infrastructure development will be critical for sustained market progress.
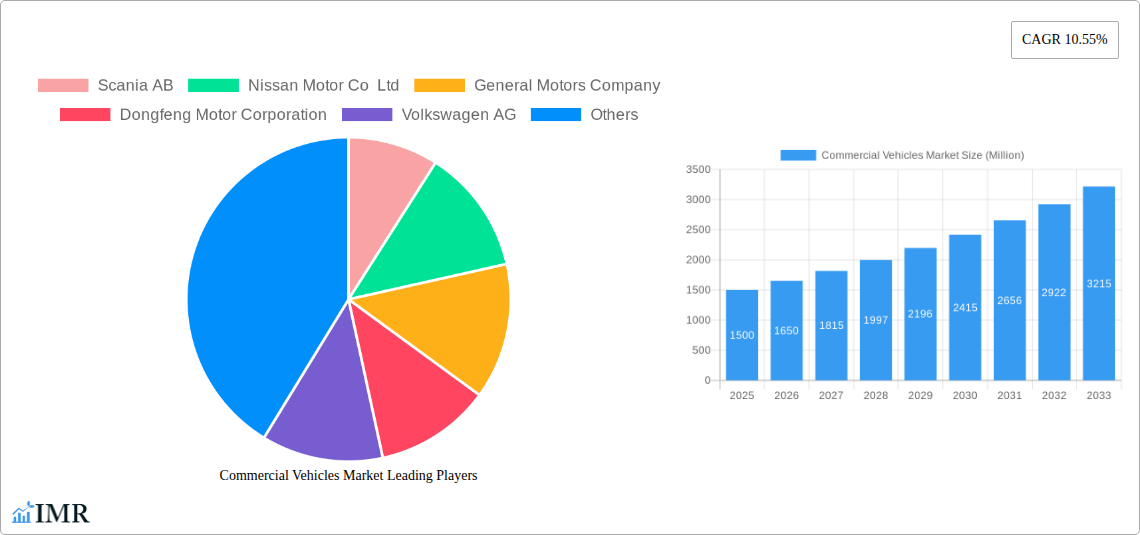
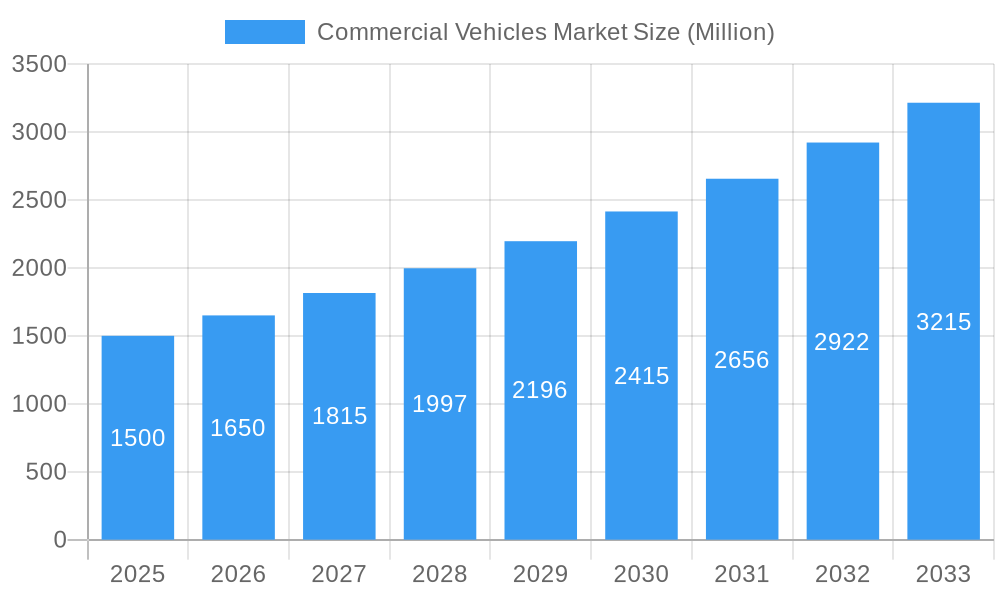
Commercial Vehicles Market Market Size (In Billion)
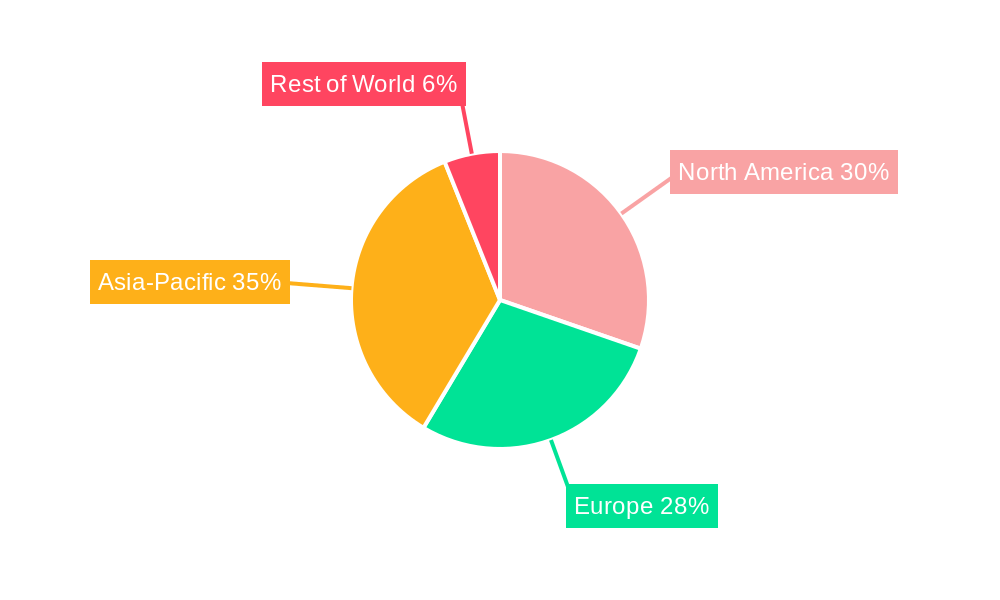
The competitive environment is characterized by intense rivalry between established automotive manufacturers and new entrants. Company success will be contingent upon their agility in adapting to evolving consumer demands, technological breakthroughs, and regulatory shifts. Market share distribution is expected to vary geographically, influenced by economic development, existing infrastructure, and governmental support for sustainable transport. Regions with strong economic growth and favorable policies for eco-friendly transportation are poised for accelerated market expansion. North America, Europe, and Asia-Pacific are anticipated to lead market share due to their established automotive manufacturing capabilities and substantial logistics requirements. The forecast period underscores a persistent emphasis on sustainability and technological advancement, signaling a transition towards advanced driver-assistance systems, enhanced connectivity, and a gradual move away from conventional fuel sources.
Commercial Vehicles Market Company Market Share
Commercial Vehicles Market: A Comprehensive Market Analysis (2019-2033)
This in-depth report provides a comprehensive analysis of the Commercial Vehicles Market, encompassing market dynamics, growth trends, regional dominance, product landscape, key challenges, and future opportunities. The study covers the period 2019-2033, with a focus on the forecast period 2025-2033 and a base year of 2025. The report segments the market by Vehicle Type (Commercial Vehicles), Propulsion Type (Hybrid and Electric Vehicles, including LPG), and analyzes key players' strategies across various regions. The market size is presented in Million Units.
Keywords: Commercial Vehicles Market, Hybrid Electric Vehicles, Electric Commercial Vehicles, LPG Commercial Vehicles, Market Size, Market Share, Market Growth, Industry Analysis, Market Forecast, Scania, Nissan, General Motors, Dongfeng, Volkswagen, Daimler, Tata Motors, BAIC, Volvo, Mahindra, BYD, SAIC GM, Renault, Toyota, Rivian, Ford.
Commercial Vehicles Market Dynamics & Structure
This section analyzes the Commercial Vehicles Market's structure, highlighting market concentration, technological innovations, regulatory landscapes, competitive substitutes, end-user demographics, and M&A activities. The market exhibits a moderately concentrated structure, with xx% market share held by the top five players in 2024.
- Market Concentration: Top 5 players hold xx% of the market share (2024). Increased competition is expected from new entrants and technological disruptions.
- Technological Innovation: The shift towards electric and hybrid vehicles is a major driver, fueled by stricter emission regulations and growing environmental concerns. Innovation in battery technology, charging infrastructure, and autonomous driving capabilities are key focus areas.
- Regulatory Frameworks: Governments worldwide are implementing stringent emission standards and fuel efficiency regulations, impacting vehicle design and production. Subsidies and incentives for electric commercial vehicles are also shaping market dynamics.
- Competitive Product Substitutes: Alternative transportation methods, such as rail freight and maritime shipping, present competitive pressure depending on the specific application.
- End-User Demographics: The growth is driven by increasing demand from logistics companies, e-commerce businesses, and the construction industry, amongst others. Different user segments display varying adoption rates of electric and hybrid technologies.
- M&A Trends: The past five years have witnessed xx M&A deals in the commercial vehicles sector, predominantly focused on consolidation and technological acquisitions (estimated value: xx million USD). This trend is expected to continue, driving further market consolidation. Innovation barriers include high R&D costs, especially for electric vehicles, and the need for extensive charging infrastructure development.
Commercial Vehicles Market Growth Trends & Insights
The global Commercial Vehicles Market is projected to experience significant growth during the forecast period (2025-2033). The market size is estimated at xx million units in 2025, and is expected to reach xx million units by 2033, exhibiting a CAGR of xx%. This growth is primarily driven by the increasing adoption of hybrid and electric commercial vehicles, fueled by environmental concerns, stringent emission regulations, and declining battery costs. The rising demand for efficient logistics solutions in booming e-commerce and urbanization further boosts the market's expansion. Consumer behavior is shifting towards sustainability, influencing purchasing decisions and increasing the demand for eco-friendly vehicles. Technological disruptions, particularly in battery technology and autonomous driving systems, play a crucial role in shaping market trends. Market penetration of electric commercial vehicles is projected to rise from xx% in 2025 to xx% by 2033.
Dominant Regions, Countries, or Segments in Commercial Vehicles Market
The [Region/Country Name - e.g., Europe or China] region currently dominates the global Commercial Vehicles market, accounting for xx% of the total market share in 2024. This dominance is attributed to:
- Strong Economic Growth: High economic activity leads to increased demand for commercial vehicles across various sectors.
- Developed Infrastructure: Well-established transportation networks facilitate the efficient movement of goods and support higher vehicle adoption.
- Supportive Government Policies: Policies that encourage the adoption of commercial vehicles (e.g., tax incentives, infrastructure investments) create a conducive environment for market growth.
- High Vehicle Density: The existing high number of vehicles in the region creates a large replacement market.
The Hybrid and Electric Vehicles segment shows the highest growth potential, with a projected CAGR of xx% during the forecast period. This is driven by governmental support and a focus on reducing emissions. The LPG segment maintains its relevance but faces pressure from electric alternatives.
Commercial Vehicles Market Product Landscape
The commercial vehicle market offers a diverse product range, from light-duty vans and trucks to heavy-duty construction equipment. Innovations focus on fuel efficiency, safety features, and emission reduction technologies. Electric and hybrid powertrains are becoming increasingly common, offering lower running costs and reduced environmental impact. Advanced driver-assistance systems (ADAS) and autonomous driving capabilities are being integrated for enhanced safety and operational efficiency. Unique selling propositions include enhanced payload capacity, improved fuel economy, and integrated telematics systems for fleet management.
Key Drivers, Barriers & Challenges in Commercial Vehicles Market
Key Drivers:
- Stringent Emission Regulations: Governments worldwide are pushing for cleaner transportation, making electric and hybrid vehicles more attractive.
- Technological Advancements: Improvements in battery technology and charging infrastructure are reducing the cost and improving the range of electric vehicles.
- Government Incentives: Subsidies and tax breaks are incentivizing the adoption of electric and hybrid commercial vehicles.
Challenges:
- High Initial Costs: The upfront investment for electric commercial vehicles remains a significant barrier to adoption, particularly for smaller businesses.
- Limited Charging Infrastructure: The lack of widespread charging infrastructure in many regions hinders the wider adoption of electric vehicles.
- Range Anxiety: Concerns about the limited driving range of electric vehicles remain a key obstacle for potential buyers. This translates into an estimated xx% reduction in potential sales in 2025.
Emerging Opportunities in Commercial Vehicles Market
Emerging opportunities include:
- Growth in E-commerce: The boom in online shopping is driving the demand for efficient last-mile delivery solutions.
- Autonomous Driving Technology: The integration of autonomous driving systems offers potential for increased efficiency and reduced labor costs.
- Electrification of Heavy-Duty Vehicles: Advancements in battery technology are making the electrification of heavier vehicles more feasible.
Growth Accelerators in the Commercial Vehicles Market Industry
Long-term growth is driven by technological advancements, specifically in battery technology and autonomous driving systems. Strategic partnerships between vehicle manufacturers and energy companies are crucial for expanding the charging infrastructure and developing innovative solutions. Market expansion into developing economies with growing infrastructure needs presents significant opportunities.
Key Players Shaping the Commercial Vehicles Market Market
- Scania AB
- Nissan Motor Co Ltd
- General Motors Company
- Dongfeng Motor Corporation
- Volkswagen AG
- Daimler AG (Mercedes-Benz AG)
- Tata Motors Limited
- BAIC Motor Corporation Ltd
- Volvo Group
- Mahindra & Mahindra Limited
- BYD Auto Co Ltd
- Saic General Motors Corporation Limited
- Groupe Renault
- Toyota Motor Corporation
- Rivian Automotive Inc
- Ford Motor Company
Notable Milestones in Commercial Vehicles Market Sector
- August 2023: General Motors announces the launch of an all-electric Cadillac Escalade in late 2024. This signifies a significant commitment to the electric vehicle market in the luxury SUV segment.
- August 2023: General Motors reinforces its commitment to an electric future in the Middle East, suggesting significant investment and market expansion plans in the region.
- August 2023: Toyota Kirloskar Motor launches the all-new MPV Vellfire strong hybrid electric vehicle (SHEV) in India, priced between INR 11.99 million and INR 12.99 million. This demonstrates the growing adoption of hybrid technology in emerging markets.
In-Depth Commercial Vehicles Market Market Outlook
The Commercial Vehicles Market is poised for sustained growth, driven by the ongoing shift towards sustainable transportation and technological innovations. The increasing demand for efficient logistics, coupled with supportive government policies and expanding charging infrastructure, will create lucrative opportunities for players in the market. Strategic partnerships, focused innovation in battery technology and autonomous driving, and successful market penetration in emerging economies will be pivotal for long-term success.
Commercial Vehicles Market Segmentation
-
1. Vehicle Type
-
1.1. Commercial Vehicles
- 1.1.1. Heavy-duty Commercial Trucks
- 1.1.2. Light Commercial Pick-up Trucks
- 1.1.3. Light Commercial Vans
- 1.1.4. Medium-duty Commercial Trucks
-
1.1. Commercial Vehicles
-
2. Propulsion Type
-
2.1. Hybrid and Electric Vehicles
-
2.1.1. By Fuel Category
- 2.1.1.1. BEV
- 2.1.1.2. FCEV
- 2.1.1.3. HEV
- 2.1.1.4. PHEV
-
2.1.1. By Fuel Category
-
2.2. ICE
- 2.2.1. CNG
- 2.2.2. Diesel
- 2.2.3. Gasoline
- 2.2.4. LPG
-
2.1. Hybrid and Electric Vehicles
Commercial Vehicles Market Segmentation By Geography
-
1. North America
- 1.1. United States
- 1.2. Canada
- 1.3. Mexico
-
2. South America
- 2.1. Brazil
- 2.2. Argentina
- 2.3. Rest of South America
-
3. Europe
- 3.1. United Kingdom
- 3.2. Germany
- 3.3. France
- 3.4. Italy
- 3.5. Spain
- 3.6. Russia
- 3.7. Benelux
- 3.8. Nordics
- 3.9. Rest of Europe
-
4. Middle East & Africa
- 4.1. Turkey
- 4.2. Israel
- 4.3. GCC
- 4.4. North Africa
- 4.5. South Africa
- 4.6. Rest of Middle East & Africa
-
5. Asia Pacific
- 5.1. China
- 5.2. India
- 5.3. Japan
- 5.4. South Korea
- 5.5. ASEAN
- 5.6. Oceania
- 5.7. Rest of Asia Pacific
Commercial Vehicles Market Regional Market Share
Geographic Coverage of Commercial Vehicles Market
Commercial Vehicles Market REPORT HIGHLIGHTS
| Aspects | Details |
|---|---|
| Study Period | 2020-2034 |
| Base Year | 2025 |
| Estimated Year | 2026 |
| Forecast Period | 2026-2034 |
| Historical Period | 2020-2025 |
| Growth Rate | CAGR of 5.74% from 2020-2034 |
| Segmentation |
|
Table of Contents
- 1. Introduction
- 1.1. Research Scope
- 1.2. Market Segmentation
- 1.3. Research Objective
- 1.4. Definitions and Assumptions
- 2. Executive Summary
- 2.1. Market Snapshot
- 3. Market Dynamics
- 3.1. Market Drivers
- 3.2. Market Restrains
- 3.3. Market Trends
- 3.4. Market Opportunities
- 4. Market Factor Analysis
- 4.1. Porters Five Forces
- 4.1.1. Bargaining Power of Suppliers
- 4.1.2. Bargaining Power of Buyers
- 4.1.3. Threat of New Entrants
- 4.1.4. Threat of Substitutes
- 4.1.5. Competitive Rivalry
- 4.2. PESTEL analysis
- 4.3. BCG Analysis
- 4.3.1. Stars (High Growth, High Market Share)
- 4.3.2. Cash Cows (Low Growth, High Market Share)
- 4.3.3. Question Mark (High Growth, Low Market Share)
- 4.3.4. Dogs (Low Growth, Low Market Share)
- 4.4. Ansoff Matrix Analysis
- 4.5. Supply Chain Analysis
- 4.6. Regulatory Landscape
- 4.7. Current Market Potential and Opportunity Assessment (TAM–SAM–SOM Framework)
- 4.8. IMR Analyst Note
- 4.1. Porters Five Forces
- 5. Market Analysis, Insights and Forecast 2021-2033
- 5.1. Market Analysis, Insights and Forecast - by Vehicle Type
- 5.1.1. Commercial Vehicles
- 5.1.1.1. Heavy-duty Commercial Trucks
- 5.1.1.2. Light Commercial Pick-up Trucks
- 5.1.1.3. Light Commercial Vans
- 5.1.1.4. Medium-duty Commercial Trucks
- 5.1.1. Commercial Vehicles
- 5.2. Market Analysis, Insights and Forecast - by Propulsion Type
- 5.2.1. Hybrid and Electric Vehicles
- 5.2.1.1. By Fuel Category
- 5.2.1.1.1. BEV
- 5.2.1.1.2. FCEV
- 5.2.1.1.3. HEV
- 5.2.1.1.4. PHEV
- 5.2.1.1. By Fuel Category
- 5.2.2. ICE
- 5.2.2.1. CNG
- 5.2.2.2. Diesel
- 5.2.2.3. Gasoline
- 5.2.2.4. LPG
- 5.2.1. Hybrid and Electric Vehicles
- 5.3. Market Analysis, Insights and Forecast - by Region
- 5.3.1. North America
- 5.3.2. South America
- 5.3.3. Europe
- 5.3.4. Middle East & Africa
- 5.3.5. Asia Pacific
- 5.1. Market Analysis, Insights and Forecast - by Vehicle Type
- 6. Global Commercial Vehicles Market Analysis, Insights and Forecast, 2021-2033
- 6.1. Market Analysis, Insights and Forecast - by Vehicle Type
- 6.1.1. Commercial Vehicles
- 6.1.1.1. Heavy-duty Commercial Trucks
- 6.1.1.2. Light Commercial Pick-up Trucks
- 6.1.1.3. Light Commercial Vans
- 6.1.1.4. Medium-duty Commercial Trucks
- 6.1.1. Commercial Vehicles
- 6.2. Market Analysis, Insights and Forecast - by Propulsion Type
- 6.2.1. Hybrid and Electric Vehicles
- 6.2.1.1. By Fuel Category
- 6.2.1.1.1. BEV
- 6.2.1.1.2. FCEV
- 6.2.1.1.3. HEV
- 6.2.1.1.4. PHEV
- 6.2.1.1. By Fuel Category
- 6.2.2. ICE
- 6.2.2.1. CNG
- 6.2.2.2. Diesel
- 6.2.2.3. Gasoline
- 6.2.2.4. LPG
- 6.2.1. Hybrid and Electric Vehicles
- 6.1. Market Analysis, Insights and Forecast - by Vehicle Type
- 7. North America Commercial Vehicles Market Analysis, Insights and Forecast, 2020-2032
- 7.1. Market Analysis, Insights and Forecast - by Vehicle Type
- 7.1.1. Commercial Vehicles
- 7.1.1.1. Heavy-duty Commercial Trucks
- 7.1.1.2. Light Commercial Pick-up Trucks
- 7.1.1.3. Light Commercial Vans
- 7.1.1.4. Medium-duty Commercial Trucks
- 7.1.1. Commercial Vehicles
- 7.2. Market Analysis, Insights and Forecast - by Propulsion Type
- 7.2.1. Hybrid and Electric Vehicles
- 7.2.1.1. By Fuel Category
- 7.2.1.1.1. BEV
- 7.2.1.1.2. FCEV
- 7.2.1.1.3. HEV
- 7.2.1.1.4. PHEV
- 7.2.1.1. By Fuel Category
- 7.2.2. ICE
- 7.2.2.1. CNG
- 7.2.2.2. Diesel
- 7.2.2.3. Gasoline
- 7.2.2.4. LPG
- 7.2.1. Hybrid and Electric Vehicles
- 7.1. Market Analysis, Insights and Forecast - by Vehicle Type
- 8. South America Commercial Vehicles Market Analysis, Insights and Forecast, 2020-2032
- 8.1. Market Analysis, Insights and Forecast - by Vehicle Type
- 8.1.1. Commercial Vehicles
- 8.1.1.1. Heavy-duty Commercial Trucks
- 8.1.1.2. Light Commercial Pick-up Trucks
- 8.1.1.3. Light Commercial Vans
- 8.1.1.4. Medium-duty Commercial Trucks
- 8.1.1. Commercial Vehicles
- 8.2. Market Analysis, Insights and Forecast - by Propulsion Type
- 8.2.1. Hybrid and Electric Vehicles
- 8.2.1.1. By Fuel Category
- 8.2.1.1.1. BEV
- 8.2.1.1.2. FCEV
- 8.2.1.1.3. HEV
- 8.2.1.1.4. PHEV
- 8.2.1.1. By Fuel Category
- 8.2.2. ICE
- 8.2.2.1. CNG
- 8.2.2.2. Diesel
- 8.2.2.3. Gasoline
- 8.2.2.4. LPG
- 8.2.1. Hybrid and Electric Vehicles
- 8.1. Market Analysis, Insights and Forecast - by Vehicle Type
- 9. Europe Commercial Vehicles Market Analysis, Insights and Forecast, 2020-2032
- 9.1. Market Analysis, Insights and Forecast - by Vehicle Type
- 9.1.1. Commercial Vehicles
- 9.1.1.1. Heavy-duty Commercial Trucks
- 9.1.1.2. Light Commercial Pick-up Trucks
- 9.1.1.3. Light Commercial Vans
- 9.1.1.4. Medium-duty Commercial Trucks
- 9.1.1. Commercial Vehicles
- 9.2. Market Analysis, Insights and Forecast - by Propulsion Type
- 9.2.1. Hybrid and Electric Vehicles
- 9.2.1.1. By Fuel Category
- 9.2.1.1.1. BEV
- 9.2.1.1.2. FCEV
- 9.2.1.1.3. HEV
- 9.2.1.1.4. PHEV
- 9.2.1.1. By Fuel Category
- 9.2.2. ICE
- 9.2.2.1. CNG
- 9.2.2.2. Diesel
- 9.2.2.3. Gasoline
- 9.2.2.4. LPG
- 9.2.1. Hybrid and Electric Vehicles
- 9.1. Market Analysis, Insights and Forecast - by Vehicle Type
- 10. Middle East & Africa Commercial Vehicles Market Analysis, Insights and Forecast, 2020-2032
- 10.1. Market Analysis, Insights and Forecast - by Vehicle Type
- 10.1.1. Commercial Vehicles
- 10.1.1.1. Heavy-duty Commercial Trucks
- 10.1.1.2. Light Commercial Pick-up Trucks
- 10.1.1.3. Light Commercial Vans
- 10.1.1.4. Medium-duty Commercial Trucks
- 10.1.1. Commercial Vehicles
- 10.2. Market Analysis, Insights and Forecast - by Propulsion Type
- 10.2.1. Hybrid and Electric Vehicles
- 10.2.1.1. By Fuel Category
- 10.2.1.1.1. BEV
- 10.2.1.1.2. FCEV
- 10.2.1.1.3. HEV
- 10.2.1.1.4. PHEV
- 10.2.1.1. By Fuel Category
- 10.2.2. ICE
- 10.2.2.1. CNG
- 10.2.2.2. Diesel
- 10.2.2.3. Gasoline
- 10.2.2.4. LPG
- 10.2.1. Hybrid and Electric Vehicles
- 10.1. Market Analysis, Insights and Forecast - by Vehicle Type
- 11. Asia Pacific Commercial Vehicles Market Analysis, Insights and Forecast, 2020-2032
- 11.1. Market Analysis, Insights and Forecast - by Vehicle Type
- 11.1.1. Commercial Vehicles
- 11.1.1.1. Heavy-duty Commercial Trucks
- 11.1.1.2. Light Commercial Pick-up Trucks
- 11.1.1.3. Light Commercial Vans
- 11.1.1.4. Medium-duty Commercial Trucks
- 11.1.1. Commercial Vehicles
- 11.2. Market Analysis, Insights and Forecast - by Propulsion Type
- 11.2.1. Hybrid and Electric Vehicles
- 11.2.1.1. By Fuel Category
- 11.2.1.1.1. BEV
- 11.2.1.1.2. FCEV
- 11.2.1.1.3. HEV
- 11.2.1.1.4. PHEV
- 11.2.1.1. By Fuel Category
- 11.2.2. ICE
- 11.2.2.1. CNG
- 11.2.2.2. Diesel
- 11.2.2.3. Gasoline
- 11.2.2.4. LPG
- 11.2.1. Hybrid and Electric Vehicles
- 11.1. Market Analysis, Insights and Forecast - by Vehicle Type
- 12. Competitive Analysis
- 12.1. Company Profiles
- 12.1.1 Scania AB
- 12.1.1.1. Company Overview
- 12.1.1.2. Products
- 12.1.1.3. Company Financials
- 12.1.1.4. SWOT Analysis
- 12.1.2 Nissan Motor Co Ltd
- 12.1.2.1. Company Overview
- 12.1.2.2. Products
- 12.1.2.3. Company Financials
- 12.1.2.4. SWOT Analysis
- 12.1.3 General Motors Company
- 12.1.3.1. Company Overview
- 12.1.3.2. Products
- 12.1.3.3. Company Financials
- 12.1.3.4. SWOT Analysis
- 12.1.4 Dongfeng Motor Corporation
- 12.1.4.1. Company Overview
- 12.1.4.2. Products
- 12.1.4.3. Company Financials
- 12.1.4.4. SWOT Analysis
- 12.1.5 Volkswagen AG
- 12.1.5.1. Company Overview
- 12.1.5.2. Products
- 12.1.5.3. Company Financials
- 12.1.5.4. SWOT Analysis
- 12.1.6 Daimler AG (Mercedes-Benz AG)
- 12.1.6.1. Company Overview
- 12.1.6.2. Products
- 12.1.6.3. Company Financials
- 12.1.6.4. SWOT Analysis
- 12.1.7 Tata Motors Limited
- 12.1.7.1. Company Overview
- 12.1.7.2. Products
- 12.1.7.3. Company Financials
- 12.1.7.4. SWOT Analysis
- 12.1.8 BAIC Motor Corporation Ltd
- 12.1.8.1. Company Overview
- 12.1.8.2. Products
- 12.1.8.3. Company Financials
- 12.1.8.4. SWOT Analysis
- 12.1.9 Volvo Grou
- 12.1.9.1. Company Overview
- 12.1.9.2. Products
- 12.1.9.3. Company Financials
- 12.1.9.4. SWOT Analysis
- 12.1.10 Mahindra & Mahindra Limited
- 12.1.10.1. Company Overview
- 12.1.10.2. Products
- 12.1.10.3. Company Financials
- 12.1.10.4. SWOT Analysis
- 12.1.11 BYD Auto Co Ltd
- 12.1.11.1. Company Overview
- 12.1.11.2. Products
- 12.1.11.3. Company Financials
- 12.1.11.4. SWOT Analysis
- 12.1.12 Saic General Motors Corporation Limited
- 12.1.12.1. Company Overview
- 12.1.12.2. Products
- 12.1.12.3. Company Financials
- 12.1.12.4. SWOT Analysis
- 12.1.13 Groupe Renault
- 12.1.13.1. Company Overview
- 12.1.13.2. Products
- 12.1.13.3. Company Financials
- 12.1.13.4. SWOT Analysis
- 12.1.14 Toyota Motor Corporation
- 12.1.14.1. Company Overview
- 12.1.14.2. Products
- 12.1.14.3. Company Financials
- 12.1.14.4. SWOT Analysis
- 12.1.15 Rivian Automotive Inc
- 12.1.15.1. Company Overview
- 12.1.15.2. Products
- 12.1.15.3. Company Financials
- 12.1.15.4. SWOT Analysis
- 12.1.16 Ford Motor Company
- 12.1.16.1. Company Overview
- 12.1.16.2. Products
- 12.1.16.3. Company Financials
- 12.1.16.4. SWOT Analysis
- 12.1.1 Scania AB
- 12.2. Market Entropy
- 12.2.1 Company's Key Areas Served
- 12.2.2 Recent Developments
- 12.3. Company Market Share Analysis 2025
- 12.3.1 Top 5 Companies Market Share Analysis
- 12.3.2 Top 3 Companies Market Share Analysis
- 12.4. List of Potential Customers
- 13. Research Methodology
List of Figures
- Figure 1: Global Commercial Vehicles Market Revenue Breakdown (billion, %) by Region 2025 & 2033
- Figure 2: North America Commercial Vehicles Market Revenue (billion), by Vehicle Type 2025 & 2033
- Figure 3: North America Commercial Vehicles Market Revenue Share (%), by Vehicle Type 2025 & 2033
- Figure 4: North America Commercial Vehicles Market Revenue (billion), by Propulsion Type 2025 & 2033
- Figure 5: North America Commercial Vehicles Market Revenue Share (%), by Propulsion Type 2025 & 2033
- Figure 6: North America Commercial Vehicles Market Revenue (billion), by Country 2025 & 2033
- Figure 7: North America Commercial Vehicles Market Revenue Share (%), by Country 2025 & 2033
- Figure 8: South America Commercial Vehicles Market Revenue (billion), by Vehicle Type 2025 & 2033
- Figure 9: South America Commercial Vehicles Market Revenue Share (%), by Vehicle Type 2025 & 2033
- Figure 10: South America Commercial Vehicles Market Revenue (billion), by Propulsion Type 2025 & 2033
- Figure 11: South America Commercial Vehicles Market Revenue Share (%), by Propulsion Type 2025 & 2033
- Figure 12: South America Commercial Vehicles Market Revenue (billion), by Country 2025 & 2033
- Figure 13: South America Commercial Vehicles Market Revenue Share (%), by Country 2025 & 2033
- Figure 14: Europe Commercial Vehicles Market Revenue (billion), by Vehicle Type 2025 & 2033
- Figure 15: Europe Commercial Vehicles Market Revenue Share (%), by Vehicle Type 2025 & 2033
- Figure 16: Europe Commercial Vehicles Market Revenue (billion), by Propulsion Type 2025 & 2033
- Figure 17: Europe Commercial Vehicles Market Revenue Share (%), by Propulsion Type 2025 & 2033
- Figure 18: Europe Commercial Vehicles Market Revenue (billion), by Country 2025 & 2033
- Figure 19: Europe Commercial Vehicles Market Revenue Share (%), by Country 2025 & 2033
- Figure 20: Middle East & Africa Commercial Vehicles Market Revenue (billion), by Vehicle Type 2025 & 2033
- Figure 21: Middle East & Africa Commercial Vehicles Market Revenue Share (%), by Vehicle Type 2025 & 2033
- Figure 22: Middle East & Africa Commercial Vehicles Market Revenue (billion), by Propulsion Type 2025 & 2033
- Figure 23: Middle East & Africa Commercial Vehicles Market Revenue Share (%), by Propulsion Type 2025 & 2033
- Figure 24: Middle East & Africa Commercial Vehicles Market Revenue (billion), by Country 2025 & 2033
- Figure 25: Middle East & Africa Commercial Vehicles Market Revenue Share (%), by Country 2025 & 2033
- Figure 26: Asia Pacific Commercial Vehicles Market Revenue (billion), by Vehicle Type 2025 & 2033
- Figure 27: Asia Pacific Commercial Vehicles Market Revenue Share (%), by Vehicle Type 2025 & 2033
- Figure 28: Asia Pacific Commercial Vehicles Market Revenue (billion), by Propulsion Type 2025 & 2033
- Figure 29: Asia Pacific Commercial Vehicles Market Revenue Share (%), by Propulsion Type 2025 & 2033
- Figure 30: Asia Pacific Commercial Vehicles Market Revenue (billion), by Country 2025 & 2033
- Figure 31: Asia Pacific Commercial Vehicles Market Revenue Share (%), by Country 2025 & 2033
List of Tables
- Table 1: Global Commercial Vehicles Market Revenue billion Forecast, by Vehicle Type 2020 & 2033
- Table 2: Global Commercial Vehicles Market Revenue billion Forecast, by Propulsion Type 2020 & 2033
- Table 3: Global Commercial Vehicles Market Revenue billion Forecast, by Region 2020 & 2033
- Table 4: Global Commercial Vehicles Market Revenue billion Forecast, by Vehicle Type 2020 & 2033
- Table 5: Global Commercial Vehicles Market Revenue billion Forecast, by Propulsion Type 2020 & 2033
- Table 6: Global Commercial Vehicles Market Revenue billion Forecast, by Country 2020 & 2033
- Table 7: United States Commercial Vehicles Market Revenue (billion) Forecast, by Application 2020 & 2033
- Table 8: Canada Commercial Vehicles Market Revenue (billion) Forecast, by Application 2020 & 2033
- Table 9: Mexico Commercial Vehicles Market Revenue (billion) Forecast, by Application 2020 & 2033
- Table 10: Global Commercial Vehicles Market Revenue billion Forecast, by Vehicle Type 2020 & 2033
- Table 11: Global Commercial Vehicles Market Revenue billion Forecast, by Propulsion Type 2020 & 2033
- Table 12: Global Commercial Vehicles Market Revenue billion Forecast, by Country 2020 & 2033
- Table 13: Brazil Commercial Vehicles Market Revenue (billion) Forecast, by Application 2020 & 2033
- Table 14: Argentina Commercial Vehicles Market Revenue (billion) Forecast, by Application 2020 & 2033
- Table 15: Rest of South America Commercial Vehicles Market Revenue (billion) Forecast, by Application 2020 & 2033
- Table 16: Global Commercial Vehicles Market Revenue billion Forecast, by Vehicle Type 2020 & 2033
- Table 17: Global Commercial Vehicles Market Revenue billion Forecast, by Propulsion Type 2020 & 2033
- Table 18: Global Commercial Vehicles Market Revenue billion Forecast, by Country 2020 & 2033
- Table 19: United Kingdom Commercial Vehicles Market Revenue (billion) Forecast, by Application 2020 & 2033
- Table 20: Germany Commercial Vehicles Market Revenue (billion) Forecast, by Application 2020 & 2033
- Table 21: France Commercial Vehicles Market Revenue (billion) Forecast, by Application 2020 & 2033
- Table 22: Italy Commercial Vehicles Market Revenue (billion) Forecast, by Application 2020 & 2033
- Table 23: Spain Commercial Vehicles Market Revenue (billion) Forecast, by Application 2020 & 2033
- Table 24: Russia Commercial Vehicles Market Revenue (billion) Forecast, by Application 2020 & 2033
- Table 25: Benelux Commercial Vehicles Market Revenue (billion) Forecast, by Application 2020 & 2033
- Table 26: Nordics Commercial Vehicles Market Revenue (billion) Forecast, by Application 2020 & 2033
- Table 27: Rest of Europe Commercial Vehicles Market Revenue (billion) Forecast, by Application 2020 & 2033
- Table 28: Global Commercial Vehicles Market Revenue billion Forecast, by Vehicle Type 2020 & 2033
- Table 29: Global Commercial Vehicles Market Revenue billion Forecast, by Propulsion Type 2020 & 2033
- Table 30: Global Commercial Vehicles Market Revenue billion Forecast, by Country 2020 & 2033
- Table 31: Turkey Commercial Vehicles Market Revenue (billion) Forecast, by Application 2020 & 2033
- Table 32: Israel Commercial Vehicles Market Revenue (billion) Forecast, by Application 2020 & 2033
- Table 33: GCC Commercial Vehicles Market Revenue (billion) Forecast, by Application 2020 & 2033
- Table 34: North Africa Commercial Vehicles Market Revenue (billion) Forecast, by Application 2020 & 2033
- Table 35: South Africa Commercial Vehicles Market Revenue (billion) Forecast, by Application 2020 & 2033
- Table 36: Rest of Middle East & Africa Commercial Vehicles Market Revenue (billion) Forecast, by Application 2020 & 2033
- Table 37: Global Commercial Vehicles Market Revenue billion Forecast, by Vehicle Type 2020 & 2033
- Table 38: Global Commercial Vehicles Market Revenue billion Forecast, by Propulsion Type 2020 & 2033
- Table 39: Global Commercial Vehicles Market Revenue billion Forecast, by Country 2020 & 2033
- Table 40: China Commercial Vehicles Market Revenue (billion) Forecast, by Application 2020 & 2033
- Table 41: India Commercial Vehicles Market Revenue (billion) Forecast, by Application 2020 & 2033
- Table 42: Japan Commercial Vehicles Market Revenue (billion) Forecast, by Application 2020 & 2033
- Table 43: South Korea Commercial Vehicles Market Revenue (billion) Forecast, by Application 2020 & 2033
- Table 44: ASEAN Commercial Vehicles Market Revenue (billion) Forecast, by Application 2020 & 2033
- Table 45: Oceania Commercial Vehicles Market Revenue (billion) Forecast, by Application 2020 & 2033
- Table 46: Rest of Asia Pacific Commercial Vehicles Market Revenue (billion) Forecast, by Application 2020 & 2033
Frequently Asked Questions
1. What is the projected Compound Annual Growth Rate (CAGR) of the Commercial Vehicles Market?
The projected CAGR is approximately 5.74%.
2. Which companies are prominent players in the Commercial Vehicles Market?
Key companies in the market include Scania AB, Nissan Motor Co Ltd, General Motors Company, Dongfeng Motor Corporation, Volkswagen AG, Daimler AG (Mercedes-Benz AG), Tata Motors Limited, BAIC Motor Corporation Ltd, Volvo Grou, Mahindra & Mahindra Limited, BYD Auto Co Ltd, Saic General Motors Corporation Limited, Groupe Renault, Toyota Motor Corporation, Rivian Automotive Inc, Ford Motor Company.
3. What are the main segments of the Commercial Vehicles Market?
The market segments include Vehicle Type, Propulsion Type.
4. Can you provide details about the market size?
The market size is estimated to be USD 839.97 billion as of 2022.
5. What are some drivers contributing to market growth?
Growing Travel and Tourism Industry is Driving the Car Rental Market.
6. What are the notable trends driving market growth?
OTHER KEY INDUSTRY TRENDS COVERED IN THE REPORT.
7. Are there any restraints impacting market growth?
Increasing Popularity of Ride-Sharing Services Pose Challenges for the Conventional Car Rental Market.
8. Can you provide examples of recent developments in the market?
August 2023: General Motors will launch an all-electric Cadillac Escalade in late 2024August 2023: General Motors doubles down on plans for an electric future in the Middle East.August 2023: Toyota Kirloskar Motor launched the all-new MPV Vellfire strong hybrid electric vehicle (SHEV) for a starting price of INR 11.99 million and going to INR 12.99 million.
9. What pricing options are available for accessing the report?
Pricing options include single-user, multi-user, and enterprise licenses priced at USD 3800, USD 4500, and USD 5800 respectively.
10. Is the market size provided in terms of value or volume?
The market size is provided in terms of value, measured in billion.
11. Are there any specific market keywords associated with the report?
Yes, the market keyword associated with the report is "Commercial Vehicles Market," which aids in identifying and referencing the specific market segment covered.
12. How do I determine which pricing option suits my needs best?
The pricing options vary based on user requirements and access needs. Individual users may opt for single-user licenses, while businesses requiring broader access may choose multi-user or enterprise licenses for cost-effective access to the report.
13. Are there any additional resources or data provided in the Commercial Vehicles Market report?
While the report offers comprehensive insights, it's advisable to review the specific contents or supplementary materials provided to ascertain if additional resources or data are available.
14. How can I stay updated on further developments or reports in the Commercial Vehicles Market?
To stay informed about further developments, trends, and reports in the Commercial Vehicles Market, consider subscribing to industry newsletters, following relevant companies and organizations, or regularly checking reputable industry news sources and publications.
Methodology
Step 1 - Identification of Relevant Samples Size from Population Database


Step 2 - Approaches for Defining Global Market Size (Value, Volume* & Price*)

Note*: In applicable scenarios
Step 3 - Data Sources
Primary Research
- Web Analytics
- Survey Reports
- Research Institute
- Latest Research Reports
- Opinion Leaders
Secondary Research
- Annual Reports
- White Paper
- Latest Press Release
- Industry Association
- Paid Database
- Investor Presentations

Step 4 - Data Triangulation
Involves using different sources of information in order to increase the validity of a study
These sources are likely to be stakeholders in a program - participants, other researchers, program staff, other community members, and so on.
Then we put all data in single framework & apply various statistical tools to find out the dynamic on the market.
During the analysis stage, feedback from the stakeholder groups would be compared to determine areas of agreement as well as areas of divergence