

Key Insights
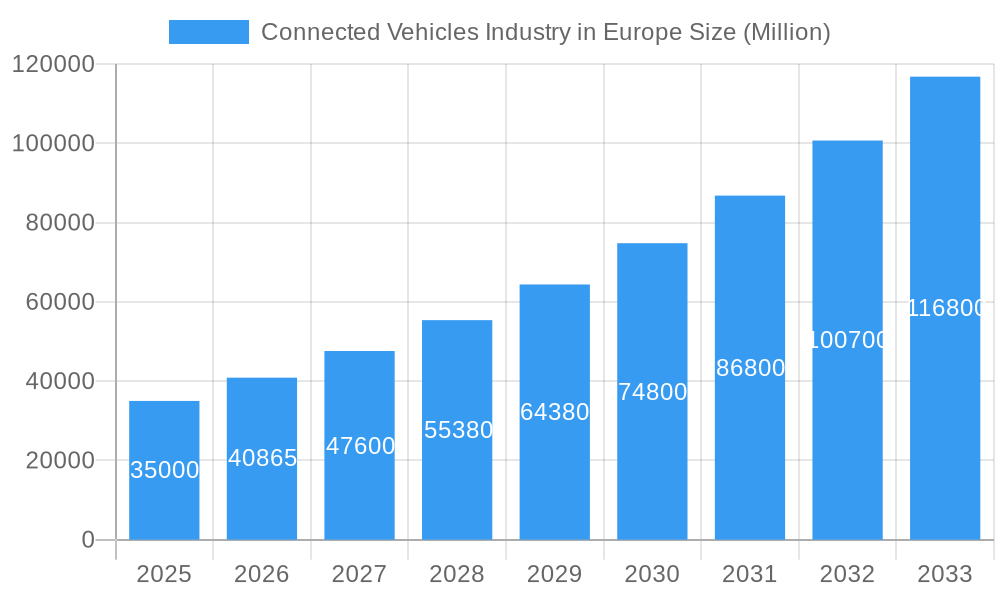
The European connected vehicles market is poised for significant expansion, fueled by escalating demand for advanced driver-assistance systems (ADAS), sophisticated in-car entertainment, and the widespread adoption of connected car services. The market is projected to grow at a Compound Annual Growth Rate (CAGR) of 19.8%. With a base year of 2025, the market size is estimated at 119.27 billion by 2033. Key catalysts for this growth include stringent government mandates advocating for enhanced road safety and the advancement of autonomous driving technologies. The pervasive use of smartphones and their seamless integration with vehicle systems, coupled with a growing consumer preference for advanced comfort, convenience, and infotainment features, further propels market momentum. The market is segmented by end-user (OEM and aftermarket), key European countries (including Germany, France, and the UK), technology (navigation, entertainment, safety, vehicle management), connectivity type (integrated, embedded, tethered), and vehicle-to-everything (V2X) communication. Germany, France, and the United Kingdom currently dominate market share due to high vehicle ownership and advanced technological infrastructure, with growth trends mirroring across other European nations, fostering a vibrant and competitive market.
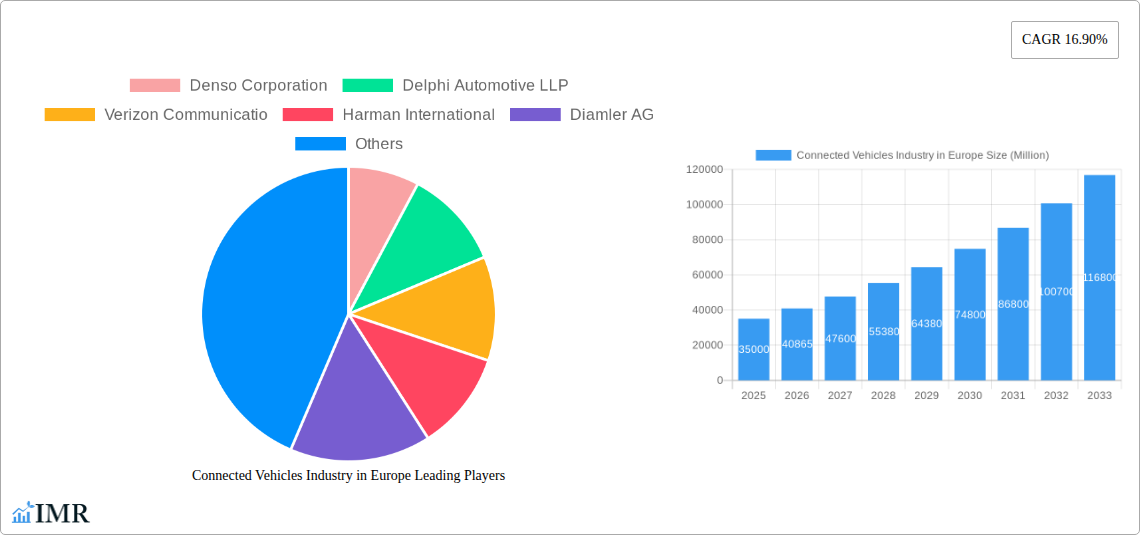
Connected Vehicles Industry in Europe Market Size (In Billion)
The competitive arena features a blend of established automotive original equipment manufacturers (OEMs) such as BMW, Daimler, and Audi, alongside leading technology providers including Bosch, Continental, Denso, and Harman, and telecommunications giants like Verizon. These key players are channeling substantial investments into research and development, focusing on innovations in 5G connectivity, artificial intelligence, and robust cybersecurity solutions. Despite this promising trajectory, the market's expansion is tempered by challenges including data security and privacy concerns, the substantial upfront investment required for implementation, and the ongoing necessity for consistent infrastructure development across varied European regions. Effectively navigating these challenges will be paramount for sustaining the continued growth of the connected vehicle market in Europe.
Connected Vehicles Industry in Europe Company Market Share
Connected Vehicles Industry in Europe: Market Report 2019-2033
This comprehensive report provides a detailed analysis of the Connected Vehicles industry in Europe, covering market dynamics, growth trends, dominant segments, and key players. The study period spans from 2019 to 2033, with a base year of 2025 and a forecast period of 2025-2033. This report is essential for OEMs, aftermarket suppliers, technology providers, investors, and anyone seeking to understand this rapidly evolving market. The European connected vehicle market is poised for significant growth, driven by technological advancements, supportive government regulations, and increasing consumer demand for enhanced safety and convenience features. This report delves into the intricacies of this dynamic landscape, offering crucial insights for strategic decision-making.
Connected Vehicles Industry in Europe Market Dynamics & Structure
The European connected vehicles market exhibits a moderately consolidated structure, with several large players holding significant market share. Technological innovation, particularly in areas like 5G connectivity, V2X communication, and advanced driver-assistance systems (ADAS), is a key driver. Stringent regulatory frameworks focused on safety and data privacy are shaping market development. Competition from established automotive players and new entrants is intense. The market is witnessing a surge in M&A activity, with companies consolidating to expand their product portfolios and geographic reach.
- Market Concentration: The top 5 players hold approximately xx% of the market share in 2025.
- Technological Innovation: 5G rollout and the development of sophisticated ADAS are major growth drivers.
- Regulatory Landscape: Stricter regulations concerning data security and autonomous driving are impacting product development.
- Competitive Landscape: Intense competition among established players and the emergence of new technology providers are reshaping the market dynamics.
- M&A Activity: An estimated xx M&A deals were completed in the period 2019-2024.
Connected Vehicles Industry in Europe Growth Trends & Insights
The European connected vehicles market is experiencing robust growth, driven by increasing vehicle production, rising consumer disposable incomes, and the growing adoption of connected car technologies. The market size is expected to reach xx million units by 2025, growing at a CAGR of xx% from 2025 to 2033. This growth is fueled by technological advancements, such as improved connectivity solutions, enhanced infotainment systems, and the expansion of V2X communication. Consumer preferences are shifting towards vehicles equipped with advanced safety features and integrated connectivity solutions. The increased adoption of smartphones and the rise of data-driven services further contributes to the market expansion.
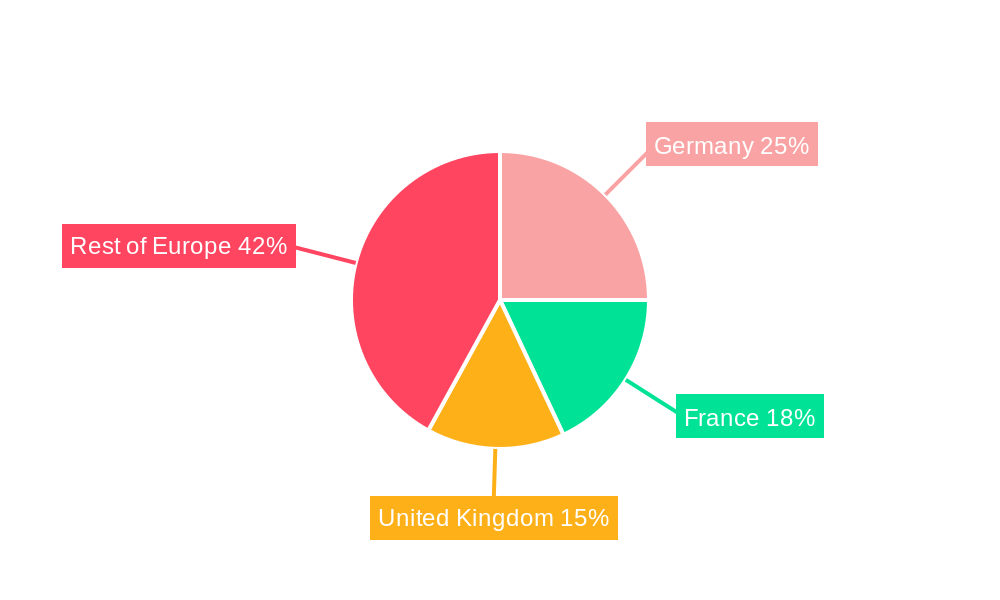
Dominant Regions, Countries, or Segments in Connected Vehicles Industry in Europe
Germany, the UK, and France are leading the European connected vehicles market, driven by strong automotive manufacturing bases, high vehicle ownership rates, and favorable government policies. The OEM segment accounts for the largest market share, followed by the aftermarket. Safety technology dominates the technology type segment, reflecting growing concerns about road safety. Integrated connectivity is the most widely adopted type, reflecting the demand for seamless connectivity and data integration. V2X communication is gaining traction, driven by the potential to enhance road safety and traffic efficiency.
- Leading Regions: Germany (xx million units in 2025), UK (xx million units in 2025), France (xx million units in 2025).
- Dominant Segment (By End-User): OEMs (xx% market share in 2025).
- Key Technology Type: Safety (xx% market share in 2025).
- Primary Connectivity Type: Integrated (xx% market share in 2025).
- Prominent Vehicle Connectivity Type: V2V (xx% market share in 2025).
Connected Vehicles Industry in Europe Product Landscape
The European connected vehicles market offers a diverse range of products, including telematics devices, infotainment systems, ADAS, and V2X communication solutions. Products are differentiated based on features, performance, and integration capabilities. Key innovations include advanced driver assistance features, improved user interfaces, and enhanced security measures. The focus is on seamless integration with smartphones and other devices, providing a user-friendly experience. The market is witnessing a shift towards cloud-based solutions to offer enhanced data analytics and personalized services.
Key Drivers, Barriers & Challenges in Connected Vehicles Industry in Europe
Key Drivers: Growing consumer demand for advanced safety features, increasing government regulations promoting connected car technology, and the expanding adoption of 5G connectivity.
Challenges: High initial investment costs, concerns about data security and privacy, and the complexity of integrating various technologies. Supply chain disruptions have led to delays in production and increased costs. The high cost of developing and implementing V2X infrastructure presents a significant challenge.
Emerging Opportunities in Connected Vehicles Industry in Europe
Opportunities lie in the expansion of V2X communication, the development of innovative infotainment systems, and the growth of data-driven services. The rise of autonomous driving technology offers significant potential. Untapped markets in smaller European countries present promising opportunities for growth. The increasing demand for personalized in-car experiences creates opportunities for tailored infotainment and connected services.
Growth Accelerators in the Connected Vehicles Industry in Europe Industry
Technological advancements, strategic partnerships among automotive manufacturers, technology companies and telecommunication providers, and supportive government policies are accelerating market growth. Expansion into new markets and the development of innovative applications are enhancing market penetration and driving growth. The automotive industry's focus on electrification and the integration of connected car technologies will further accelerate growth.
Key Players Shaping the Connected Vehicles Industry in Europe Market
Notable Milestones in Connected Vehicles Industry in Europe Sector
- May 2022: Volkswagen Group and SEAT SA announced a EUR 10 billion investment in electrifying Europe, including battery plant construction.
- February 2021: Robert Bosch partnered with Microsoft to develop a vehicle development platform for connected vehicles.
- February 2021: Harman acquired Savari Inc. to advance V2X communication technology using 5G.
In-Depth Connected Vehicles Industry in Europe Market Outlook
The European connected vehicles market is poised for sustained growth, driven by technological advancements, regulatory support, and rising consumer demand. Strategic partnerships and investments in infrastructure will further accelerate market expansion. The integration of connected car technologies into electric vehicles represents a significant growth opportunity. Future market potential is substantial, with opportunities across various segments, including ADAS, V2X, and data-driven services.
Connected Vehicles Industry in Europe Segmentation
-
1. Technology Type
- 1.1. Navigation
- 1.2. Entertainment
- 1.3. Safety
- 1.4. Vehicle Management
- 1.5. Other Technology Types
-
2. Connectivity Type
- 2.1. Integrated
- 2.2. Embedded
- 2.3. Tethered
-
3. Vehicle Connectivity Type
- 3.1. V2Vehicle
- 3.2. V2Infrastructure
- 3.3. V2X
-
4. End-User Type
- 4.1. OEM
- 4.2. Aftermarket
Connected Vehicles Industry in Europe Segmentation By Geography
-
1. North America
- 1.1. United States
- 1.2. Canada
- 1.3. Mexico
-
2. South America
- 2.1. Brazil
- 2.2. Argentina
- 2.3. Rest of South America
-
3. Europe
- 3.1. United Kingdom
- 3.2. Germany
- 3.3. France
- 3.4. Italy
- 3.5. Spain
- 3.6. Russia
- 3.7. Benelux
- 3.8. Nordics
- 3.9. Rest of Europe
-
4. Middle East & Africa
- 4.1. Turkey
- 4.2. Israel
- 4.3. GCC
- 4.4. North Africa
- 4.5. South Africa
- 4.6. Rest of Middle East & Africa
-
5. Asia Pacific
- 5.1. China
- 5.2. India
- 5.3. Japan
- 5.4. South Korea
- 5.5. ASEAN
- 5.6. Oceania
- 5.7. Rest of Asia Pacific
Connected Vehicles Industry in Europe Regional Market Share
Geographic Coverage of Connected Vehicles Industry in Europe
Connected Vehicles Industry in Europe REPORT HIGHLIGHTS
| Aspects | Details |
|---|---|
| Study Period | 2020-2034 |
| Base Year | 2025 |
| Estimated Year | 2026 |
| Forecast Period | 2026-2034 |
| Historical Period | 2020-2025 |
| Growth Rate | CAGR of 19.8% from 2020-2034 |
| Segmentation |
|
Table of Contents
- 1. Introduction
- 1.1. Research Scope
- 1.2. Market Segmentation
- 1.3. Research Methodology
- 1.4. Definitions and Assumptions
- 2. Executive Summary
- 2.1. Introduction
- 3. Market Dynamics
- 3.1. Introduction
- 3.2. Market Drivers
- 3.2.1. Integration With Telematics And Fleet Management Systems; Others
- 3.3. Market Restrains
- 3.3.1. The Initial Costs Associated With Purchasing And Installing ELD Systems is High; Others
- 3.4. Market Trends
- 3.4.1. Introduction of 5G Network and Increased Use of IoT Applications
- 4. Market Factor Analysis
- 4.1. Porters Five Forces
- 4.2. Supply/Value Chain
- 4.3. PESTEL analysis
- 4.4. Market Entropy
- 4.5. Patent/Trademark Analysis
- 5. Global Connected Vehicles Industry in Europe Analysis, Insights and Forecast, 2020-2032
- 5.1. Market Analysis, Insights and Forecast - by Technology Type
- 5.1.1. Navigation
- 5.1.2. Entertainment
- 5.1.3. Safety
- 5.1.4. Vehicle Management
- 5.1.5. Other Technology Types
- 5.2. Market Analysis, Insights and Forecast - by Connectivity Type
- 5.2.1. Integrated
- 5.2.2. Embedded
- 5.2.3. Tethered
- 5.3. Market Analysis, Insights and Forecast - by Vehicle Connectivity Type
- 5.3.1. V2Vehicle
- 5.3.2. V2Infrastructure
- 5.3.3. V2X
- 5.4. Market Analysis, Insights and Forecast - by End-User Type
- 5.4.1. OEM
- 5.4.2. Aftermarket
- 5.5. Market Analysis, Insights and Forecast - by Region
- 5.5.1. North America
- 5.5.2. South America
- 5.5.3. Europe
- 5.5.4. Middle East & Africa
- 5.5.5. Asia Pacific
- 5.1. Market Analysis, Insights and Forecast - by Technology Type
- 6. North America Connected Vehicles Industry in Europe Analysis, Insights and Forecast, 2020-2032
- 6.1. Market Analysis, Insights and Forecast - by Technology Type
- 6.1.1. Navigation
- 6.1.2. Entertainment
- 6.1.3. Safety
- 6.1.4. Vehicle Management
- 6.1.5. Other Technology Types
- 6.2. Market Analysis, Insights and Forecast - by Connectivity Type
- 6.2.1. Integrated
- 6.2.2. Embedded
- 6.2.3. Tethered
- 6.3. Market Analysis, Insights and Forecast - by Vehicle Connectivity Type
- 6.3.1. V2Vehicle
- 6.3.2. V2Infrastructure
- 6.3.3. V2X
- 6.4. Market Analysis, Insights and Forecast - by End-User Type
- 6.4.1. OEM
- 6.4.2. Aftermarket
- 6.1. Market Analysis, Insights and Forecast - by Technology Type
- 7. South America Connected Vehicles Industry in Europe Analysis, Insights and Forecast, 2020-2032
- 7.1. Market Analysis, Insights and Forecast - by Technology Type
- 7.1.1. Navigation
- 7.1.2. Entertainment
- 7.1.3. Safety
- 7.1.4. Vehicle Management
- 7.1.5. Other Technology Types
- 7.2. Market Analysis, Insights and Forecast - by Connectivity Type
- 7.2.1. Integrated
- 7.2.2. Embedded
- 7.2.3. Tethered
- 7.3. Market Analysis, Insights and Forecast - by Vehicle Connectivity Type
- 7.3.1. V2Vehicle
- 7.3.2. V2Infrastructure
- 7.3.3. V2X
- 7.4. Market Analysis, Insights and Forecast - by End-User Type
- 7.4.1. OEM
- 7.4.2. Aftermarket
- 7.1. Market Analysis, Insights and Forecast - by Technology Type
- 8. Europe Connected Vehicles Industry in Europe Analysis, Insights and Forecast, 2020-2032
- 8.1. Market Analysis, Insights and Forecast - by Technology Type
- 8.1.1. Navigation
- 8.1.2. Entertainment
- 8.1.3. Safety
- 8.1.4. Vehicle Management
- 8.1.5. Other Technology Types
- 8.2. Market Analysis, Insights and Forecast - by Connectivity Type
- 8.2.1. Integrated
- 8.2.2. Embedded
- 8.2.3. Tethered
- 8.3. Market Analysis, Insights and Forecast - by Vehicle Connectivity Type
- 8.3.1. V2Vehicle
- 8.3.2. V2Infrastructure
- 8.3.3. V2X
- 8.4. Market Analysis, Insights and Forecast - by End-User Type
- 8.4.1. OEM
- 8.4.2. Aftermarket
- 8.1. Market Analysis, Insights and Forecast - by Technology Type
- 9. Middle East & Africa Connected Vehicles Industry in Europe Analysis, Insights and Forecast, 2020-2032
- 9.1. Market Analysis, Insights and Forecast - by Technology Type
- 9.1.1. Navigation
- 9.1.2. Entertainment
- 9.1.3. Safety
- 9.1.4. Vehicle Management
- 9.1.5. Other Technology Types
- 9.2. Market Analysis, Insights and Forecast - by Connectivity Type
- 9.2.1. Integrated
- 9.2.2. Embedded
- 9.2.3. Tethered
- 9.3. Market Analysis, Insights and Forecast - by Vehicle Connectivity Type
- 9.3.1. V2Vehicle
- 9.3.2. V2Infrastructure
- 9.3.3. V2X
- 9.4. Market Analysis, Insights and Forecast - by End-User Type
- 9.4.1. OEM
- 9.4.2. Aftermarket
- 9.1. Market Analysis, Insights and Forecast - by Technology Type
- 10. Asia Pacific Connected Vehicles Industry in Europe Analysis, Insights and Forecast, 2020-2032
- 10.1. Market Analysis, Insights and Forecast - by Technology Type
- 10.1.1. Navigation
- 10.1.2. Entertainment
- 10.1.3. Safety
- 10.1.4. Vehicle Management
- 10.1.5. Other Technology Types
- 10.2. Market Analysis, Insights and Forecast - by Connectivity Type
- 10.2.1. Integrated
- 10.2.2. Embedded
- 10.2.3. Tethered
- 10.3. Market Analysis, Insights and Forecast - by Vehicle Connectivity Type
- 10.3.1. V2Vehicle
- 10.3.2. V2Infrastructure
- 10.3.3. V2X
- 10.4. Market Analysis, Insights and Forecast - by End-User Type
- 10.4.1. OEM
- 10.4.2. Aftermarket
- 10.1. Market Analysis, Insights and Forecast - by Technology Type
- 11. Competitive Analysis
- 11.1. Global Market Share Analysis 2025
- 11.2. Company Profiles
- 11.2.1 Denso Corporation
- 11.2.1.1. Overview
- 11.2.1.2. Products
- 11.2.1.3. SWOT Analysis
- 11.2.1.4. Recent Developments
- 11.2.1.5. Financials (Based on Availability)
- 11.2.2 Delphi Automotive LLP
- 11.2.2.1. Overview
- 11.2.2.2. Products
- 11.2.2.3. SWOT Analysis
- 11.2.2.4. Recent Developments
- 11.2.2.5. Financials (Based on Availability)
- 11.2.3 Verizon Communicatio
- 11.2.3.1. Overview
- 11.2.3.2. Products
- 11.2.3.3. SWOT Analysis
- 11.2.3.4. Recent Developments
- 11.2.3.5. Financials (Based on Availability)
- 11.2.4 Harman International
- 11.2.4.1. Overview
- 11.2.4.2. Products
- 11.2.4.3. SWOT Analysis
- 11.2.4.4. Recent Developments
- 11.2.4.5. Financials (Based on Availability)
- 11.2.5 Diamler AG
- 11.2.5.1. Overview
- 11.2.5.2. Products
- 11.2.5.3. SWOT Analysis
- 11.2.5.4. Recent Developments
- 11.2.5.5. Financials (Based on Availability)
- 11.2.6 Continental AG
- 11.2.6.1. Overview
- 11.2.6.2. Products
- 11.2.6.3. SWOT Analysis
- 11.2.6.4. Recent Developments
- 11.2.6.5. Financials (Based on Availability)
- 11.2.7 Autoliv Inc
- 11.2.7.1. Overview
- 11.2.7.2. Products
- 11.2.7.3. SWOT Analysis
- 11.2.7.4. Recent Developments
- 11.2.7.5. Financials (Based on Availability)
- 11.2.8 Robert Bosch GmbH
- 11.2.8.1. Overview
- 11.2.8.2. Products
- 11.2.8.3. SWOT Analysis
- 11.2.8.4. Recent Developments
- 11.2.8.5. Financials (Based on Availability)
- 11.2.9 BMW Group
- 11.2.9.1. Overview
- 11.2.9.2. Products
- 11.2.9.3. SWOT Analysis
- 11.2.9.4. Recent Developments
- 11.2.9.5. Financials (Based on Availability)
- 11.2.10 Audi AG
- 11.2.10.1. Overview
- 11.2.10.2. Products
- 11.2.10.3. SWOT Analysis
- 11.2.10.4. Recent Developments
- 11.2.10.5. Financials (Based on Availability)
- 11.2.1 Denso Corporation
List of Figures
- Figure 1: Global Connected Vehicles Industry in Europe Revenue Breakdown (billion, %) by Region 2025 & 2033
- Figure 2: North America Connected Vehicles Industry in Europe Revenue (billion), by Technology Type 2025 & 2033
- Figure 3: North America Connected Vehicles Industry in Europe Revenue Share (%), by Technology Type 2025 & 2033
- Figure 4: North America Connected Vehicles Industry in Europe Revenue (billion), by Connectivity Type 2025 & 2033
- Figure 5: North America Connected Vehicles Industry in Europe Revenue Share (%), by Connectivity Type 2025 & 2033
- Figure 6: North America Connected Vehicles Industry in Europe Revenue (billion), by Vehicle Connectivity Type 2025 & 2033
- Figure 7: North America Connected Vehicles Industry in Europe Revenue Share (%), by Vehicle Connectivity Type 2025 & 2033
- Figure 8: North America Connected Vehicles Industry in Europe Revenue (billion), by End-User Type 2025 & 2033
- Figure 9: North America Connected Vehicles Industry in Europe Revenue Share (%), by End-User Type 2025 & 2033
- Figure 10: North America Connected Vehicles Industry in Europe Revenue (billion), by Country 2025 & 2033
- Figure 11: North America Connected Vehicles Industry in Europe Revenue Share (%), by Country 2025 & 2033
- Figure 12: South America Connected Vehicles Industry in Europe Revenue (billion), by Technology Type 2025 & 2033
- Figure 13: South America Connected Vehicles Industry in Europe Revenue Share (%), by Technology Type 2025 & 2033
- Figure 14: South America Connected Vehicles Industry in Europe Revenue (billion), by Connectivity Type 2025 & 2033
- Figure 15: South America Connected Vehicles Industry in Europe Revenue Share (%), by Connectivity Type 2025 & 2033
- Figure 16: South America Connected Vehicles Industry in Europe Revenue (billion), by Vehicle Connectivity Type 2025 & 2033
- Figure 17: South America Connected Vehicles Industry in Europe Revenue Share (%), by Vehicle Connectivity Type 2025 & 2033
- Figure 18: South America Connected Vehicles Industry in Europe Revenue (billion), by End-User Type 2025 & 2033
- Figure 19: South America Connected Vehicles Industry in Europe Revenue Share (%), by End-User Type 2025 & 2033
- Figure 20: South America Connected Vehicles Industry in Europe Revenue (billion), by Country 2025 & 2033
- Figure 21: South America Connected Vehicles Industry in Europe Revenue Share (%), by Country 2025 & 2033
- Figure 22: Europe Connected Vehicles Industry in Europe Revenue (billion), by Technology Type 2025 & 2033
- Figure 23: Europe Connected Vehicles Industry in Europe Revenue Share (%), by Technology Type 2025 & 2033
- Figure 24: Europe Connected Vehicles Industry in Europe Revenue (billion), by Connectivity Type 2025 & 2033
- Figure 25: Europe Connected Vehicles Industry in Europe Revenue Share (%), by Connectivity Type 2025 & 2033
- Figure 26: Europe Connected Vehicles Industry in Europe Revenue (billion), by Vehicle Connectivity Type 2025 & 2033
- Figure 27: Europe Connected Vehicles Industry in Europe Revenue Share (%), by Vehicle Connectivity Type 2025 & 2033
- Figure 28: Europe Connected Vehicles Industry in Europe Revenue (billion), by End-User Type 2025 & 2033
- Figure 29: Europe Connected Vehicles Industry in Europe Revenue Share (%), by End-User Type 2025 & 2033
- Figure 30: Europe Connected Vehicles Industry in Europe Revenue (billion), by Country 2025 & 2033
- Figure 31: Europe Connected Vehicles Industry in Europe Revenue Share (%), by Country 2025 & 2033
- Figure 32: Middle East & Africa Connected Vehicles Industry in Europe Revenue (billion), by Technology Type 2025 & 2033
- Figure 33: Middle East & Africa Connected Vehicles Industry in Europe Revenue Share (%), by Technology Type 2025 & 2033
- Figure 34: Middle East & Africa Connected Vehicles Industry in Europe Revenue (billion), by Connectivity Type 2025 & 2033
- Figure 35: Middle East & Africa Connected Vehicles Industry in Europe Revenue Share (%), by Connectivity Type 2025 & 2033
- Figure 36: Middle East & Africa Connected Vehicles Industry in Europe Revenue (billion), by Vehicle Connectivity Type 2025 & 2033
- Figure 37: Middle East & Africa Connected Vehicles Industry in Europe Revenue Share (%), by Vehicle Connectivity Type 2025 & 2033
- Figure 38: Middle East & Africa Connected Vehicles Industry in Europe Revenue (billion), by End-User Type 2025 & 2033
- Figure 39: Middle East & Africa Connected Vehicles Industry in Europe Revenue Share (%), by End-User Type 2025 & 2033
- Figure 40: Middle East & Africa Connected Vehicles Industry in Europe Revenue (billion), by Country 2025 & 2033
- Figure 41: Middle East & Africa Connected Vehicles Industry in Europe Revenue Share (%), by Country 2025 & 2033
- Figure 42: Asia Pacific Connected Vehicles Industry in Europe Revenue (billion), by Technology Type 2025 & 2033
- Figure 43: Asia Pacific Connected Vehicles Industry in Europe Revenue Share (%), by Technology Type 2025 & 2033
- Figure 44: Asia Pacific Connected Vehicles Industry in Europe Revenue (billion), by Connectivity Type 2025 & 2033
- Figure 45: Asia Pacific Connected Vehicles Industry in Europe Revenue Share (%), by Connectivity Type 2025 & 2033
- Figure 46: Asia Pacific Connected Vehicles Industry in Europe Revenue (billion), by Vehicle Connectivity Type 2025 & 2033
- Figure 47: Asia Pacific Connected Vehicles Industry in Europe Revenue Share (%), by Vehicle Connectivity Type 2025 & 2033
- Figure 48: Asia Pacific Connected Vehicles Industry in Europe Revenue (billion), by End-User Type 2025 & 2033
- Figure 49: Asia Pacific Connected Vehicles Industry in Europe Revenue Share (%), by End-User Type 2025 & 2033
- Figure 50: Asia Pacific Connected Vehicles Industry in Europe Revenue (billion), by Country 2025 & 2033
- Figure 51: Asia Pacific Connected Vehicles Industry in Europe Revenue Share (%), by Country 2025 & 2033
List of Tables
- Table 1: Global Connected Vehicles Industry in Europe Revenue billion Forecast, by Technology Type 2020 & 2033
- Table 2: Global Connected Vehicles Industry in Europe Revenue billion Forecast, by Connectivity Type 2020 & 2033
- Table 3: Global Connected Vehicles Industry in Europe Revenue billion Forecast, by Vehicle Connectivity Type 2020 & 2033
- Table 4: Global Connected Vehicles Industry in Europe Revenue billion Forecast, by End-User Type 2020 & 2033
- Table 5: Global Connected Vehicles Industry in Europe Revenue billion Forecast, by Region 2020 & 2033
- Table 6: Global Connected Vehicles Industry in Europe Revenue billion Forecast, by Technology Type 2020 & 2033
- Table 7: Global Connected Vehicles Industry in Europe Revenue billion Forecast, by Connectivity Type 2020 & 2033
- Table 8: Global Connected Vehicles Industry in Europe Revenue billion Forecast, by Vehicle Connectivity Type 2020 & 2033
- Table 9: Global Connected Vehicles Industry in Europe Revenue billion Forecast, by End-User Type 2020 & 2033
- Table 10: Global Connected Vehicles Industry in Europe Revenue billion Forecast, by Country 2020 & 2033
- Table 11: United States Connected Vehicles Industry in Europe Revenue (billion) Forecast, by Application 2020 & 2033
- Table 12: Canada Connected Vehicles Industry in Europe Revenue (billion) Forecast, by Application 2020 & 2033
- Table 13: Mexico Connected Vehicles Industry in Europe Revenue (billion) Forecast, by Application 2020 & 2033
- Table 14: Global Connected Vehicles Industry in Europe Revenue billion Forecast, by Technology Type 2020 & 2033
- Table 15: Global Connected Vehicles Industry in Europe Revenue billion Forecast, by Connectivity Type 2020 & 2033
- Table 16: Global Connected Vehicles Industry in Europe Revenue billion Forecast, by Vehicle Connectivity Type 2020 & 2033
- Table 17: Global Connected Vehicles Industry in Europe Revenue billion Forecast, by End-User Type 2020 & 2033
- Table 18: Global Connected Vehicles Industry in Europe Revenue billion Forecast, by Country 2020 & 2033
- Table 19: Brazil Connected Vehicles Industry in Europe Revenue (billion) Forecast, by Application 2020 & 2033
- Table 20: Argentina Connected Vehicles Industry in Europe Revenue (billion) Forecast, by Application 2020 & 2033
- Table 21: Rest of South America Connected Vehicles Industry in Europe Revenue (billion) Forecast, by Application 2020 & 2033
- Table 22: Global Connected Vehicles Industry in Europe Revenue billion Forecast, by Technology Type 2020 & 2033
- Table 23: Global Connected Vehicles Industry in Europe Revenue billion Forecast, by Connectivity Type 2020 & 2033
- Table 24: Global Connected Vehicles Industry in Europe Revenue billion Forecast, by Vehicle Connectivity Type 2020 & 2033
- Table 25: Global Connected Vehicles Industry in Europe Revenue billion Forecast, by End-User Type 2020 & 2033
- Table 26: Global Connected Vehicles Industry in Europe Revenue billion Forecast, by Country 2020 & 2033
- Table 27: United Kingdom Connected Vehicles Industry in Europe Revenue (billion) Forecast, by Application 2020 & 2033
- Table 28: Germany Connected Vehicles Industry in Europe Revenue (billion) Forecast, by Application 2020 & 2033
- Table 29: France Connected Vehicles Industry in Europe Revenue (billion) Forecast, by Application 2020 & 2033
- Table 30: Italy Connected Vehicles Industry in Europe Revenue (billion) Forecast, by Application 2020 & 2033
- Table 31: Spain Connected Vehicles Industry in Europe Revenue (billion) Forecast, by Application 2020 & 2033
- Table 32: Russia Connected Vehicles Industry in Europe Revenue (billion) Forecast, by Application 2020 & 2033
- Table 33: Benelux Connected Vehicles Industry in Europe Revenue (billion) Forecast, by Application 2020 & 2033
- Table 34: Nordics Connected Vehicles Industry in Europe Revenue (billion) Forecast, by Application 2020 & 2033
- Table 35: Rest of Europe Connected Vehicles Industry in Europe Revenue (billion) Forecast, by Application 2020 & 2033
- Table 36: Global Connected Vehicles Industry in Europe Revenue billion Forecast, by Technology Type 2020 & 2033
- Table 37: Global Connected Vehicles Industry in Europe Revenue billion Forecast, by Connectivity Type 2020 & 2033
- Table 38: Global Connected Vehicles Industry in Europe Revenue billion Forecast, by Vehicle Connectivity Type 2020 & 2033
- Table 39: Global Connected Vehicles Industry in Europe Revenue billion Forecast, by End-User Type 2020 & 2033
- Table 40: Global Connected Vehicles Industry in Europe Revenue billion Forecast, by Country 2020 & 2033
- Table 41: Turkey Connected Vehicles Industry in Europe Revenue (billion) Forecast, by Application 2020 & 2033
- Table 42: Israel Connected Vehicles Industry in Europe Revenue (billion) Forecast, by Application 2020 & 2033
- Table 43: GCC Connected Vehicles Industry in Europe Revenue (billion) Forecast, by Application 2020 & 2033
- Table 44: North Africa Connected Vehicles Industry in Europe Revenue (billion) Forecast, by Application 2020 & 2033
- Table 45: South Africa Connected Vehicles Industry in Europe Revenue (billion) Forecast, by Application 2020 & 2033
- Table 46: Rest of Middle East & Africa Connected Vehicles Industry in Europe Revenue (billion) Forecast, by Application 2020 & 2033
- Table 47: Global Connected Vehicles Industry in Europe Revenue billion Forecast, by Technology Type 2020 & 2033
- Table 48: Global Connected Vehicles Industry in Europe Revenue billion Forecast, by Connectivity Type 2020 & 2033
- Table 49: Global Connected Vehicles Industry in Europe Revenue billion Forecast, by Vehicle Connectivity Type 2020 & 2033
- Table 50: Global Connected Vehicles Industry in Europe Revenue billion Forecast, by End-User Type 2020 & 2033
- Table 51: Global Connected Vehicles Industry in Europe Revenue billion Forecast, by Country 2020 & 2033
- Table 52: China Connected Vehicles Industry in Europe Revenue (billion) Forecast, by Application 2020 & 2033
- Table 53: India Connected Vehicles Industry in Europe Revenue (billion) Forecast, by Application 2020 & 2033
- Table 54: Japan Connected Vehicles Industry in Europe Revenue (billion) Forecast, by Application 2020 & 2033
- Table 55: South Korea Connected Vehicles Industry in Europe Revenue (billion) Forecast, by Application 2020 & 2033
- Table 56: ASEAN Connected Vehicles Industry in Europe Revenue (billion) Forecast, by Application 2020 & 2033
- Table 57: Oceania Connected Vehicles Industry in Europe Revenue (billion) Forecast, by Application 2020 & 2033
- Table 58: Rest of Asia Pacific Connected Vehicles Industry in Europe Revenue (billion) Forecast, by Application 2020 & 2033
Frequently Asked Questions
1. What is the projected Compound Annual Growth Rate (CAGR) of the Connected Vehicles Industry in Europe?
The projected CAGR is approximately 19.8%.
2. Which companies are prominent players in the Connected Vehicles Industry in Europe?
Key companies in the market include Denso Corporation, Delphi Automotive LLP, Verizon Communicatio, Harman International, Diamler AG, Continental AG, Autoliv Inc, Robert Bosch GmbH, BMW Group, Audi AG.
3. What are the main segments of the Connected Vehicles Industry in Europe?
The market segments include Technology Type, Connectivity Type, Vehicle Connectivity Type, End-User Type.
4. Can you provide details about the market size?
The market size is estimated to be USD 119.27 billion as of 2022.
5. What are some drivers contributing to market growth?
Integration With Telematics And Fleet Management Systems; Others.
6. What are the notable trends driving market growth?
Introduction of 5G Network and Increased Use of IoT Applications.
7. Are there any restraints impacting market growth?
The Initial Costs Associated With Purchasing And Installing ELD Systems is High; Others.
8. Can you provide examples of recent developments in the market?
In May 2022, Volkswagen Group and SEAT SA announced their strategic vision to mobilize EUR 10 billion for electrifying Europe. Under this plan, companies will construct battery plants to fast forward goals with the 62 national and international companies, benchmark firms, and Transformation programs for electric and connected vehicles.
9. What pricing options are available for accessing the report?
Pricing options include single-user, multi-user, and enterprise licenses priced at USD 4750, USD 4950, and USD 6800 respectively.
10. Is the market size provided in terms of value or volume?
The market size is provided in terms of value, measured in billion.
11. Are there any specific market keywords associated with the report?
Yes, the market keyword associated with the report is "Connected Vehicles Industry in Europe," which aids in identifying and referencing the specific market segment covered.
12. How do I determine which pricing option suits my needs best?
The pricing options vary based on user requirements and access needs. Individual users may opt for single-user licenses, while businesses requiring broader access may choose multi-user or enterprise licenses for cost-effective access to the report.
13. Are there any additional resources or data provided in the Connected Vehicles Industry in Europe report?
While the report offers comprehensive insights, it's advisable to review the specific contents or supplementary materials provided to ascertain if additional resources or data are available.
14. How can I stay updated on further developments or reports in the Connected Vehicles Industry in Europe?
To stay informed about further developments, trends, and reports in the Connected Vehicles Industry in Europe, consider subscribing to industry newsletters, following relevant companies and organizations, or regularly checking reputable industry news sources and publications.
Methodology
Step 1 - Identification of Relevant Samples Size from Population Database


Step 2 - Approaches for Defining Global Market Size (Value, Volume* & Price*)

Note*: In applicable scenarios
Step 3 - Data Sources
Primary Research
- Web Analytics
- Survey Reports
- Research Institute
- Latest Research Reports
- Opinion Leaders
Secondary Research
- Annual Reports
- White Paper
- Latest Press Release
- Industry Association
- Paid Database
- Investor Presentations

Step 4 - Data Triangulation
Involves using different sources of information in order to increase the validity of a study
These sources are likely to be stakeholders in a program - participants, other researchers, program staff, other community members, and so on.
Then we put all data in single framework & apply various statistical tools to find out the dynamic on the market.
During the analysis stage, feedback from the stakeholder groups would be compared to determine areas of agreement as well as areas of divergence