

Key Insights
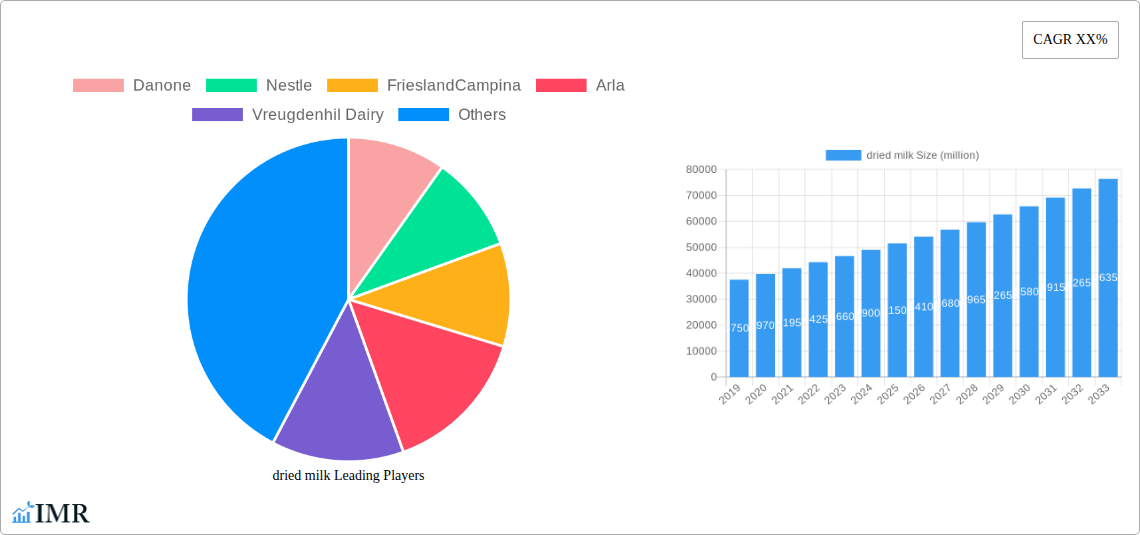
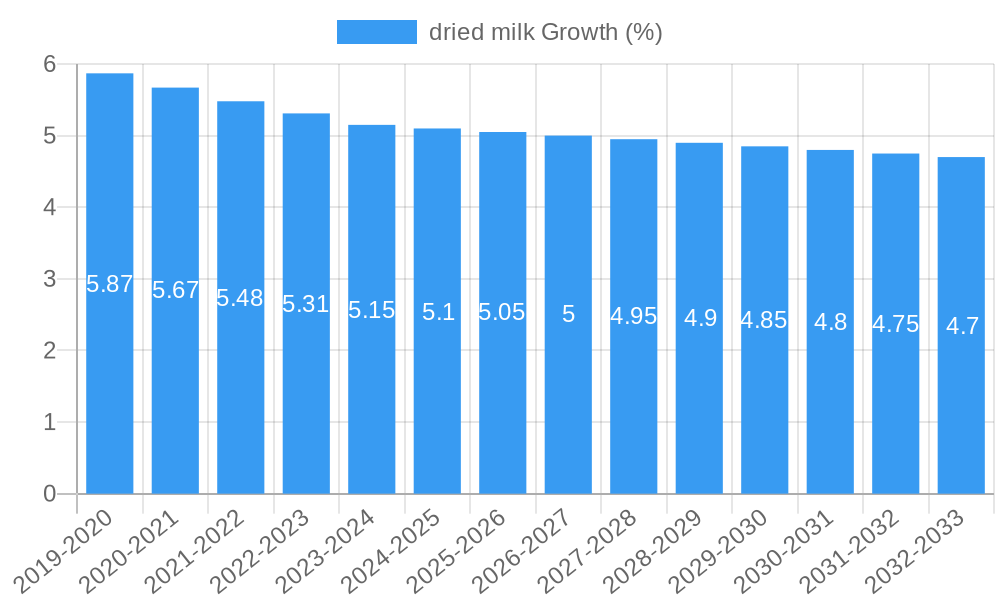
The global dried milk market is poised for significant expansion, projected to reach an estimated USD 55,000 million by 2025. This robust growth trajectory is fueled by a compelling CAGR of 6.5% between 2019 and 2033, indicating a sustained upward trend. The market's vitality is largely attributed to the increasing demand for convenient and shelf-stable dairy alternatives, particularly in burgeoning economies. Key drivers include the expanding food processing industry, the rising popularity of bakery goods, and the pervasive use of dried milk in infant nutrition. Furthermore, the growing health consciousness among consumers, leading to a preference for fortified and low-fat dairy options, is also playing a crucial role in market expansion. The versatility of dried milk in various food applications, from dairy products processing to snacks and confectionery, ensures its widespread adoption and continued market relevance.
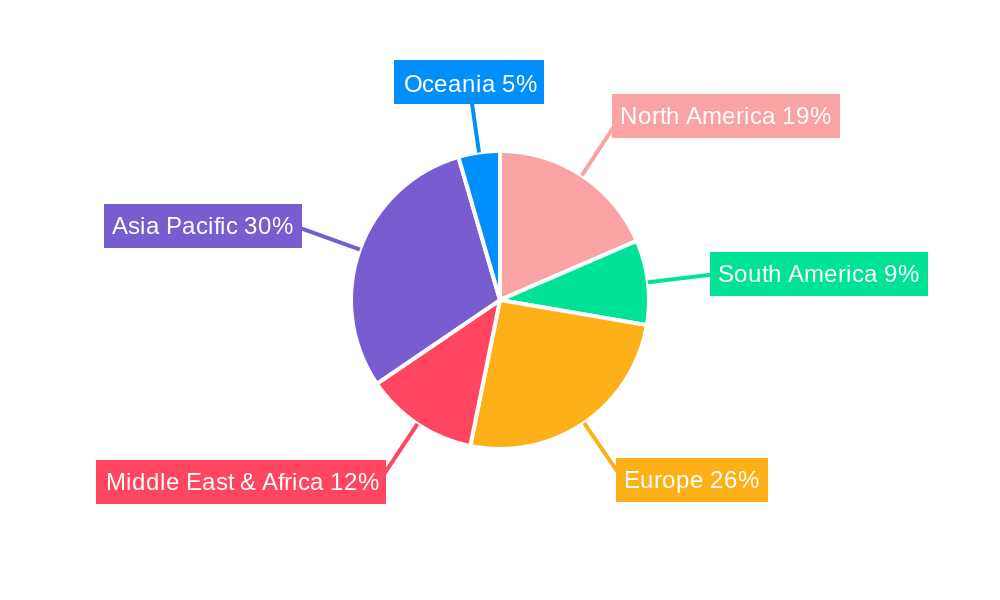
Despite the overwhelmingly positive outlook, certain restraints may temper this growth. Volatile raw milk prices, influenced by agricultural cycles and global supply-demand dynamics, could impact profit margins for manufacturers. Moreover, increasing competition from plant-based milk alternatives, which cater to a growing vegan and lactose-intolerant population, presents a notable challenge. However, the inherent nutritional benefits and established consumer trust in dairy products are expected to counterbalance these headwinds. The market is segmented into Skim Fat Dried Milk and Whole Fat Dried Milk, with a substantial "Others" category likely encompassing specialty and fortified variants. Geographically, Asia Pacific, driven by China and India's massive populations and rapidly developing economies, is expected to dominate market share, followed by Europe and North America. Key players such as Danone, Nestle, and FrieslandCampina are strategically investing in innovation and expanding their production capacities to capitalize on these evolving market dynamics.
Comprehensive Report on the Global Dried Milk Market: Dynamics, Trends, and Future Outlook (2019-2033)
This in-depth report provides a definitive analysis of the global dried milk market, a vital commodity underpinning numerous food and beverage industries. Spanning a comprehensive study period from 2019 to 2033, with a base year of 2025, this report leverages expert insights and extensive data to illuminate market dynamics, growth trajectories, regional dominance, product innovations, key players, and future opportunities. Designed for industry professionals, investors, and strategic planners, this report offers actionable intelligence to navigate the evolving landscape of the dried milk sector.
dried milk Market Dynamics & Structure
The global dried milk market exhibits a moderately concentrated structure, characterized by the significant presence of multinational corporations alongside a growing number of regional and specialized manufacturers. Technological innovation remains a key driver, with advancements in spray drying and evaporation technologies enhancing product quality, shelf-life, and nutritional profiles, leading to increased demand. Regulatory frameworks, particularly those concerning food safety, labeling, and import/export regulations in key consuming regions like Europe and North America, play a crucial role in shaping market entry and product development.
- Market Concentration: Leading players hold a substantial market share, estimated at over 60% by revenue in 2025. However, the emergence of specialized producers catering to niche applications is gradually increasing competitive intensity.
- Technological Innovation: Ongoing R&D focuses on optimizing energy efficiency in drying processes and developing specialized dried milk powders with enhanced functional properties, such as improved emulsification and solubility for confectionery and infant formula applications.
- Regulatory Frameworks: Strict adherence to standards set by bodies like the FDA (US), EFSA (EU), and Codex Alimentarius is paramount. Innovations are often driven by the need to meet evolving nutritional and safety requirements, such as reduced lactose content or enhanced vitamin fortification.
- Competitive Product Substitutes: While direct substitutes are limited, the availability of alternative protein sources and liquid dairy products presents indirect competition. However, the superior shelf-life and transportation efficiency of dried milk ensure its sustained demand.
- End-User Demographics: The primary end-users include dairy product processors, bakeries, snack manufacturers, and the food service industry. Growing demand for convenience foods and ready-to-eat meals is a significant demographic shift benefiting the dried milk market.
- M&A Trends: Mergers and acquisitions are observed as key players seek to expand their geographical reach, consolidate production capabilities, and acquire innovative technologies or market access. In the historical period (2019-2024), an estimated 12 significant M&A deals were recorded, with a combined value of approximately $1.2 billion.
dried milk Growth Trends & Insights
The global dried milk market is projected for robust growth, driven by a confluence of factors including burgeoning global population, increasing disposable incomes, and a rising demand for convenient and shelf-stable food products. The market size, estimated at $XX billion in 2025, is anticipated to expand at a Compound Annual Growth Rate (CAGR) of approximately 4.5% from 2025 to 2033. This growth is underpinned by significant shifts in consumer behavior and technological advancements that enhance the utility and appeal of dried milk products across diverse applications.
The historical period from 2019 to 2024 witnessed steady expansion, fueled by the confectionery and bakery sectors' consistent demand for cost-effective and versatile dairy ingredients. The widespread adoption of skim fat dried milk (SFDM) in low-fat product formulations and whole fat dried milk (WFD) in richer formulations has solidified their market positions. The COVID-19 pandemic, while initially causing supply chain disruptions, also highlighted the importance of shelf-stable ingredients, indirectly boosting the demand for dried milk for home baking and emergency food supplies.
Technological disruptions, particularly in processing and packaging, are continuously refining the market. Innovations in microencapsulation techniques are enhancing the stability of sensitive nutrients and fats within dried milk powders, opening avenues for specialized nutritional products. Furthermore, improvements in rehydration properties and solubility are making dried milk more user-friendly for industrial applications and consumers alike.
Consumer behavior is evolving towards a greater emphasis on health and wellness, which in turn influences the demand for dried milk. There is a growing preference for dried milk fortified with essential vitamins and minerals, catering to the demand for fortified foods and beverages. The increasing popularity of plant-based alternatives has created a competitive segment, but the inherent nutritional profile and established supply chains of dairy-derived dried milk ensure its continued relevance. Market penetration of specialty dried milk products, such as instantized milk powders and lactose-free variants, is on the rise, driven by specific dietary needs and preferences. The expansion of the e-commerce channel has also made dried milk more accessible to a wider consumer base, contributing to increased adoption rates, particularly in emerging economies. The overarching trend is towards higher value-added dried milk products that offer enhanced nutritional benefits and functional properties.
Dominant Regions, Countries, or Segments in dried milk
The global dried milk market’s dominance is currently driven by the Application segment of Dairy Products Processing, which accounts for an estimated 45% of the total market value in 2025. This segment's leadership stems from the extensive use of dried milk as a fundamental ingredient in the manufacturing of a wide array of dairy products, including cheese, yogurt, ice cream, and various milk-based beverages. The convenience, cost-effectiveness, and extended shelf-life offered by dried milk make it an indispensable component in large-scale dairy production, particularly in regions with robust dairy industries and established processing infrastructure.
Dairy Products Processing Dominance:
- Market Share: This application segment is projected to hold a market share of approximately 45% in 2025, with a steady CAGR of 4.8% during the forecast period (2025-2033).
- Key Drivers: The growing global demand for processed dairy products, especially in emerging economies in Asia-Pacific and Latin America, directly translates into increased consumption of dried milk. The cost-effectiveness of reconstituting milk from powder compared to sourcing fresh milk in certain logistics-challenged areas further bolsters its position.
- Growth Potential: Expansion of cheese and yogurt production, particularly in regions with rising disposable incomes and evolving dietary habits, presents significant growth potential for dried milk. Innovations in creating specialized dairy blends incorporating dried milk for enhanced texture and nutritional profiles also contribute.
Regional Dominance: North America and Europe:
- Market Share: These regions collectively accounted for an estimated 55% of the global dried milk market in 2024, with North America leading due to its advanced dairy processing industry and Europe following closely with its established food manufacturing sector.
- Key Drivers: High per capita consumption of dairy products, sophisticated food processing technologies, and strong regulatory frameworks ensuring product quality and safety are key drivers. The presence of major dairy cooperatives and large-scale manufacturers in these regions ensures consistent demand and supply.
- Growth Potential: While mature markets, continued innovation in value-added dairy products, demand for functional foods, and the export of dried milk to other regions offer sustained growth. Strict quality standards also make these regions key exporters of premium dried milk products.
Segment Dominance: Skim Fat Dried Milk (SFDM):
- Market Share: SFDM is the leading type, representing an estimated 52% of the dried milk market value in 2025. Its versatility and suitability for low-fat product formulations drive its widespread adoption.
- Key Drivers: The global health trend favoring reduced fat intake, coupled with the extensive use of SFDM in infant formula, bakery products, and confectionery, fuels its demand. Its lower fat content also makes it more cost-effective for certain applications.
- Growth Potential: Continued emphasis on health and wellness, coupled with the growing infant nutrition market, will ensure sustained demand. Opportunities exist in developing enhanced SFDM products with improved solubility and functional properties for specific food applications.
The Bakery application segment is another significant contributor, holding an estimated 25% market share in 2025, driven by the need for extended shelf-life, improved dough conditioning, and enhanced flavor in baked goods. The Snacks segment, accounting for approximately 15% in 2025, utilizes dried milk for its creamy texture and flavor in confectioneries and other snack products. The Others segment, encompassing pharmaceuticals, animal feed, and food service, represents the remaining 15%, with niche but growing applications.
dried milk Product Landscape
The dried milk product landscape is characterized by continuous innovation aimed at enhancing nutritional value, functionality, and consumer convenience. Key product types include Skim Fat Dried Milk (SFDM) and Whole Fat Dried Milk (WFD), with SFDM dominating due to its versatility in low-fat formulations and extensive use in infant nutrition. Technological advancements in spray-drying and evaporation have led to improved solubility, dispersibility, and shelf-life, creating unique selling propositions.
New product developments focus on specialized applications, such as instantized milk powders for easy reconstitution in beverages and bakery mixes. Protein-enriched dried milk variants are emerging to cater to the health and sports nutrition markets. Furthermore, efforts are being made to improve the sensory attributes and emulsifying properties of dried milk for confectionery and dairy alternative applications. The overall trend is towards higher-value, functional dried milk ingredients that meet specific dietary needs and manufacturing requirements.
Key Drivers, Barriers & Challenges in dried milk
The global dried milk market is propelled by several key drivers. The increasing demand for processed and convenience foods worldwide, particularly in emerging economies, is a primary growth engine. Nutritional fortification of dried milk with essential vitamins and minerals caters to the growing health and wellness trend, expanding its appeal in infant nutrition and functional food segments. Technological advancements in drying and processing techniques enhance product quality, shelf-life, and functionality, making dried milk more attractive to manufacturers. The inherent cost-effectiveness and transportation efficiency of dried milk compared to liquid dairy also contribute significantly.
- Key Drivers:
- Rising global demand for convenience foods and beverages.
- Growing infant nutrition market and demand for fortified products.
- Technological advancements leading to improved quality and functionality.
- Cost-effectiveness and logistical advantages over liquid milk.
However, the market faces notable barriers and challenges. Fluctuations in raw milk prices, influenced by seasonal availability and global supply-demand dynamics, can impact production costs and profitability. Stringent food safety regulations and varying import/export policies across different countries can create trade complexities and compliance burdens. The increasing consumer preference for plant-based alternatives presents a competitive threat, especially in certain beverage and dessert categories. Supply chain disruptions, as witnessed during global health crises, can also pose significant challenges to consistent availability and timely delivery.
- Key Barriers & Challenges:
- Volatility in raw milk prices.
- Complex and evolving regulatory landscapes.
- Competition from plant-based dairy alternatives.
- Supply chain vulnerabilities and logistical complexities.
- Need for continuous innovation to meet evolving consumer demands.
Emerging Opportunities in dried milk
Emerging opportunities within the dried milk sector lie in the development of niche, value-added products and the exploration of new application areas. The burgeoning demand for specialized nutritional products, such as lactose-free dried milk, probiotic-fortified variants, and those catering to specific allergen sensitivities, presents significant potential.
- Untapped Markets: Expansion into developing economies with growing middle classes and increasing consumption of processed foods offers substantial untapped market potential.
- Innovative Applications: Exploring the use of dried milk in novel food formulations, such as ready-to-eat meal components, specialized bakery ingredients, and sports nutrition supplements, can open new revenue streams.
- Evolving Consumer Preferences: Catering to the demand for ethically sourced and sustainably produced dried milk, along with improved transparency in the supply chain, can attract a growing segment of conscious consumers. The development of shelf-stable, single-serving dried milk formats for on-the-go consumption also represents a promising avenue.
Growth Accelerators in the dried milk Industry
Several factors are poised to accelerate growth in the dried milk industry. Continuous investment in research and development to create specialized dried milk powders with enhanced functional properties, such as improved heat stability and emulsification capabilities, will drive innovation and cater to evolving industrial needs. Strategic partnerships between raw milk producers, dried milk manufacturers, and end-user industries can optimize supply chains, ensure consistent quality, and foster co-creation of new products.
- Technological Breakthroughs: Advancements in drying technologies, such as freeze-drying for premium products and optimized spray-drying for energy efficiency, will improve product quality and reduce manufacturing costs.
- Strategic Partnerships: Collaborations with food technology companies to develop novel applications and with ingredient suppliers to source specialized raw materials will enhance product portfolios.
- Market Expansion Strategies: Focusing on emerging markets with increasing disposable incomes and a growing demand for dairy products will drive volume growth. Export strategies targeting regions with high consumption potential but limited local production will also be crucial.
Key Players Shaping the dried milk Market
- Danone
- Nestle
- FrieslandCampina
- Arla
- Vreugdenhil Dairy
- Alpen Dairies
- California Dairies
- DFA
- Lactalis
- Land O’Lakes
- Fonterra
- Westland
- Tatura
- Burra Foods
- MG
- Ausino
- Yili
- Mengniu
- Feihe
- Wondersun
Notable Milestones in dried milk Sector
- 2019: Fonterra launches a new range of high-protein skim milk powders targeting the sports nutrition market.
- 2020: Nestlé introduces innovative infant formula with enhanced DHA and ARA derived from dried milk, meeting growing demand for specialized infant nutrition.
- 2021: FrieslandCampina invests in advanced spray-drying technology to improve the energy efficiency and quality of its dried milk products.
- 2022: Arla Foods strengthens its position in the foodservice sector with the introduction of a new line of instant dried milk for beverage applications.
- 2023: Yili Group expands its dairy processing capacity, focusing on increased production of dried milk to meet domestic and international demand.
- 2024: Vreugdenhil Dairy announces strategic partnerships to enhance its supply chain resilience for key dried milk ingredients.
In-Depth dried milk Market Outlook
The future of the dried milk market is exceptionally promising, driven by sustained global demand for versatile, shelf-stable, and nutritious dairy ingredients. Growth accelerators, including technological innovations in processing and fortification, alongside strategic market expansion into underserved regions, will significantly bolster the industry. The increasing consumer focus on health and convenience ensures a continued demand for value-added dried milk products.
- Future Market Potential: The market is expected to see continued growth driven by the expansion of the global food and beverage industry, particularly in Asia-Pacific and Africa.
- Strategic Opportunities: Companies that focus on product differentiation through enhanced nutritional profiles, functional properties, and sustainable sourcing will be well-positioned for success. Strategic acquisitions and joint ventures will also play a key role in consolidating market share and expanding technological capabilities. The rising demand for customized ingredient solutions for confectionery, bakery, and dairy processing will create significant opportunities for innovation and market penetration.
dried milk Segmentation
-
1. Application
- 1.1. Dairy Products Processing
- 1.2. Bakery
- 1.3. Snacks
- 1.4. Others
-
2. Types
- 2.1. Skim Fat Dried Milk
- 2.2. Whole Fat Dried Milk
- 2.3. Others
dried milk Segmentation By Geography
-
1. North America
- 1.1. United States
- 1.2. Canada
- 1.3. Mexico
-
2. South America
- 2.1. Brazil
- 2.2. Argentina
- 2.3. Rest of South America
-
3. Europe
- 3.1. United Kingdom
- 3.2. Germany
- 3.3. France
- 3.4. Italy
- 3.5. Spain
- 3.6. Russia
- 3.7. Benelux
- 3.8. Nordics
- 3.9. Rest of Europe
-
4. Middle East & Africa
- 4.1. Turkey
- 4.2. Israel
- 4.3. GCC
- 4.4. North Africa
- 4.5. South Africa
- 4.6. Rest of Middle East & Africa
-
5. Asia Pacific
- 5.1. China
- 5.2. India
- 5.3. Japan
- 5.4. South Korea
- 5.5. ASEAN
- 5.6. Oceania
- 5.7. Rest of Asia Pacific
dried milk REPORT HIGHLIGHTS
| Aspects | Details |
|---|---|
| Study Period | 2019-2033 |
| Base Year | 2024 |
| Estimated Year | 2025 |
| Forecast Period | 2025-2033 |
| Historical Period | 2019-2024 |
| Growth Rate | CAGR of XX% from 2019-2033 |
| Segmentation |
|
Table of Contents
- 1. Introduction
- 1.1. Research Scope
- 1.2. Market Segmentation
- 1.3. Research Methodology
- 1.4. Definitions and Assumptions
- 2. Executive Summary
- 2.1. Introduction
- 3. Market Dynamics
- 3.1. Introduction
- 3.2. Market Drivers
- 3.3. Market Restrains
- 3.4. Market Trends
- 4. Market Factor Analysis
- 4.1. Porters Five Forces
- 4.2. Supply/Value Chain
- 4.3. PESTEL analysis
- 4.4. Market Entropy
- 4.5. Patent/Trademark Analysis
- 5. Global dried milk Analysis, Insights and Forecast, 2019-2031
- 5.1. Market Analysis, Insights and Forecast - by Application
- 5.1.1. Dairy Products Processing
- 5.1.2. Bakery
- 5.1.3. Snacks
- 5.1.4. Others
- 5.2. Market Analysis, Insights and Forecast - by Types
- 5.2.1. Skim Fat Dried Milk
- 5.2.2. Whole Fat Dried Milk
- 5.2.3. Others
- 5.3. Market Analysis, Insights and Forecast - by Region
- 5.3.1. North America
- 5.3.2. South America
- 5.3.3. Europe
- 5.3.4. Middle East & Africa
- 5.3.5. Asia Pacific
- 5.1. Market Analysis, Insights and Forecast - by Application
- 6. North America dried milk Analysis, Insights and Forecast, 2019-2031
- 6.1. Market Analysis, Insights and Forecast - by Application
- 6.1.1. Dairy Products Processing
- 6.1.2. Bakery
- 6.1.3. Snacks
- 6.1.4. Others
- 6.2. Market Analysis, Insights and Forecast - by Types
- 6.2.1. Skim Fat Dried Milk
- 6.2.2. Whole Fat Dried Milk
- 6.2.3. Others
- 6.1. Market Analysis, Insights and Forecast - by Application
- 7. South America dried milk Analysis, Insights and Forecast, 2019-2031
- 7.1. Market Analysis, Insights and Forecast - by Application
- 7.1.1. Dairy Products Processing
- 7.1.2. Bakery
- 7.1.3. Snacks
- 7.1.4. Others
- 7.2. Market Analysis, Insights and Forecast - by Types
- 7.2.1. Skim Fat Dried Milk
- 7.2.2. Whole Fat Dried Milk
- 7.2.3. Others
- 7.1. Market Analysis, Insights and Forecast - by Application
- 8. Europe dried milk Analysis, Insights and Forecast, 2019-2031
- 8.1. Market Analysis, Insights and Forecast - by Application
- 8.1.1. Dairy Products Processing
- 8.1.2. Bakery
- 8.1.3. Snacks
- 8.1.4. Others
- 8.2. Market Analysis, Insights and Forecast - by Types
- 8.2.1. Skim Fat Dried Milk
- 8.2.2. Whole Fat Dried Milk
- 8.2.3. Others
- 8.1. Market Analysis, Insights and Forecast - by Application
- 9. Middle East & Africa dried milk Analysis, Insights and Forecast, 2019-2031
- 9.1. Market Analysis, Insights and Forecast - by Application
- 9.1.1. Dairy Products Processing
- 9.1.2. Bakery
- 9.1.3. Snacks
- 9.1.4. Others
- 9.2. Market Analysis, Insights and Forecast - by Types
- 9.2.1. Skim Fat Dried Milk
- 9.2.2. Whole Fat Dried Milk
- 9.2.3. Others
- 9.1. Market Analysis, Insights and Forecast - by Application
- 10. Asia Pacific dried milk Analysis, Insights and Forecast, 2019-2031
- 10.1. Market Analysis, Insights and Forecast - by Application
- 10.1.1. Dairy Products Processing
- 10.1.2. Bakery
- 10.1.3. Snacks
- 10.1.4. Others
- 10.2. Market Analysis, Insights and Forecast - by Types
- 10.2.1. Skim Fat Dried Milk
- 10.2.2. Whole Fat Dried Milk
- 10.2.3. Others
- 10.1. Market Analysis, Insights and Forecast - by Application
- 11. Competitive Analysis
- 11.1. Global Market Share Analysis 2024
- 11.2. Company Profiles
- 11.2.1 Danone
- 11.2.1.1. Overview
- 11.2.1.2. Products
- 11.2.1.3. SWOT Analysis
- 11.2.1.4. Recent Developments
- 11.2.1.5. Financials (Based on Availability)
- 11.2.2 Nestle
- 11.2.2.1. Overview
- 11.2.2.2. Products
- 11.2.2.3. SWOT Analysis
- 11.2.2.4. Recent Developments
- 11.2.2.5. Financials (Based on Availability)
- 11.2.3 FrieslandCampina
- 11.2.3.1. Overview
- 11.2.3.2. Products
- 11.2.3.3. SWOT Analysis
- 11.2.3.4. Recent Developments
- 11.2.3.5. Financials (Based on Availability)
- 11.2.4 Arla
- 11.2.4.1. Overview
- 11.2.4.2. Products
- 11.2.4.3. SWOT Analysis
- 11.2.4.4. Recent Developments
- 11.2.4.5. Financials (Based on Availability)
- 11.2.5 Vreugdenhil Dairy
- 11.2.5.1. Overview
- 11.2.5.2. Products
- 11.2.5.3. SWOT Analysis
- 11.2.5.4. Recent Developments
- 11.2.5.5. Financials (Based on Availability)
- 11.2.6 Alpen Dairies
- 11.2.6.1. Overview
- 11.2.6.2. Products
- 11.2.6.3. SWOT Analysis
- 11.2.6.4. Recent Developments
- 11.2.6.5. Financials (Based on Availability)
- 11.2.7 California Dairies
- 11.2.7.1. Overview
- 11.2.7.2. Products
- 11.2.7.3. SWOT Analysis
- 11.2.7.4. Recent Developments
- 11.2.7.5. Financials (Based on Availability)
- 11.2.8 DFA
- 11.2.8.1. Overview
- 11.2.8.2. Products
- 11.2.8.3. SWOT Analysis
- 11.2.8.4. Recent Developments
- 11.2.8.5. Financials (Based on Availability)
- 11.2.9 Lactalis
- 11.2.9.1. Overview
- 11.2.9.2. Products
- 11.2.9.3. SWOT Analysis
- 11.2.9.4. Recent Developments
- 11.2.9.5. Financials (Based on Availability)
- 11.2.10 Land O’Lakes
- 11.2.10.1. Overview
- 11.2.10.2. Products
- 11.2.10.3. SWOT Analysis
- 11.2.10.4. Recent Developments
- 11.2.10.5. Financials (Based on Availability)
- 11.2.11 Fonterra
- 11.2.11.1. Overview
- 11.2.11.2. Products
- 11.2.11.3. SWOT Analysis
- 11.2.11.4. Recent Developments
- 11.2.11.5. Financials (Based on Availability)
- 11.2.12 Westland
- 11.2.12.1. Overview
- 11.2.12.2. Products
- 11.2.12.3. SWOT Analysis
- 11.2.12.4. Recent Developments
- 11.2.12.5. Financials (Based on Availability)
- 11.2.13 Tatura
- 11.2.13.1. Overview
- 11.2.13.2. Products
- 11.2.13.3. SWOT Analysis
- 11.2.13.4. Recent Developments
- 11.2.13.5. Financials (Based on Availability)
- 11.2.14 Burra Foods
- 11.2.14.1. Overview
- 11.2.14.2. Products
- 11.2.14.3. SWOT Analysis
- 11.2.14.4. Recent Developments
- 11.2.14.5. Financials (Based on Availability)
- 11.2.15 MG
- 11.2.15.1. Overview
- 11.2.15.2. Products
- 11.2.15.3. SWOT Analysis
- 11.2.15.4. Recent Developments
- 11.2.15.5. Financials (Based on Availability)
- 11.2.16 Ausino
- 11.2.16.1. Overview
- 11.2.16.2. Products
- 11.2.16.3. SWOT Analysis
- 11.2.16.4. Recent Developments
- 11.2.16.5. Financials (Based on Availability)
- 11.2.17 Yili
- 11.2.17.1. Overview
- 11.2.17.2. Products
- 11.2.17.3. SWOT Analysis
- 11.2.17.4. Recent Developments
- 11.2.17.5. Financials (Based on Availability)
- 11.2.18 Mengniu
- 11.2.18.1. Overview
- 11.2.18.2. Products
- 11.2.18.3. SWOT Analysis
- 11.2.18.4. Recent Developments
- 11.2.18.5. Financials (Based on Availability)
- 11.2.19 Feihe
- 11.2.19.1. Overview
- 11.2.19.2. Products
- 11.2.19.3. SWOT Analysis
- 11.2.19.4. Recent Developments
- 11.2.19.5. Financials (Based on Availability)
- 11.2.20 Wondersun
- 11.2.20.1. Overview
- 11.2.20.2. Products
- 11.2.20.3. SWOT Analysis
- 11.2.20.4. Recent Developments
- 11.2.20.5. Financials (Based on Availability)
- 11.2.1 Danone
List of Figures
- Figure 1: Global dried milk Revenue Breakdown (million, %) by Region 2024 & 2032
- Figure 2: Global dried milk Volume Breakdown (K, %) by Region 2024 & 2032
- Figure 3: North America dried milk Revenue (million), by Application 2024 & 2032
- Figure 4: North America dried milk Volume (K), by Application 2024 & 2032
- Figure 5: North America dried milk Revenue Share (%), by Application 2024 & 2032
- Figure 6: North America dried milk Volume Share (%), by Application 2024 & 2032
- Figure 7: North America dried milk Revenue (million), by Types 2024 & 2032
- Figure 8: North America dried milk Volume (K), by Types 2024 & 2032
- Figure 9: North America dried milk Revenue Share (%), by Types 2024 & 2032
- Figure 10: North America dried milk Volume Share (%), by Types 2024 & 2032
- Figure 11: North America dried milk Revenue (million), by Country 2024 & 2032
- Figure 12: North America dried milk Volume (K), by Country 2024 & 2032
- Figure 13: North America dried milk Revenue Share (%), by Country 2024 & 2032
- Figure 14: North America dried milk Volume Share (%), by Country 2024 & 2032
- Figure 15: South America dried milk Revenue (million), by Application 2024 & 2032
- Figure 16: South America dried milk Volume (K), by Application 2024 & 2032
- Figure 17: South America dried milk Revenue Share (%), by Application 2024 & 2032
- Figure 18: South America dried milk Volume Share (%), by Application 2024 & 2032
- Figure 19: South America dried milk Revenue (million), by Types 2024 & 2032
- Figure 20: South America dried milk Volume (K), by Types 2024 & 2032
- Figure 21: South America dried milk Revenue Share (%), by Types 2024 & 2032
- Figure 22: South America dried milk Volume Share (%), by Types 2024 & 2032
- Figure 23: South America dried milk Revenue (million), by Country 2024 & 2032
- Figure 24: South America dried milk Volume (K), by Country 2024 & 2032
- Figure 25: South America dried milk Revenue Share (%), by Country 2024 & 2032
- Figure 26: South America dried milk Volume Share (%), by Country 2024 & 2032
- Figure 27: Europe dried milk Revenue (million), by Application 2024 & 2032
- Figure 28: Europe dried milk Volume (K), by Application 2024 & 2032
- Figure 29: Europe dried milk Revenue Share (%), by Application 2024 & 2032
- Figure 30: Europe dried milk Volume Share (%), by Application 2024 & 2032
- Figure 31: Europe dried milk Revenue (million), by Types 2024 & 2032
- Figure 32: Europe dried milk Volume (K), by Types 2024 & 2032
- Figure 33: Europe dried milk Revenue Share (%), by Types 2024 & 2032
- Figure 34: Europe dried milk Volume Share (%), by Types 2024 & 2032
- Figure 35: Europe dried milk Revenue (million), by Country 2024 & 2032
- Figure 36: Europe dried milk Volume (K), by Country 2024 & 2032
- Figure 37: Europe dried milk Revenue Share (%), by Country 2024 & 2032
- Figure 38: Europe dried milk Volume Share (%), by Country 2024 & 2032
- Figure 39: Middle East & Africa dried milk Revenue (million), by Application 2024 & 2032
- Figure 40: Middle East & Africa dried milk Volume (K), by Application 2024 & 2032
- Figure 41: Middle East & Africa dried milk Revenue Share (%), by Application 2024 & 2032
- Figure 42: Middle East & Africa dried milk Volume Share (%), by Application 2024 & 2032
- Figure 43: Middle East & Africa dried milk Revenue (million), by Types 2024 & 2032
- Figure 44: Middle East & Africa dried milk Volume (K), by Types 2024 & 2032
- Figure 45: Middle East & Africa dried milk Revenue Share (%), by Types 2024 & 2032
- Figure 46: Middle East & Africa dried milk Volume Share (%), by Types 2024 & 2032
- Figure 47: Middle East & Africa dried milk Revenue (million), by Country 2024 & 2032
- Figure 48: Middle East & Africa dried milk Volume (K), by Country 2024 & 2032
- Figure 49: Middle East & Africa dried milk Revenue Share (%), by Country 2024 & 2032
- Figure 50: Middle East & Africa dried milk Volume Share (%), by Country 2024 & 2032
- Figure 51: Asia Pacific dried milk Revenue (million), by Application 2024 & 2032
- Figure 52: Asia Pacific dried milk Volume (K), by Application 2024 & 2032
- Figure 53: Asia Pacific dried milk Revenue Share (%), by Application 2024 & 2032
- Figure 54: Asia Pacific dried milk Volume Share (%), by Application 2024 & 2032
- Figure 55: Asia Pacific dried milk Revenue (million), by Types 2024 & 2032
- Figure 56: Asia Pacific dried milk Volume (K), by Types 2024 & 2032
- Figure 57: Asia Pacific dried milk Revenue Share (%), by Types 2024 & 2032
- Figure 58: Asia Pacific dried milk Volume Share (%), by Types 2024 & 2032
- Figure 59: Asia Pacific dried milk Revenue (million), by Country 2024 & 2032
- Figure 60: Asia Pacific dried milk Volume (K), by Country 2024 & 2032
- Figure 61: Asia Pacific dried milk Revenue Share (%), by Country 2024 & 2032
- Figure 62: Asia Pacific dried milk Volume Share (%), by Country 2024 & 2032
List of Tables
- Table 1: Global dried milk Revenue million Forecast, by Region 2019 & 2032
- Table 2: Global dried milk Volume K Forecast, by Region 2019 & 2032
- Table 3: Global dried milk Revenue million Forecast, by Application 2019 & 2032
- Table 4: Global dried milk Volume K Forecast, by Application 2019 & 2032
- Table 5: Global dried milk Revenue million Forecast, by Types 2019 & 2032
- Table 6: Global dried milk Volume K Forecast, by Types 2019 & 2032
- Table 7: Global dried milk Revenue million Forecast, by Region 2019 & 2032
- Table 8: Global dried milk Volume K Forecast, by Region 2019 & 2032
- Table 9: Global dried milk Revenue million Forecast, by Application 2019 & 2032
- Table 10: Global dried milk Volume K Forecast, by Application 2019 & 2032
- Table 11: Global dried milk Revenue million Forecast, by Types 2019 & 2032
- Table 12: Global dried milk Volume K Forecast, by Types 2019 & 2032
- Table 13: Global dried milk Revenue million Forecast, by Country 2019 & 2032
- Table 14: Global dried milk Volume K Forecast, by Country 2019 & 2032
- Table 15: United States dried milk Revenue (million) Forecast, by Application 2019 & 2032
- Table 16: United States dried milk Volume (K) Forecast, by Application 2019 & 2032
- Table 17: Canada dried milk Revenue (million) Forecast, by Application 2019 & 2032
- Table 18: Canada dried milk Volume (K) Forecast, by Application 2019 & 2032
- Table 19: Mexico dried milk Revenue (million) Forecast, by Application 2019 & 2032
- Table 20: Mexico dried milk Volume (K) Forecast, by Application 2019 & 2032
- Table 21: Global dried milk Revenue million Forecast, by Application 2019 & 2032
- Table 22: Global dried milk Volume K Forecast, by Application 2019 & 2032
- Table 23: Global dried milk Revenue million Forecast, by Types 2019 & 2032
- Table 24: Global dried milk Volume K Forecast, by Types 2019 & 2032
- Table 25: Global dried milk Revenue million Forecast, by Country 2019 & 2032
- Table 26: Global dried milk Volume K Forecast, by Country 2019 & 2032
- Table 27: Brazil dried milk Revenue (million) Forecast, by Application 2019 & 2032
- Table 28: Brazil dried milk Volume (K) Forecast, by Application 2019 & 2032
- Table 29: Argentina dried milk Revenue (million) Forecast, by Application 2019 & 2032
- Table 30: Argentina dried milk Volume (K) Forecast, by Application 2019 & 2032
- Table 31: Rest of South America dried milk Revenue (million) Forecast, by Application 2019 & 2032
- Table 32: Rest of South America dried milk Volume (K) Forecast, by Application 2019 & 2032
- Table 33: Global dried milk Revenue million Forecast, by Application 2019 & 2032
- Table 34: Global dried milk Volume K Forecast, by Application 2019 & 2032
- Table 35: Global dried milk Revenue million Forecast, by Types 2019 & 2032
- Table 36: Global dried milk Volume K Forecast, by Types 2019 & 2032
- Table 37: Global dried milk Revenue million Forecast, by Country 2019 & 2032
- Table 38: Global dried milk Volume K Forecast, by Country 2019 & 2032
- Table 39: United Kingdom dried milk Revenue (million) Forecast, by Application 2019 & 2032
- Table 40: United Kingdom dried milk Volume (K) Forecast, by Application 2019 & 2032
- Table 41: Germany dried milk Revenue (million) Forecast, by Application 2019 & 2032
- Table 42: Germany dried milk Volume (K) Forecast, by Application 2019 & 2032
- Table 43: France dried milk Revenue (million) Forecast, by Application 2019 & 2032
- Table 44: France dried milk Volume (K) Forecast, by Application 2019 & 2032
- Table 45: Italy dried milk Revenue (million) Forecast, by Application 2019 & 2032
- Table 46: Italy dried milk Volume (K) Forecast, by Application 2019 & 2032
- Table 47: Spain dried milk Revenue (million) Forecast, by Application 2019 & 2032
- Table 48: Spain dried milk Volume (K) Forecast, by Application 2019 & 2032
- Table 49: Russia dried milk Revenue (million) Forecast, by Application 2019 & 2032
- Table 50: Russia dried milk Volume (K) Forecast, by Application 2019 & 2032
- Table 51: Benelux dried milk Revenue (million) Forecast, by Application 2019 & 2032
- Table 52: Benelux dried milk Volume (K) Forecast, by Application 2019 & 2032
- Table 53: Nordics dried milk Revenue (million) Forecast, by Application 2019 & 2032
- Table 54: Nordics dried milk Volume (K) Forecast, by Application 2019 & 2032
- Table 55: Rest of Europe dried milk Revenue (million) Forecast, by Application 2019 & 2032
- Table 56: Rest of Europe dried milk Volume (K) Forecast, by Application 2019 & 2032
- Table 57: Global dried milk Revenue million Forecast, by Application 2019 & 2032
- Table 58: Global dried milk Volume K Forecast, by Application 2019 & 2032
- Table 59: Global dried milk Revenue million Forecast, by Types 2019 & 2032
- Table 60: Global dried milk Volume K Forecast, by Types 2019 & 2032
- Table 61: Global dried milk Revenue million Forecast, by Country 2019 & 2032
- Table 62: Global dried milk Volume K Forecast, by Country 2019 & 2032
- Table 63: Turkey dried milk Revenue (million) Forecast, by Application 2019 & 2032
- Table 64: Turkey dried milk Volume (K) Forecast, by Application 2019 & 2032
- Table 65: Israel dried milk Revenue (million) Forecast, by Application 2019 & 2032
- Table 66: Israel dried milk Volume (K) Forecast, by Application 2019 & 2032
- Table 67: GCC dried milk Revenue (million) Forecast, by Application 2019 & 2032
- Table 68: GCC dried milk Volume (K) Forecast, by Application 2019 & 2032
- Table 69: North Africa dried milk Revenue (million) Forecast, by Application 2019 & 2032
- Table 70: North Africa dried milk Volume (K) Forecast, by Application 2019 & 2032
- Table 71: South Africa dried milk Revenue (million) Forecast, by Application 2019 & 2032
- Table 72: South Africa dried milk Volume (K) Forecast, by Application 2019 & 2032
- Table 73: Rest of Middle East & Africa dried milk Revenue (million) Forecast, by Application 2019 & 2032
- Table 74: Rest of Middle East & Africa dried milk Volume (K) Forecast, by Application 2019 & 2032
- Table 75: Global dried milk Revenue million Forecast, by Application 2019 & 2032
- Table 76: Global dried milk Volume K Forecast, by Application 2019 & 2032
- Table 77: Global dried milk Revenue million Forecast, by Types 2019 & 2032
- Table 78: Global dried milk Volume K Forecast, by Types 2019 & 2032
- Table 79: Global dried milk Revenue million Forecast, by Country 2019 & 2032
- Table 80: Global dried milk Volume K Forecast, by Country 2019 & 2032
- Table 81: China dried milk Revenue (million) Forecast, by Application 2019 & 2032
- Table 82: China dried milk Volume (K) Forecast, by Application 2019 & 2032
- Table 83: India dried milk Revenue (million) Forecast, by Application 2019 & 2032
- Table 84: India dried milk Volume (K) Forecast, by Application 2019 & 2032
- Table 85: Japan dried milk Revenue (million) Forecast, by Application 2019 & 2032
- Table 86: Japan dried milk Volume (K) Forecast, by Application 2019 & 2032
- Table 87: South Korea dried milk Revenue (million) Forecast, by Application 2019 & 2032
- Table 88: South Korea dried milk Volume (K) Forecast, by Application 2019 & 2032
- Table 89: ASEAN dried milk Revenue (million) Forecast, by Application 2019 & 2032
- Table 90: ASEAN dried milk Volume (K) Forecast, by Application 2019 & 2032
- Table 91: Oceania dried milk Revenue (million) Forecast, by Application 2019 & 2032
- Table 92: Oceania dried milk Volume (K) Forecast, by Application 2019 & 2032
- Table 93: Rest of Asia Pacific dried milk Revenue (million) Forecast, by Application 2019 & 2032
- Table 94: Rest of Asia Pacific dried milk Volume (K) Forecast, by Application 2019 & 2032
Frequently Asked Questions
1. What is the projected Compound Annual Growth Rate (CAGR) of the dried milk?
The projected CAGR is approximately XX%.
2. Which companies are prominent players in the dried milk?
Key companies in the market include Danone, Nestle, FrieslandCampina, Arla, Vreugdenhil Dairy, Alpen Dairies, California Dairies, DFA, Lactalis, Land O’Lakes, Fonterra, Westland, Tatura, Burra Foods, MG, Ausino, Yili, Mengniu, Feihe, Wondersun.
3. What are the main segments of the dried milk?
The market segments include Application, Types.
4. Can you provide details about the market size?
The market size is estimated to be USD XXX million as of 2022.
5. What are some drivers contributing to market growth?
N/A
6. What are the notable trends driving market growth?
N/A
7. Are there any restraints impacting market growth?
N/A
8. Can you provide examples of recent developments in the market?
N/A
9. What pricing options are available for accessing the report?
Pricing options include single-user, multi-user, and enterprise licenses priced at USD 4350.00, USD 6525.00, and USD 8700.00 respectively.
10. Is the market size provided in terms of value or volume?
The market size is provided in terms of value, measured in million and volume, measured in K.
11. Are there any specific market keywords associated with the report?
Yes, the market keyword associated with the report is "dried milk," which aids in identifying and referencing the specific market segment covered.
12. How do I determine which pricing option suits my needs best?
The pricing options vary based on user requirements and access needs. Individual users may opt for single-user licenses, while businesses requiring broader access may choose multi-user or enterprise licenses for cost-effective access to the report.
13. Are there any additional resources or data provided in the dried milk report?
While the report offers comprehensive insights, it's advisable to review the specific contents or supplementary materials provided to ascertain if additional resources or data are available.
14. How can I stay updated on further developments or reports in the dried milk?
To stay informed about further developments, trends, and reports in the dried milk, consider subscribing to industry newsletters, following relevant companies and organizations, or regularly checking reputable industry news sources and publications.
Methodology
Step 1 - Identification of Relevant Samples Size from Population Database


Step 2 - Approaches for Defining Global Market Size (Value, Volume* & Price*)

Note*: In applicable scenarios
Step 3 - Data Sources
Primary Research
- Web Analytics
- Survey Reports
- Research Institute
- Latest Research Reports
- Opinion Leaders
Secondary Research
- Annual Reports
- White Paper
- Latest Press Release
- Industry Association
- Paid Database
- Investor Presentations

Step 4 - Data Triangulation
Involves using different sources of information in order to increase the validity of a study
These sources are likely to be stakeholders in a program - participants, other researchers, program staff, other community members, and so on.
Then we put all data in single framework & apply various statistical tools to find out the dynamic on the market.
During the analysis stage, feedback from the stakeholder groups would be compared to determine areas of agreement as well as areas of divergence
