

Key Insights
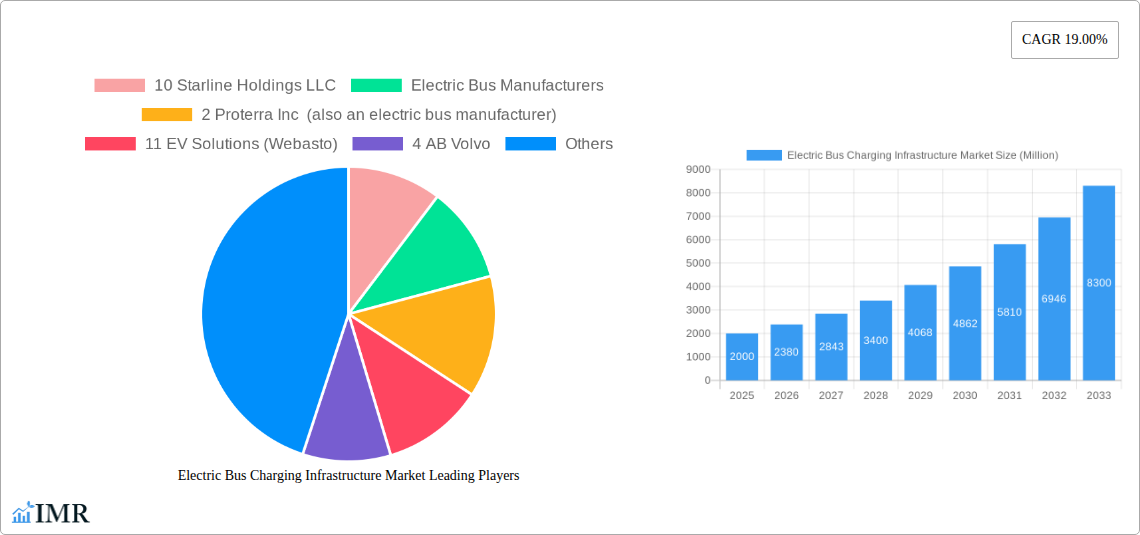
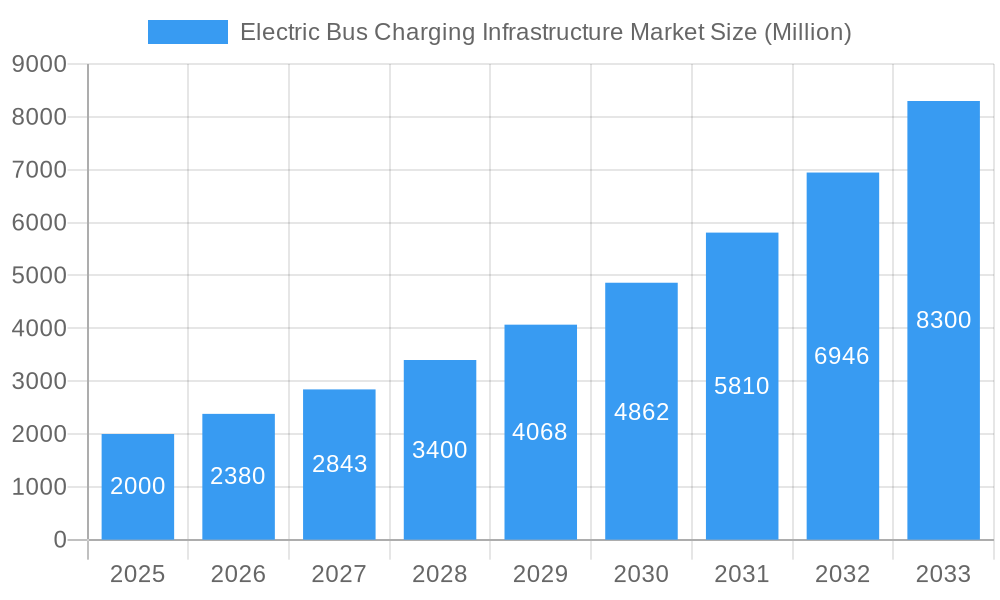
The Electric Bus Charging Infrastructure market is experiencing robust growth, driven by the global shift towards sustainable transportation and the increasing adoption of electric buses in urban and intercity transit systems. The market, valued at approximately $2 billion in 2025, is projected to exhibit a Compound Annual Growth Rate (CAGR) of 19% from 2025 to 2033. This growth is fueled by several key factors. Government initiatives promoting electric vehicle adoption, including subsidies and tax incentives, are significantly boosting market expansion. Furthermore, advancements in battery technology, leading to increased range and reduced charging times, are making electric buses a more viable and attractive alternative to traditional diesel buses. The rising concerns regarding air pollution and greenhouse gas emissions in urban areas are also pushing municipalities and transit authorities to invest heavily in electric bus fleets and their supporting infrastructure. The market segmentation reveals a strong preference for plug-in charging solutions, although overhead charging is gaining traction, particularly in depot settings where efficient mass charging is critical. Key players such as ChargePoint, ABB, and Siemens are actively investing in research and development, driving innovation in charging technology and expanding their market presence. Competition is intense, with established players facing challenges from emerging startups offering innovative charging solutions and business models. Geographic variations in market growth are expected, with North America and Europe leading the charge initially, followed by rapid expansion in the Asia-Pacific region, driven by strong government support and increasing urbanization in countries like China and India.
Electric Bus Charging Infrastructure Market Market Size (In Billion)
The market’s growth trajectory is, however, subject to certain restraints. The high initial investment costs associated with installing charging infrastructure remain a significant barrier, particularly for smaller transit authorities with limited budgets. Furthermore, the lack of standardized charging protocols and interoperability challenges can hinder widespread adoption and create integration complexities. Addressing these challenges through collaborative initiatives, standardization efforts, and innovative financing models will be crucial for accelerating market growth and unlocking the full potential of this burgeoning sector. The forecast period of 2025-2033 offers significant opportunities for companies involved in manufacturing, supplying, and operating electric bus charging infrastructure. Strategic partnerships, technological advancements, and effective market penetration strategies will determine the success of players in this dynamic and rapidly evolving market.
Electric Bus Charging Infrastructure Market Company Market Share
Electric Bus Charging Infrastructure Market: A Comprehensive Report (2019-2033)
This in-depth report provides a comprehensive analysis of the Electric Bus Charging Infrastructure Market, encompassing market dynamics, growth trends, regional dominance, product landscape, key players, and future opportunities. The report covers the parent market of Electric Vehicle Charging Infrastructure and the child market of Electric Bus Charging Infrastructure, offering a granular view of this rapidly evolving sector. The study period spans 2019-2033, with 2025 as the base and estimated year. The forecast period is 2025-2033, and the historical period covers 2019-2024. The market size is presented in million units.
Electric Bus Charging Infrastructure Market Dynamics & Structure
The Electric Bus Charging Infrastructure market is characterized by moderate concentration, with several key players vying for market share. Technological innovation, particularly in wireless charging and high-power charging solutions, is a significant driver. Stringent government regulations promoting electric mobility and emission reduction targets are also shaping the market landscape. Competitive substitutes include traditional diesel buses, but their market dominance is declining due to environmental concerns and economic incentives for electric adoption. The end-user demographic primarily includes public transportation authorities, school districts, and private fleet operators. Mergers and acquisitions (M&A) activity is prevalent, with larger players strategically acquiring smaller companies to expand their product portfolios and geographic reach.
- Market Concentration: Moderate, with no single dominant player controlling a significant majority. Top 5 players hold approximately xx% of the market share in 2025.
- Technological Innovation: Focus on faster charging speeds, improved efficiency, and wireless charging technologies are key innovation drivers.
- Regulatory Framework: Government subsidies, emission standards, and mandates for electric fleets are boosting market growth.
- Competitive Substitutes: Traditional diesel buses and other internal combustion engine vehicles.
- End-User Demographics: Public transportation authorities (xx%), school districts (xx%), and private fleet operators (xx%).
- M&A Activity: xx major M&A deals occurred between 2019-2024, indicating a consolidating market.
Electric Bus Charging Infrastructure Market Growth Trends & Insights
The Electric Bus Charging Infrastructure market is experiencing robust growth, driven by increasing electric bus adoption globally. The market size is projected to reach xx million units by 2033, exhibiting a CAGR of xx% during the forecast period. Adoption rates are particularly high in regions with supportive government policies and well-developed public transportation networks. Technological disruptions, such as advancements in battery technology and charging infrastructure, are further accelerating market expansion. Consumer behavior shifts towards environmentally friendly transportation options are also contributing to this growth trajectory.
Dominant Regions, Countries, or Segments in Electric Bus Charging Infrastructure Market
The [insert leading region, e.g., North America/Europe/Asia-Pacific] region is currently leading the Electric Bus Charging Infrastructure market, driven by high electric bus adoption rates and significant investments in charging infrastructure development. Within this region, [insert leading country] shows particularly strong growth.
Charging Type:
- Plug-in Charging: This segment holds the largest market share (xx%) due to its established technology, lower initial investment, and widespread availability.
- Overhead Charging: This segment is growing rapidly (xx% CAGR), driven by its efficiency in depot charging for large fleets.
Key Drivers:
- Government Policies and Incentives: Substantial subsidies and tax benefits are stimulating adoption.
- Growing Environmental Concerns: Emphasis on reducing carbon emissions is pushing the transition to electric buses.
- Improved Battery Technology: Longer ranges and faster charging times are making electric buses more viable.
Electric Bus Charging Infrastructure Market Product Landscape
The market offers a diverse range of charging solutions, from AC and DC fast chargers to wireless charging systems. Innovations focus on increasing charging speeds, improving energy efficiency, and enhancing grid integration capabilities. Key features include intelligent charging management systems, remote monitoring capabilities, and robust safety mechanisms. The unique selling propositions (USPs) often include scalability, reliability, and ease of installation.
Key Drivers, Barriers & Challenges in Electric Bus Charging Infrastructure Market
Key Drivers:
- Government regulations: Stringent emission norms and incentives for electric bus adoption.
- Technological advancements: Faster charging technologies and improved battery life.
- Environmental concerns: Growing awareness of air pollution and climate change.
Key Challenges:
- High initial investment costs: Installing charging infrastructure requires significant upfront capital expenditure.
- Grid infrastructure limitations: Upgrading existing power grids to handle increased electricity demand.
- Interoperability issues: Ensuring seamless compatibility between different charging technologies.
Emerging Opportunities in Electric Bus Charging Infrastructure Market
- Wireless charging: This technology offers greater convenience and reduced maintenance.
- Vehicle-to-Grid (V2G) technology: Electric buses can feed electricity back into the grid during off-peak hours.
- Smart charging management systems: Optimize energy consumption and grid stability.
Growth Accelerators in the Electric Bus Charging Infrastructure Market Industry
The long-term growth of the Electric Bus Charging Infrastructure market will be propelled by continued technological breakthroughs in charging technologies, strategic partnerships between charging infrastructure providers and electric bus manufacturers, and the expansion of electric bus fleets in both developed and developing economies. Government initiatives, including substantial investments in public transportation infrastructure, will further accelerate this growth trajectory.
Key Players Shaping the Electric Bus Charging Infrastructure Market Market
- 10 Starline Holdings LLC
- 2 Proterra Inc
- 11 EV Solutions (Webasto)
- 4 AB Volvo
- 3 ChargePoint Inc
- 1 BYD Auto Co Ltd
- 1 ABB Ltd
- 8 Heliox Energy
- 6 ALSTOM
- 5 Zhengzhou Yutong Bus Co Ltd
- 7 SemaConnect Inc
- 2 Mercedes-Benz AG
- 3 Traton SE
- 4 Siemens AG
- 7 NFI Group Inc
- 5 Schneider Electric SE
- 6 IVECO S p A
- 9 Vital EV Solutions
- Electric Charging Infrastructure Suppliers
Notable Milestones in Electric Bus Charging Infrastructure Market Sector
- November 2022: ABB E-Mobility secured USD 214 million in pre-IPO funding, bolstering its growth strategy.
- September 2022: ABB E-Mobility launched a new manufacturing facility in South Carolina, creating over 100 jobs and increasing production capacity.
- August 2022: Siemens and MAHLE Group partnered to develop advanced wireless charging systems for electric vehicles.
In-Depth Electric Bus Charging Infrastructure Market Outlook
The future of the Electric Bus Charging Infrastructure market appears bright, with significant growth potential driven by the global shift towards sustainable transportation and the increasing adoption of electric buses. Strategic collaborations, technological advancements, and supportive government policies are expected to fuel this expansion. Companies focusing on innovation, efficient solutions, and international market penetration will be best positioned to capitalize on this burgeoning opportunity.
Electric Bus Charging Infrastructure Market Segmentation
-
1. Charging Type
- 1.1. Plug-in Charging
- 1.2. Overhead Charging
Electric Bus Charging Infrastructure Market Segmentation By Geography
-
1. North America
- 1.1. United States
- 1.2. Canada
- 1.3. Rest of North America
-
2. Europe
- 2.1. Germany
- 2.2. United Kingdom
- 2.3. France
- 2.4. Italy
- 2.5. Spain
- 2.6. Rest of Europe
-
3. Asia Pacific
- 3.1. China
- 3.2. India
- 3.3. Japan
- 3.4. South Korea
- 3.5. Rest of Asia Pacific
-
4. Rest of the World
- 4.1. South America
- 4.2. Middle East and Africa

Electric Bus Charging Infrastructure Market Regional Market Share
Geographic Coverage of Electric Bus Charging Infrastructure Market
Electric Bus Charging Infrastructure Market REPORT HIGHLIGHTS
| Aspects | Details |
|---|---|
| Study Period | 2020-2034 |
| Base Year | 2025 |
| Estimated Year | 2026 |
| Forecast Period | 2026-2034 |
| Historical Period | 2020-2025 |
| Growth Rate | CAGR of 19.00% from 2020-2034 |
| Segmentation |
|
Table of Contents
- 1. Introduction
- 1.1. Research Scope
- 1.2. Market Segmentation
- 1.3. Research Objective
- 1.4. Definitions and Assumptions
- 2. Executive Summary
- 2.1. Market Snapshot
- 3. Market Dynamics
- 3.1. Market Drivers
- 3.2. Market Restrains
- 3.3. Market Trends
- 3.4. Market Opportunities
- 4. Market Factor Analysis
- 4.1. Porters Five Forces
- 4.1.1. Bargaining Power of Suppliers
- 4.1.2. Bargaining Power of Buyers
- 4.1.3. Threat of New Entrants
- 4.1.4. Threat of Substitutes
- 4.1.5. Competitive Rivalry
- 4.2. PESTEL analysis
- 4.3. BCG Analysis
- 4.3.1. Stars (High Growth, High Market Share)
- 4.3.2. Cash Cows (Low Growth, High Market Share)
- 4.3.3. Question Mark (High Growth, Low Market Share)
- 4.3.4. Dogs (Low Growth, Low Market Share)
- 4.4. Ansoff Matrix Analysis
- 4.5. Supply Chain Analysis
- 4.6. Regulatory Landscape
- 4.7. Current Market Potential and Opportunity Assessment (TAM–SAM–SOM Framework)
- 4.8. IMR Analyst Note
- 4.1. Porters Five Forces
- 5. Market Analysis, Insights and Forecast 2021-2033
- 5.1. Market Analysis, Insights and Forecast - by Charging Type
- 5.1.1. Plug-in Charging
- 5.1.2. Overhead Charging
- 5.2. Market Analysis, Insights and Forecast - by Region
- 5.2.1. North America
- 5.2.2. Europe
- 5.2.3. Asia Pacific
- 5.2.4. Rest of the World
- 5.1. Market Analysis, Insights and Forecast - by Charging Type
- 6. Global Electric Bus Charging Infrastructure Market Analysis, Insights and Forecast, 2021-2033
- 6.1. Market Analysis, Insights and Forecast - by Charging Type
- 6.1.1. Plug-in Charging
- 6.1.2. Overhead Charging
- 6.1. Market Analysis, Insights and Forecast - by Charging Type
- 7. North America Electric Bus Charging Infrastructure Market Analysis, Insights and Forecast, 2020-2032
- 7.1. Market Analysis, Insights and Forecast - by Charging Type
- 7.1.1. Plug-in Charging
- 7.1.2. Overhead Charging
- 7.1. Market Analysis, Insights and Forecast - by Charging Type
- 8. Europe Electric Bus Charging Infrastructure Market Analysis, Insights and Forecast, 2020-2032
- 8.1. Market Analysis, Insights and Forecast - by Charging Type
- 8.1.1. Plug-in Charging
- 8.1.2. Overhead Charging
- 8.1. Market Analysis, Insights and Forecast - by Charging Type
- 9. Asia Pacific Electric Bus Charging Infrastructure Market Analysis, Insights and Forecast, 2020-2032
- 9.1. Market Analysis, Insights and Forecast - by Charging Type
- 9.1.1. Plug-in Charging
- 9.1.2. Overhead Charging
- 9.1. Market Analysis, Insights and Forecast - by Charging Type
- 10. Rest of the World Electric Bus Charging Infrastructure Market Analysis, Insights and Forecast, 2020-2032
- 10.1. Market Analysis, Insights and Forecast - by Charging Type
- 10.1.1. Plug-in Charging
- 10.1.2. Overhead Charging
- 10.1. Market Analysis, Insights and Forecast - by Charging Type
- 11. Competitive Analysis
- 11.1. Company Profiles
- 11.1.1 10 Starline Holdings LLC
- 11.1.1.1. Company Overview
- 11.1.1.2. Products
- 11.1.1.3. Company Financials
- 11.1.1.4. SWOT Analysis
- 11.1.2 Electric Bus Manufacturers
- 11.1.2.1. Company Overview
- 11.1.2.2. Products
- 11.1.2.3. Company Financials
- 11.1.2.4. SWOT Analysis
- 11.1.3 2 Proterra Inc (also an electric bus manufacturer)
- 11.1.3.1. Company Overview
- 11.1.3.2. Products
- 11.1.3.3. Company Financials
- 11.1.3.4. SWOT Analysis
- 11.1.4 11 EV Solutions (Webasto)
- 11.1.4.1. Company Overview
- 11.1.4.2. Products
- 11.1.4.3. Company Financials
- 11.1.4.4. SWOT Analysis
- 11.1.5 4 AB Volvo
- 11.1.5.1. Company Overview
- 11.1.5.2. Products
- 11.1.5.3. Company Financials
- 11.1.5.4. SWOT Analysis
- 11.1.6 3 ChargePoint Inc
- 11.1.6.1. Company Overview
- 11.1.6.2. Products
- 11.1.6.3. Company Financials
- 11.1.6.4. SWOT Analysis
- 11.1.7 1 BYD Auto Co Ltd
- 11.1.7.1. Company Overview
- 11.1.7.2. Products
- 11.1.7.3. Company Financials
- 11.1.7.4. SWOT Analysis
- 11.1.8 1 ABB Ltd
- 11.1.8.1. Company Overview
- 11.1.8.2. Products
- 11.1.8.3. Company Financials
- 11.1.8.4. SWOT Analysis
- 11.1.9 8 Heliox Energy
- 11.1.9.1. Company Overview
- 11.1.9.2. Products
- 11.1.9.3. Company Financials
- 11.1.9.4. SWOT Analysis
- 11.1.10 6 ALSTOM
- 11.1.10.1. Company Overview
- 11.1.10.2. Products
- 11.1.10.3. Company Financials
- 11.1.10.4. SWOT Analysis
- 11.1.11 5 Zhengzhou Yutong Bus Co Ltd
- 11.1.11.1. Company Overview
- 11.1.11.2. Products
- 11.1.11.3. Company Financials
- 11.1.11.4. SWOT Analysis
- 11.1.12 7 SemaConnect Inc
- 11.1.12.1. Company Overview
- 11.1.12.2. Products
- 11.1.12.3. Company Financials
- 11.1.12.4. SWOT Analysis
- 11.1.13 2 Mercedes-Benz AG
- 11.1.13.1. Company Overview
- 11.1.13.2. Products
- 11.1.13.3. Company Financials
- 11.1.13.4. SWOT Analysis
- 11.1.14 3 Traton SE
- 11.1.14.1. Company Overview
- 11.1.14.2. Products
- 11.1.14.3. Company Financials
- 11.1.14.4. SWOT Analysis
- 11.1.15 4 Siemens AG
- 11.1.15.1. Company Overview
- 11.1.15.2. Products
- 11.1.15.3. Company Financials
- 11.1.15.4. SWOT Analysis
- 11.1.16 7 NFI Group Inc
- 11.1.16.1. Company Overview
- 11.1.16.2. Products
- 11.1.16.3. Company Financials
- 11.1.16.4. SWOT Analysis
- 11.1.17 5 Schneider Electric SE
- 11.1.17.1. Company Overview
- 11.1.17.2. Products
- 11.1.17.3. Company Financials
- 11.1.17.4. SWOT Analysis
- 11.1.18 6 IVECO S p A
- 11.1.18.1. Company Overview
- 11.1.18.2. Products
- 11.1.18.3. Company Financials
- 11.1.18.4. SWOT Analysis
- 11.1.19 9 Vital EV Solutions
- 11.1.19.1. Company Overview
- 11.1.19.2. Products
- 11.1.19.3. Company Financials
- 11.1.19.4. SWOT Analysis
- 11.1.20 Electric Charging Infrastructure Suppliers
- 11.1.20.1. Company Overview
- 11.1.20.2. Products
- 11.1.20.3. Company Financials
- 11.1.20.4. SWOT Analysis
- 11.1.1 10 Starline Holdings LLC
- 11.2. Market Entropy
- 11.2.1 Company's Key Areas Served
- 11.2.2 Recent Developments
- 11.3. Company Market Share Analysis 2025
- 11.3.1 Top 5 Companies Market Share Analysis
- 11.3.2 Top 3 Companies Market Share Analysis
- 11.4. List of Potential Customers
- 12. Research Methodology
List of Figures
- Figure 1: Global Electric Bus Charging Infrastructure Market Revenue Breakdown (Million, %) by Region 2025 & 2033
- Figure 2: North America Electric Bus Charging Infrastructure Market Revenue (Million), by Charging Type 2025 & 2033
- Figure 3: North America Electric Bus Charging Infrastructure Market Revenue Share (%), by Charging Type 2025 & 2033
- Figure 4: North America Electric Bus Charging Infrastructure Market Revenue (Million), by Country 2025 & 2033
- Figure 5: North America Electric Bus Charging Infrastructure Market Revenue Share (%), by Country 2025 & 2033
- Figure 6: Europe Electric Bus Charging Infrastructure Market Revenue (Million), by Charging Type 2025 & 2033
- Figure 7: Europe Electric Bus Charging Infrastructure Market Revenue Share (%), by Charging Type 2025 & 2033
- Figure 8: Europe Electric Bus Charging Infrastructure Market Revenue (Million), by Country 2025 & 2033
- Figure 9: Europe Electric Bus Charging Infrastructure Market Revenue Share (%), by Country 2025 & 2033
- Figure 10: Asia Pacific Electric Bus Charging Infrastructure Market Revenue (Million), by Charging Type 2025 & 2033
- Figure 11: Asia Pacific Electric Bus Charging Infrastructure Market Revenue Share (%), by Charging Type 2025 & 2033
- Figure 12: Asia Pacific Electric Bus Charging Infrastructure Market Revenue (Million), by Country 2025 & 2033
- Figure 13: Asia Pacific Electric Bus Charging Infrastructure Market Revenue Share (%), by Country 2025 & 2033
- Figure 14: Rest of the World Electric Bus Charging Infrastructure Market Revenue (Million), by Charging Type 2025 & 2033
- Figure 15: Rest of the World Electric Bus Charging Infrastructure Market Revenue Share (%), by Charging Type 2025 & 2033
- Figure 16: Rest of the World Electric Bus Charging Infrastructure Market Revenue (Million), by Country 2025 & 2033
- Figure 17: Rest of the World Electric Bus Charging Infrastructure Market Revenue Share (%), by Country 2025 & 2033
List of Tables
- Table 1: Global Electric Bus Charging Infrastructure Market Revenue Million Forecast, by Charging Type 2020 & 2033
- Table 2: Global Electric Bus Charging Infrastructure Market Revenue Million Forecast, by Region 2020 & 2033
- Table 3: Global Electric Bus Charging Infrastructure Market Revenue Million Forecast, by Charging Type 2020 & 2033
- Table 4: Global Electric Bus Charging Infrastructure Market Revenue Million Forecast, by Country 2020 & 2033
- Table 5: United States Electric Bus Charging Infrastructure Market Revenue (Million) Forecast, by Application 2020 & 2033
- Table 6: Canada Electric Bus Charging Infrastructure Market Revenue (Million) Forecast, by Application 2020 & 2033
- Table 7: Rest of North America Electric Bus Charging Infrastructure Market Revenue (Million) Forecast, by Application 2020 & 2033
- Table 8: Global Electric Bus Charging Infrastructure Market Revenue Million Forecast, by Charging Type 2020 & 2033
- Table 9: Global Electric Bus Charging Infrastructure Market Revenue Million Forecast, by Country 2020 & 2033
- Table 10: Germany Electric Bus Charging Infrastructure Market Revenue (Million) Forecast, by Application 2020 & 2033
- Table 11: United Kingdom Electric Bus Charging Infrastructure Market Revenue (Million) Forecast, by Application 2020 & 2033
- Table 12: France Electric Bus Charging Infrastructure Market Revenue (Million) Forecast, by Application 2020 & 2033
- Table 13: Italy Electric Bus Charging Infrastructure Market Revenue (Million) Forecast, by Application 2020 & 2033
- Table 14: Spain Electric Bus Charging Infrastructure Market Revenue (Million) Forecast, by Application 2020 & 2033
- Table 15: Rest of Europe Electric Bus Charging Infrastructure Market Revenue (Million) Forecast, by Application 2020 & 2033
- Table 16: Global Electric Bus Charging Infrastructure Market Revenue Million Forecast, by Charging Type 2020 & 2033
- Table 17: Global Electric Bus Charging Infrastructure Market Revenue Million Forecast, by Country 2020 & 2033
- Table 18: China Electric Bus Charging Infrastructure Market Revenue (Million) Forecast, by Application 2020 & 2033
- Table 19: India Electric Bus Charging Infrastructure Market Revenue (Million) Forecast, by Application 2020 & 2033
- Table 20: Japan Electric Bus Charging Infrastructure Market Revenue (Million) Forecast, by Application 2020 & 2033
- Table 21: South Korea Electric Bus Charging Infrastructure Market Revenue (Million) Forecast, by Application 2020 & 2033
- Table 22: Rest of Asia Pacific Electric Bus Charging Infrastructure Market Revenue (Million) Forecast, by Application 2020 & 2033
- Table 23: Global Electric Bus Charging Infrastructure Market Revenue Million Forecast, by Charging Type 2020 & 2033
- Table 24: Global Electric Bus Charging Infrastructure Market Revenue Million Forecast, by Country 2020 & 2033
- Table 25: South America Electric Bus Charging Infrastructure Market Revenue (Million) Forecast, by Application 2020 & 2033
- Table 26: Middle East and Africa Electric Bus Charging Infrastructure Market Revenue (Million) Forecast, by Application 2020 & 2033
Frequently Asked Questions
1. What is the projected Compound Annual Growth Rate (CAGR) of the Electric Bus Charging Infrastructure Market?
The projected CAGR is approximately 19.00%.
2. Which companies are prominent players in the Electric Bus Charging Infrastructure Market?
Key companies in the market include 10 Starline Holdings LLC, Electric Bus Manufacturers, 2 Proterra Inc (also an electric bus manufacturer), 11 EV Solutions (Webasto), 4 AB Volvo, 3 ChargePoint Inc, 1 BYD Auto Co Ltd, 1 ABB Ltd, 8 Heliox Energy, 6 ALSTOM, 5 Zhengzhou Yutong Bus Co Ltd, 7 SemaConnect Inc, 2 Mercedes-Benz AG, 3 Traton SE, 4 Siemens AG, 7 NFI Group Inc, 5 Schneider Electric SE, 6 IVECO S p A, 9 Vital EV Solutions, Electric Charging Infrastructure Suppliers.
3. What are the main segments of the Electric Bus Charging Infrastructure Market?
The market segments include Charging Type.
4. Can you provide details about the market size?
The market size is estimated to be USD 2 Million as of 2022.
5. What are some drivers contributing to market growth?
Rising Adoption of Electric Buses.
6. What are the notable trends driving market growth?
Governmental Efforts to Increase in the Number of Electric Buses Will Boost Overhead Charging Type.
7. Are there any restraints impacting market growth?
High Upfront Investment.
8. Can you provide examples of recent developments in the market?
November 2022: ABB E-Mobility, the electric vehicle charging solutions subsidiary of ABB Ltd., successfully raised CHF 200 million (USD 214 million) in a pre-IPO private placement led by a group of minority investors. The capital infusion will play a crucial role in supporting the company's growth strategy, which includes pursuing both organic and inorganic opportunities, such as potential mergers and acquisitions. The transaction is expected to be finalized in the fourth quarter of 2022.
9. What pricing options are available for accessing the report?
Pricing options include single-user, multi-user, and enterprise licenses priced at USD 4750, USD 5250, and USD 8750 respectively.
10. Is the market size provided in terms of value or volume?
The market size is provided in terms of value, measured in Million.
11. Are there any specific market keywords associated with the report?
Yes, the market keyword associated with the report is "Electric Bus Charging Infrastructure Market," which aids in identifying and referencing the specific market segment covered.
12. How do I determine which pricing option suits my needs best?
The pricing options vary based on user requirements and access needs. Individual users may opt for single-user licenses, while businesses requiring broader access may choose multi-user or enterprise licenses for cost-effective access to the report.
13. Are there any additional resources or data provided in the Electric Bus Charging Infrastructure Market report?
While the report offers comprehensive insights, it's advisable to review the specific contents or supplementary materials provided to ascertain if additional resources or data are available.
14. How can I stay updated on further developments or reports in the Electric Bus Charging Infrastructure Market?
To stay informed about further developments, trends, and reports in the Electric Bus Charging Infrastructure Market, consider subscribing to industry newsletters, following relevant companies and organizations, or regularly checking reputable industry news sources and publications.
Methodology
Step 1 - Identification of Relevant Samples Size from Population Database


Step 2 - Approaches for Defining Global Market Size (Value, Volume* & Price*)

Note*: In applicable scenarios
Step 3 - Data Sources
Primary Research
- Web Analytics
- Survey Reports
- Research Institute
- Latest Research Reports
- Opinion Leaders
Secondary Research
- Annual Reports
- White Paper
- Latest Press Release
- Industry Association
- Paid Database
- Investor Presentations

Step 4 - Data Triangulation
Involves using different sources of information in order to increase the validity of a study
These sources are likely to be stakeholders in a program - participants, other researchers, program staff, other community members, and so on.
Then we put all data in single framework & apply various statistical tools to find out the dynamic on the market.
During the analysis stage, feedback from the stakeholder groups would be compared to determine areas of agreement as well as areas of divergence