

Key Insights
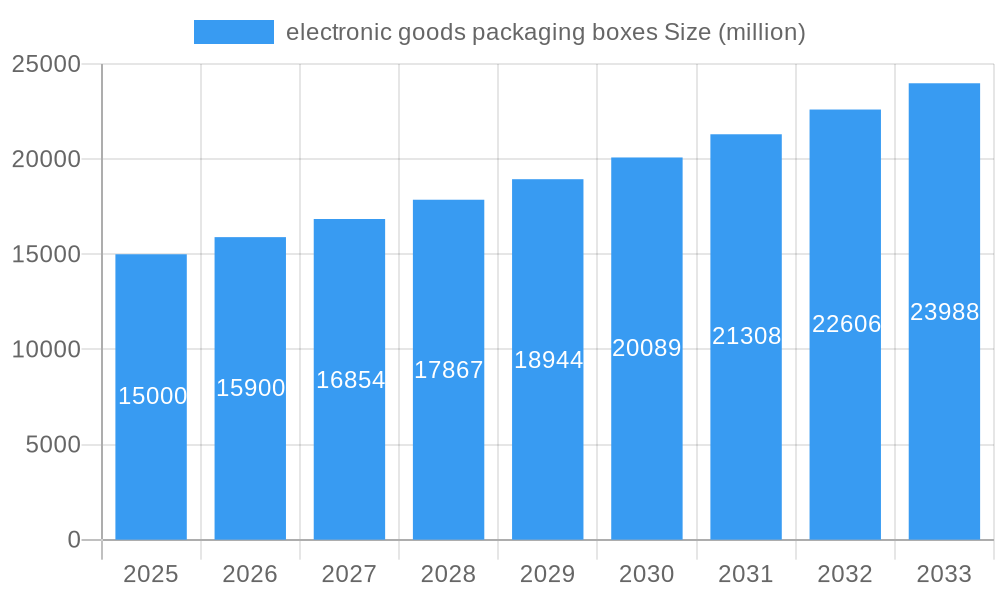
The global market for electronic goods packaging boxes is experiencing robust growth, driven by the booming electronics industry and the increasing demand for e-commerce. The market's expansion is fueled by several factors, including the rising popularity of smartphones, laptops, tablets, and other consumer electronics. Consumers increasingly prioritize safe and sustainable packaging, creating demand for innovative materials and designs that minimize environmental impact. Furthermore, the growth of e-commerce necessitates robust and efficient packaging solutions capable of withstanding the rigors of shipping and handling. This has led to significant investment in automated packaging systems and advanced materials, enhancing both protection and efficiency. We estimate the current market size (2025) to be around $15 billion, projected to achieve a compound annual growth rate (CAGR) of 6% during the forecast period (2025-2033). This growth trajectory is supported by continued technological advancements and the expansion of the global electronics market into emerging economies.
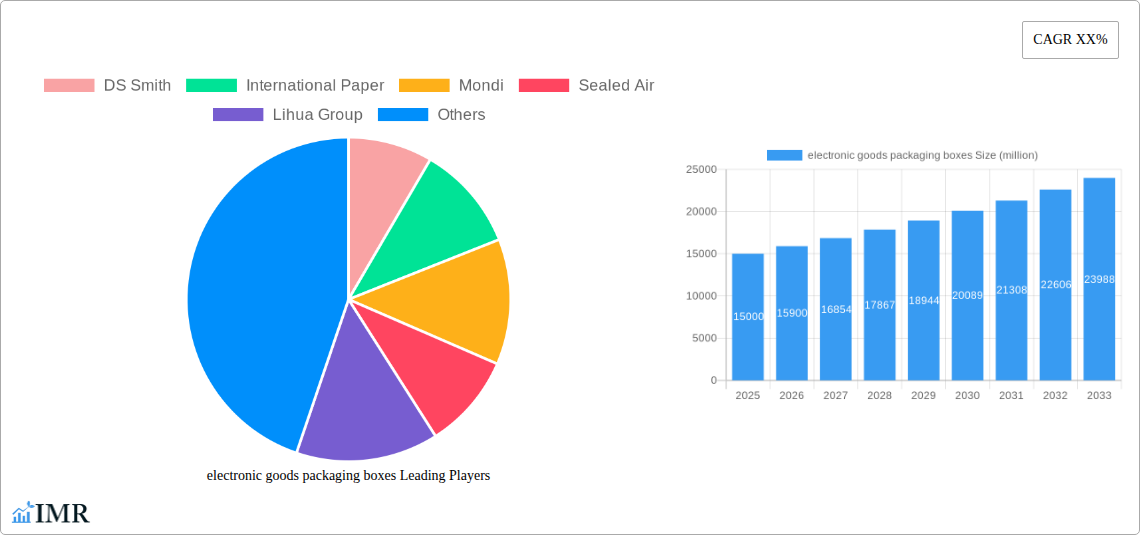
electronic goods packaging boxes Market Size (In Billion)
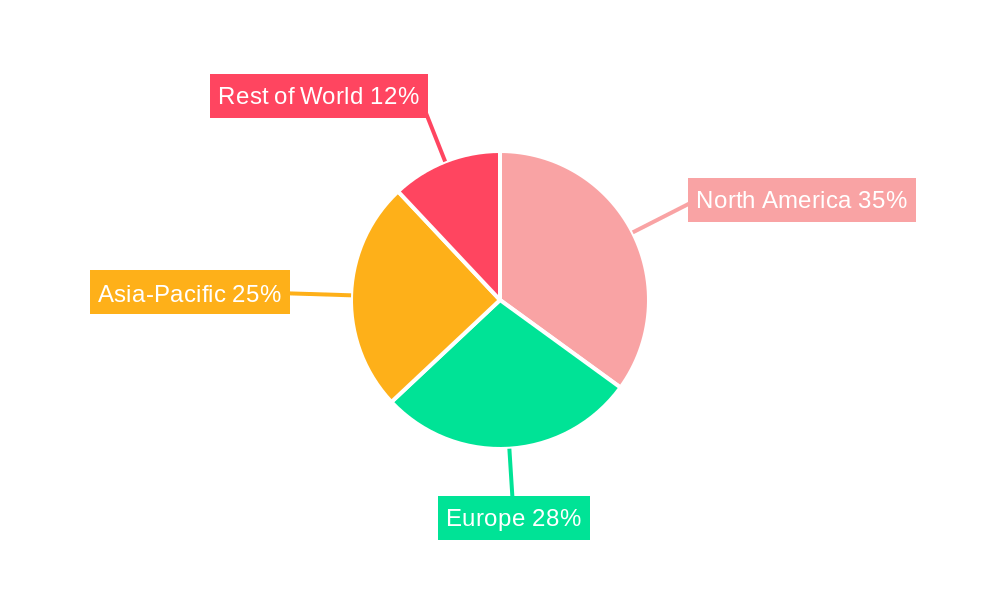
Key players like DS Smith, International Paper, and Smurfit Kappa are strategically positioned to capitalize on this growth through innovation in material science, design optimization, and sustainable packaging solutions. However, fluctuating raw material prices and stringent environmental regulations present challenges. The market is segmented by material type (corrugated cardboard, paperboard, foam, etc.), packaging type (boxes, trays, inserts), and end-use (smartphones, laptops, TVs, etc.). Regional variations exist, with North America and Asia-Pacific exhibiting significant market share due to high electronics production and consumption. The forecast suggests continued expansion, driven by rising consumer electronics sales, a focus on eco-friendly practices, and advancements in packaging technology. This creates exciting opportunities for companies to develop innovative and sustainable solutions that meet the evolving needs of the electronics industry and consumers alike.
electronic goods packaging boxes Company Market Share
Electronic Goods Packaging Boxes Market Report: 2019-2033
This comprehensive report provides a detailed analysis of the global electronic goods packaging boxes market, offering invaluable insights for industry professionals, investors, and strategic decision-makers. The study covers the period from 2019 to 2033, with a focus on the 2025-2033 forecast period. The report meticulously examines market dynamics, growth trends, regional dominance, product landscapes, and key players shaping this dynamic sector. With a focus on the parent market of packaging and the child market of electronic goods packaging, this report delivers actionable intelligence to navigate the evolving landscape.
Electronic Goods Packaging Boxes Market Dynamics & Structure
The global electronic goods packaging boxes market is characterized by a moderately concentrated landscape, with key players such as DS Smith, International Paper, and Smurfit Kappa holding significant market share. The market size in 2025 is estimated at xx million units. Technological innovation, particularly in sustainable materials and automated packaging solutions, is a major driver. Stringent regulatory frameworks concerning environmental protection and product safety are shaping industry practices. The market faces competition from alternative packaging solutions, including reusable containers and protective films. E-commerce growth significantly fuels demand, while M&A activity continues to reshape the competitive landscape. Over the historical period (2019-2024), approximately xx M&A deals were recorded.
- Market Concentration: Moderately concentrated, with top 5 players holding approximately xx% market share in 2025.
- Technological Innovation: Focus on sustainable materials (e.g., recycled cardboard, biodegradable plastics) and automation for increased efficiency.
- Regulatory Framework: Growing emphasis on eco-friendly packaging and reduced waste impacting material selection and design.
- Competitive Substitutes: Reusable containers, protective films, and alternative packaging materials pose competitive challenges.
- End-User Demographics: Primarily driven by consumer electronics, computing devices, and telecommunications industries.
- M&A Trends: Consolidation through mergers and acquisitions continues, aiming for economies of scale and expanded market reach.
Electronic Goods Packaging Boxes Growth Trends & Insights
The global electronic goods packaging boxes market experienced robust growth during the historical period (2019-2024). Driven by the burgeoning e-commerce sector and increasing demand for consumer electronics, the market size expanded at a CAGR of xx% and is projected to reach xx million units by 2033, exhibiting a CAGR of xx% during the forecast period (2025-2033). Market penetration is increasing across emerging economies, fueled by rising disposable incomes and technological advancements. Technological disruptions, such as the adoption of smart packaging and improved barrier materials, are enhancing product protection and traceability. Consumer preferences for sustainable and ethically sourced packaging are further shaping market trends.
(Note: The XXX mentioned in the prompt instructions is unclear and has not been utilized.)
Dominant Regions, Countries, or Segments in Electronic Goods Packaging Boxes
North America and Asia-Pacific currently dominate the electronic goods packaging boxes market, driven by robust demand from the consumer electronics and e-commerce sectors. China and the US hold the largest market share, benefiting from strong manufacturing hubs and advanced logistics networks.
- North America: High consumer spending on electronics and robust e-commerce growth are key drivers.
- Asia-Pacific: Rapid technological advancement, growing middle class, and expanding e-commerce penetration fuel market expansion.
- Europe: Stringent environmental regulations and focus on sustainability are impacting material choices and packaging design.
Electronic Goods Packaging Boxes Product Landscape
The electronic goods packaging boxes market offers a diverse range of products catering to different electronic device types and shipping requirements. Innovations include customized packaging solutions for fragile items, enhanced barrier properties to protect against moisture and shock, and the integration of smart sensors for real-time tracking and condition monitoring. Unique selling propositions often include superior protection, enhanced sustainability, and cost-effectiveness. Advancements in materials science and packaging automation are driving efficiency and reducing environmental impact.
Key Drivers, Barriers & Challenges in Electronic Goods Packaging Boxes
Key Drivers: E-commerce expansion, rising consumer electronics demand, advancements in packaging technology (e.g., automated packaging lines and sustainable materials), and government regulations promoting sustainable packaging practices.
Key Challenges: Fluctuations in raw material prices, stringent environmental regulations, increasing transportation costs, intense competition, and supply chain disruptions affecting material availability and timely delivery. These disruptions have caused approximately a xx% increase in production costs in some regions.
Emerging Opportunities in Electronic Goods Packaging Boxes
Untapped markets in developing economies, growing demand for personalized and customized packaging, and the rising adoption of sustainable and eco-friendly packaging solutions present significant opportunities. The integration of smart packaging technologies offers potential for enhancing product traceability and improving supply chain efficiency. Focus on reusable and recyclable packaging solutions will further shape future market trends.
Growth Accelerators in the Electronic Goods Packaging Boxes Industry
Technological advancements in materials science, automation, and sustainable packaging solutions are driving long-term growth. Strategic partnerships between packaging companies and electronic goods manufacturers are enhancing product design and streamlining supply chains. Market expansion into developing economies with rising consumer demand for electronic goods provides further growth potential.
Key Players Shaping the Electronic Goods Packaging Boxes Market
- DS Smith
- International Paper
- Mondi
- Sealed Air
- Lihua Group
- Smurfit Kappa
- Dunapack Packaging
- Georgia Pacific
- Graham Packaging
- Pregis
- Sonoco
- Stora Enso
- Unisource Worldwide
- Universal Protective Packaging
- WestRock
Notable Milestones in Electronic Goods Packaging Boxes Sector
- 2020: Introduction of biodegradable packaging solutions by several major players.
- 2021: Increased focus on sustainable sourcing and reduced carbon footprint across the industry.
- 2022: Several significant mergers and acquisitions reshaping the competitive landscape.
- 2023: Launch of advanced smart packaging solutions integrating RFID technology.
- 2024: Growing adoption of automated packaging lines for increased efficiency and reduced labor costs.
In-Depth Electronic Goods Packaging Boxes Market Outlook
The future of the electronic goods packaging boxes market looks promising, driven by continued growth in the e-commerce sector, technological advancements, and increasing focus on sustainability. Strategic partnerships, innovative product development, and expansion into emerging markets will be crucial for long-term success. The market is poised for considerable expansion, with significant opportunities for both established players and new entrants to capitalize on evolving consumer preferences and technological advancements.
electronic goods packaging boxes Segmentation
-
1. Application
- 1.1. Online Retail
- 1.2. Offline Retail
-
2. Types
- 2.1. Paper
- 2.2. Wooden
- 2.3. Polypropylene
- 2.4. Kraft Paper
- 2.5. Others
electronic goods packaging boxes Segmentation By Geography
-
1. North America
- 1.1. United States
- 1.2. Canada
- 1.3. Mexico
-
2. South America
- 2.1. Brazil
- 2.2. Argentina
- 2.3. Rest of South America
-
3. Europe
- 3.1. United Kingdom
- 3.2. Germany
- 3.3. France
- 3.4. Italy
- 3.5. Spain
- 3.6. Russia
- 3.7. Benelux
- 3.8. Nordics
- 3.9. Rest of Europe
-
4. Middle East & Africa
- 4.1. Turkey
- 4.2. Israel
- 4.3. GCC
- 4.4. North Africa
- 4.5. South Africa
- 4.6. Rest of Middle East & Africa
-
5. Asia Pacific
- 5.1. China
- 5.2. India
- 5.3. Japan
- 5.4. South Korea
- 5.5. ASEAN
- 5.6. Oceania
- 5.7. Rest of Asia Pacific
electronic goods packaging boxes Regional Market Share
Geographic Coverage of electronic goods packaging boxes
electronic goods packaging boxes REPORT HIGHLIGHTS
| Aspects | Details |
|---|---|
| Study Period | 2020-2034 |
| Base Year | 2025 |
| Estimated Year | 2026 |
| Forecast Period | 2026-2034 |
| Historical Period | 2020-2025 |
| Growth Rate | CAGR of 13% from 2020-2034 |
| Segmentation |
|
Table of Contents
- 1. Introduction
- 1.1. Research Scope
- 1.2. Market Segmentation
- 1.3. Research Methodology
- 1.4. Definitions and Assumptions
- 2. Executive Summary
- 2.1. Introduction
- 3. Market Dynamics
- 3.1. Introduction
- 3.2. Market Drivers
- 3.3. Market Restrains
- 3.4. Market Trends
- 4. Market Factor Analysis
- 4.1. Porters Five Forces
- 4.2. Supply/Value Chain
- 4.3. PESTEL analysis
- 4.4. Market Entropy
- 4.5. Patent/Trademark Analysis
- 5. Global electronic goods packaging boxes Analysis, Insights and Forecast, 2020-2032
- 5.1. Market Analysis, Insights and Forecast - by Application
- 5.1.1. Online Retail
- 5.1.2. Offline Retail
- 5.2. Market Analysis, Insights and Forecast - by Types
- 5.2.1. Paper
- 5.2.2. Wooden
- 5.2.3. Polypropylene
- 5.2.4. Kraft Paper
- 5.2.5. Others
- 5.3. Market Analysis, Insights and Forecast - by Region
- 5.3.1. North America
- 5.3.2. South America
- 5.3.3. Europe
- 5.3.4. Middle East & Africa
- 5.3.5. Asia Pacific
- 5.1. Market Analysis, Insights and Forecast - by Application
- 6. North America electronic goods packaging boxes Analysis, Insights and Forecast, 2020-2032
- 6.1. Market Analysis, Insights and Forecast - by Application
- 6.1.1. Online Retail
- 6.1.2. Offline Retail
- 6.2. Market Analysis, Insights and Forecast - by Types
- 6.2.1. Paper
- 6.2.2. Wooden
- 6.2.3. Polypropylene
- 6.2.4. Kraft Paper
- 6.2.5. Others
- 6.1. Market Analysis, Insights and Forecast - by Application
- 7. South America electronic goods packaging boxes Analysis, Insights and Forecast, 2020-2032
- 7.1. Market Analysis, Insights and Forecast - by Application
- 7.1.1. Online Retail
- 7.1.2. Offline Retail
- 7.2. Market Analysis, Insights and Forecast - by Types
- 7.2.1. Paper
- 7.2.2. Wooden
- 7.2.3. Polypropylene
- 7.2.4. Kraft Paper
- 7.2.5. Others
- 7.1. Market Analysis, Insights and Forecast - by Application
- 8. Europe electronic goods packaging boxes Analysis, Insights and Forecast, 2020-2032
- 8.1. Market Analysis, Insights and Forecast - by Application
- 8.1.1. Online Retail
- 8.1.2. Offline Retail
- 8.2. Market Analysis, Insights and Forecast - by Types
- 8.2.1. Paper
- 8.2.2. Wooden
- 8.2.3. Polypropylene
- 8.2.4. Kraft Paper
- 8.2.5. Others
- 8.1. Market Analysis, Insights and Forecast - by Application
- 9. Middle East & Africa electronic goods packaging boxes Analysis, Insights and Forecast, 2020-2032
- 9.1. Market Analysis, Insights and Forecast - by Application
- 9.1.1. Online Retail
- 9.1.2. Offline Retail
- 9.2. Market Analysis, Insights and Forecast - by Types
- 9.2.1. Paper
- 9.2.2. Wooden
- 9.2.3. Polypropylene
- 9.2.4. Kraft Paper
- 9.2.5. Others
- 9.1. Market Analysis, Insights and Forecast - by Application
- 10. Asia Pacific electronic goods packaging boxes Analysis, Insights and Forecast, 2020-2032
- 10.1. Market Analysis, Insights and Forecast - by Application
- 10.1.1. Online Retail
- 10.1.2. Offline Retail
- 10.2. Market Analysis, Insights and Forecast - by Types
- 10.2.1. Paper
- 10.2.2. Wooden
- 10.2.3. Polypropylene
- 10.2.4. Kraft Paper
- 10.2.5. Others
- 10.1. Market Analysis, Insights and Forecast - by Application
- 11. Competitive Analysis
- 11.1. Global Market Share Analysis 2025
- 11.2. Company Profiles
- 11.2.1 DS Smith
- 11.2.1.1. Overview
- 11.2.1.2. Products
- 11.2.1.3. SWOT Analysis
- 11.2.1.4. Recent Developments
- 11.2.1.5. Financials (Based on Availability)
- 11.2.2 International Paper
- 11.2.2.1. Overview
- 11.2.2.2. Products
- 11.2.2.3. SWOT Analysis
- 11.2.2.4. Recent Developments
- 11.2.2.5. Financials (Based on Availability)
- 11.2.3 Mondi
- 11.2.3.1. Overview
- 11.2.3.2. Products
- 11.2.3.3. SWOT Analysis
- 11.2.3.4. Recent Developments
- 11.2.3.5. Financials (Based on Availability)
- 11.2.4 Sealed Air
- 11.2.4.1. Overview
- 11.2.4.2. Products
- 11.2.4.3. SWOT Analysis
- 11.2.4.4. Recent Developments
- 11.2.4.5. Financials (Based on Availability)
- 11.2.5 Lihua Group
- 11.2.5.1. Overview
- 11.2.5.2. Products
- 11.2.5.3. SWOT Analysis
- 11.2.5.4. Recent Developments
- 11.2.5.5. Financials (Based on Availability)
- 11.2.6 Smurfit Kappa
- 11.2.6.1. Overview
- 11.2.6.2. Products
- 11.2.6.3. SWOT Analysis
- 11.2.6.4. Recent Developments
- 11.2.6.5. Financials (Based on Availability)
- 11.2.7 Dunapack Packaging
- 11.2.7.1. Overview
- 11.2.7.2. Products
- 11.2.7.3. SWOT Analysis
- 11.2.7.4. Recent Developments
- 11.2.7.5. Financials (Based on Availability)
- 11.2.8 Georgia Pacific
- 11.2.8.1. Overview
- 11.2.8.2. Products
- 11.2.8.3. SWOT Analysis
- 11.2.8.4. Recent Developments
- 11.2.8.5. Financials (Based on Availability)
- 11.2.9 Graham Packaging
- 11.2.9.1. Overview
- 11.2.9.2. Products
- 11.2.9.3. SWOT Analysis
- 11.2.9.4. Recent Developments
- 11.2.9.5. Financials (Based on Availability)
- 11.2.10 Pregis
- 11.2.10.1. Overview
- 11.2.10.2. Products
- 11.2.10.3. SWOT Analysis
- 11.2.10.4. Recent Developments
- 11.2.10.5. Financials (Based on Availability)
- 11.2.11 Sonoco
- 11.2.11.1. Overview
- 11.2.11.2. Products
- 11.2.11.3. SWOT Analysis
- 11.2.11.4. Recent Developments
- 11.2.11.5. Financials (Based on Availability)
- 11.2.12 Stora Enso
- 11.2.12.1. Overview
- 11.2.12.2. Products
- 11.2.12.3. SWOT Analysis
- 11.2.12.4. Recent Developments
- 11.2.12.5. Financials (Based on Availability)
- 11.2.13 Unisource Worldwide
- 11.2.13.1. Overview
- 11.2.13.2. Products
- 11.2.13.3. SWOT Analysis
- 11.2.13.4. Recent Developments
- 11.2.13.5. Financials (Based on Availability)
- 11.2.14 Universal Protective Packaging
- 11.2.14.1. Overview
- 11.2.14.2. Products
- 11.2.14.3. SWOT Analysis
- 11.2.14.4. Recent Developments
- 11.2.14.5. Financials (Based on Availability)
- 11.2.15 WestRock
- 11.2.15.1. Overview
- 11.2.15.2. Products
- 11.2.15.3. SWOT Analysis
- 11.2.15.4. Recent Developments
- 11.2.15.5. Financials (Based on Availability)
- 11.2.1 DS Smith
List of Figures
- Figure 1: Global electronic goods packaging boxes Revenue Breakdown (undefined, %) by Region 2025 & 2033
- Figure 2: Global electronic goods packaging boxes Volume Breakdown (K, %) by Region 2025 & 2033
- Figure 3: North America electronic goods packaging boxes Revenue (undefined), by Application 2025 & 2033
- Figure 4: North America electronic goods packaging boxes Volume (K), by Application 2025 & 2033
- Figure 5: North America electronic goods packaging boxes Revenue Share (%), by Application 2025 & 2033
- Figure 6: North America electronic goods packaging boxes Volume Share (%), by Application 2025 & 2033
- Figure 7: North America electronic goods packaging boxes Revenue (undefined), by Types 2025 & 2033
- Figure 8: North America electronic goods packaging boxes Volume (K), by Types 2025 & 2033
- Figure 9: North America electronic goods packaging boxes Revenue Share (%), by Types 2025 & 2033
- Figure 10: North America electronic goods packaging boxes Volume Share (%), by Types 2025 & 2033
- Figure 11: North America electronic goods packaging boxes Revenue (undefined), by Country 2025 & 2033
- Figure 12: North America electronic goods packaging boxes Volume (K), by Country 2025 & 2033
- Figure 13: North America electronic goods packaging boxes Revenue Share (%), by Country 2025 & 2033
- Figure 14: North America electronic goods packaging boxes Volume Share (%), by Country 2025 & 2033
- Figure 15: South America electronic goods packaging boxes Revenue (undefined), by Application 2025 & 2033
- Figure 16: South America electronic goods packaging boxes Volume (K), by Application 2025 & 2033
- Figure 17: South America electronic goods packaging boxes Revenue Share (%), by Application 2025 & 2033
- Figure 18: South America electronic goods packaging boxes Volume Share (%), by Application 2025 & 2033
- Figure 19: South America electronic goods packaging boxes Revenue (undefined), by Types 2025 & 2033
- Figure 20: South America electronic goods packaging boxes Volume (K), by Types 2025 & 2033
- Figure 21: South America electronic goods packaging boxes Revenue Share (%), by Types 2025 & 2033
- Figure 22: South America electronic goods packaging boxes Volume Share (%), by Types 2025 & 2033
- Figure 23: South America electronic goods packaging boxes Revenue (undefined), by Country 2025 & 2033
- Figure 24: South America electronic goods packaging boxes Volume (K), by Country 2025 & 2033
- Figure 25: South America electronic goods packaging boxes Revenue Share (%), by Country 2025 & 2033
- Figure 26: South America electronic goods packaging boxes Volume Share (%), by Country 2025 & 2033
- Figure 27: Europe electronic goods packaging boxes Revenue (undefined), by Application 2025 & 2033
- Figure 28: Europe electronic goods packaging boxes Volume (K), by Application 2025 & 2033
- Figure 29: Europe electronic goods packaging boxes Revenue Share (%), by Application 2025 & 2033
- Figure 30: Europe electronic goods packaging boxes Volume Share (%), by Application 2025 & 2033
- Figure 31: Europe electronic goods packaging boxes Revenue (undefined), by Types 2025 & 2033
- Figure 32: Europe electronic goods packaging boxes Volume (K), by Types 2025 & 2033
- Figure 33: Europe electronic goods packaging boxes Revenue Share (%), by Types 2025 & 2033
- Figure 34: Europe electronic goods packaging boxes Volume Share (%), by Types 2025 & 2033
- Figure 35: Europe electronic goods packaging boxes Revenue (undefined), by Country 2025 & 2033
- Figure 36: Europe electronic goods packaging boxes Volume (K), by Country 2025 & 2033
- Figure 37: Europe electronic goods packaging boxes Revenue Share (%), by Country 2025 & 2033
- Figure 38: Europe electronic goods packaging boxes Volume Share (%), by Country 2025 & 2033
- Figure 39: Middle East & Africa electronic goods packaging boxes Revenue (undefined), by Application 2025 & 2033
- Figure 40: Middle East & Africa electronic goods packaging boxes Volume (K), by Application 2025 & 2033
- Figure 41: Middle East & Africa electronic goods packaging boxes Revenue Share (%), by Application 2025 & 2033
- Figure 42: Middle East & Africa electronic goods packaging boxes Volume Share (%), by Application 2025 & 2033
- Figure 43: Middle East & Africa electronic goods packaging boxes Revenue (undefined), by Types 2025 & 2033
- Figure 44: Middle East & Africa electronic goods packaging boxes Volume (K), by Types 2025 & 2033
- Figure 45: Middle East & Africa electronic goods packaging boxes Revenue Share (%), by Types 2025 & 2033
- Figure 46: Middle East & Africa electronic goods packaging boxes Volume Share (%), by Types 2025 & 2033
- Figure 47: Middle East & Africa electronic goods packaging boxes Revenue (undefined), by Country 2025 & 2033
- Figure 48: Middle East & Africa electronic goods packaging boxes Volume (K), by Country 2025 & 2033
- Figure 49: Middle East & Africa electronic goods packaging boxes Revenue Share (%), by Country 2025 & 2033
- Figure 50: Middle East & Africa electronic goods packaging boxes Volume Share (%), by Country 2025 & 2033
- Figure 51: Asia Pacific electronic goods packaging boxes Revenue (undefined), by Application 2025 & 2033
- Figure 52: Asia Pacific electronic goods packaging boxes Volume (K), by Application 2025 & 2033
- Figure 53: Asia Pacific electronic goods packaging boxes Revenue Share (%), by Application 2025 & 2033
- Figure 54: Asia Pacific electronic goods packaging boxes Volume Share (%), by Application 2025 & 2033
- Figure 55: Asia Pacific electronic goods packaging boxes Revenue (undefined), by Types 2025 & 2033
- Figure 56: Asia Pacific electronic goods packaging boxes Volume (K), by Types 2025 & 2033
- Figure 57: Asia Pacific electronic goods packaging boxes Revenue Share (%), by Types 2025 & 2033
- Figure 58: Asia Pacific electronic goods packaging boxes Volume Share (%), by Types 2025 & 2033
- Figure 59: Asia Pacific electronic goods packaging boxes Revenue (undefined), by Country 2025 & 2033
- Figure 60: Asia Pacific electronic goods packaging boxes Volume (K), by Country 2025 & 2033
- Figure 61: Asia Pacific electronic goods packaging boxes Revenue Share (%), by Country 2025 & 2033
- Figure 62: Asia Pacific electronic goods packaging boxes Volume Share (%), by Country 2025 & 2033
List of Tables
- Table 1: Global electronic goods packaging boxes Revenue undefined Forecast, by Application 2020 & 2033
- Table 2: Global electronic goods packaging boxes Volume K Forecast, by Application 2020 & 2033
- Table 3: Global electronic goods packaging boxes Revenue undefined Forecast, by Types 2020 & 2033
- Table 4: Global electronic goods packaging boxes Volume K Forecast, by Types 2020 & 2033
- Table 5: Global electronic goods packaging boxes Revenue undefined Forecast, by Region 2020 & 2033
- Table 6: Global electronic goods packaging boxes Volume K Forecast, by Region 2020 & 2033
- Table 7: Global electronic goods packaging boxes Revenue undefined Forecast, by Application 2020 & 2033
- Table 8: Global electronic goods packaging boxes Volume K Forecast, by Application 2020 & 2033
- Table 9: Global electronic goods packaging boxes Revenue undefined Forecast, by Types 2020 & 2033
- Table 10: Global electronic goods packaging boxes Volume K Forecast, by Types 2020 & 2033
- Table 11: Global electronic goods packaging boxes Revenue undefined Forecast, by Country 2020 & 2033
- Table 12: Global electronic goods packaging boxes Volume K Forecast, by Country 2020 & 2033
- Table 13: United States electronic goods packaging boxes Revenue (undefined) Forecast, by Application 2020 & 2033
- Table 14: United States electronic goods packaging boxes Volume (K) Forecast, by Application 2020 & 2033
- Table 15: Canada electronic goods packaging boxes Revenue (undefined) Forecast, by Application 2020 & 2033
- Table 16: Canada electronic goods packaging boxes Volume (K) Forecast, by Application 2020 & 2033
- Table 17: Mexico electronic goods packaging boxes Revenue (undefined) Forecast, by Application 2020 & 2033
- Table 18: Mexico electronic goods packaging boxes Volume (K) Forecast, by Application 2020 & 2033
- Table 19: Global electronic goods packaging boxes Revenue undefined Forecast, by Application 2020 & 2033
- Table 20: Global electronic goods packaging boxes Volume K Forecast, by Application 2020 & 2033
- Table 21: Global electronic goods packaging boxes Revenue undefined Forecast, by Types 2020 & 2033
- Table 22: Global electronic goods packaging boxes Volume K Forecast, by Types 2020 & 2033
- Table 23: Global electronic goods packaging boxes Revenue undefined Forecast, by Country 2020 & 2033
- Table 24: Global electronic goods packaging boxes Volume K Forecast, by Country 2020 & 2033
- Table 25: Brazil electronic goods packaging boxes Revenue (undefined) Forecast, by Application 2020 & 2033
- Table 26: Brazil electronic goods packaging boxes Volume (K) Forecast, by Application 2020 & 2033
- Table 27: Argentina electronic goods packaging boxes Revenue (undefined) Forecast, by Application 2020 & 2033
- Table 28: Argentina electronic goods packaging boxes Volume (K) Forecast, by Application 2020 & 2033
- Table 29: Rest of South America electronic goods packaging boxes Revenue (undefined) Forecast, by Application 2020 & 2033
- Table 30: Rest of South America electronic goods packaging boxes Volume (K) Forecast, by Application 2020 & 2033
- Table 31: Global electronic goods packaging boxes Revenue undefined Forecast, by Application 2020 & 2033
- Table 32: Global electronic goods packaging boxes Volume K Forecast, by Application 2020 & 2033
- Table 33: Global electronic goods packaging boxes Revenue undefined Forecast, by Types 2020 & 2033
- Table 34: Global electronic goods packaging boxes Volume K Forecast, by Types 2020 & 2033
- Table 35: Global electronic goods packaging boxes Revenue undefined Forecast, by Country 2020 & 2033
- Table 36: Global electronic goods packaging boxes Volume K Forecast, by Country 2020 & 2033
- Table 37: United Kingdom electronic goods packaging boxes Revenue (undefined) Forecast, by Application 2020 & 2033
- Table 38: United Kingdom electronic goods packaging boxes Volume (K) Forecast, by Application 2020 & 2033
- Table 39: Germany electronic goods packaging boxes Revenue (undefined) Forecast, by Application 2020 & 2033
- Table 40: Germany electronic goods packaging boxes Volume (K) Forecast, by Application 2020 & 2033
- Table 41: France electronic goods packaging boxes Revenue (undefined) Forecast, by Application 2020 & 2033
- Table 42: France electronic goods packaging boxes Volume (K) Forecast, by Application 2020 & 2033
- Table 43: Italy electronic goods packaging boxes Revenue (undefined) Forecast, by Application 2020 & 2033
- Table 44: Italy electronic goods packaging boxes Volume (K) Forecast, by Application 2020 & 2033
- Table 45: Spain electronic goods packaging boxes Revenue (undefined) Forecast, by Application 2020 & 2033
- Table 46: Spain electronic goods packaging boxes Volume (K) Forecast, by Application 2020 & 2033
- Table 47: Russia electronic goods packaging boxes Revenue (undefined) Forecast, by Application 2020 & 2033
- Table 48: Russia electronic goods packaging boxes Volume (K) Forecast, by Application 2020 & 2033
- Table 49: Benelux electronic goods packaging boxes Revenue (undefined) Forecast, by Application 2020 & 2033
- Table 50: Benelux electronic goods packaging boxes Volume (K) Forecast, by Application 2020 & 2033
- Table 51: Nordics electronic goods packaging boxes Revenue (undefined) Forecast, by Application 2020 & 2033
- Table 52: Nordics electronic goods packaging boxes Volume (K) Forecast, by Application 2020 & 2033
- Table 53: Rest of Europe electronic goods packaging boxes Revenue (undefined) Forecast, by Application 2020 & 2033
- Table 54: Rest of Europe electronic goods packaging boxes Volume (K) Forecast, by Application 2020 & 2033
- Table 55: Global electronic goods packaging boxes Revenue undefined Forecast, by Application 2020 & 2033
- Table 56: Global electronic goods packaging boxes Volume K Forecast, by Application 2020 & 2033
- Table 57: Global electronic goods packaging boxes Revenue undefined Forecast, by Types 2020 & 2033
- Table 58: Global electronic goods packaging boxes Volume K Forecast, by Types 2020 & 2033
- Table 59: Global electronic goods packaging boxes Revenue undefined Forecast, by Country 2020 & 2033
- Table 60: Global electronic goods packaging boxes Volume K Forecast, by Country 2020 & 2033
- Table 61: Turkey electronic goods packaging boxes Revenue (undefined) Forecast, by Application 2020 & 2033
- Table 62: Turkey electronic goods packaging boxes Volume (K) Forecast, by Application 2020 & 2033
- Table 63: Israel electronic goods packaging boxes Revenue (undefined) Forecast, by Application 2020 & 2033
- Table 64: Israel electronic goods packaging boxes Volume (K) Forecast, by Application 2020 & 2033
- Table 65: GCC electronic goods packaging boxes Revenue (undefined) Forecast, by Application 2020 & 2033
- Table 66: GCC electronic goods packaging boxes Volume (K) Forecast, by Application 2020 & 2033
- Table 67: North Africa electronic goods packaging boxes Revenue (undefined) Forecast, by Application 2020 & 2033
- Table 68: North Africa electronic goods packaging boxes Volume (K) Forecast, by Application 2020 & 2033
- Table 69: South Africa electronic goods packaging boxes Revenue (undefined) Forecast, by Application 2020 & 2033
- Table 70: South Africa electronic goods packaging boxes Volume (K) Forecast, by Application 2020 & 2033
- Table 71: Rest of Middle East & Africa electronic goods packaging boxes Revenue (undefined) Forecast, by Application 2020 & 2033
- Table 72: Rest of Middle East & Africa electronic goods packaging boxes Volume (K) Forecast, by Application 2020 & 2033
- Table 73: Global electronic goods packaging boxes Revenue undefined Forecast, by Application 2020 & 2033
- Table 74: Global electronic goods packaging boxes Volume K Forecast, by Application 2020 & 2033
- Table 75: Global electronic goods packaging boxes Revenue undefined Forecast, by Types 2020 & 2033
- Table 76: Global electronic goods packaging boxes Volume K Forecast, by Types 2020 & 2033
- Table 77: Global electronic goods packaging boxes Revenue undefined Forecast, by Country 2020 & 2033
- Table 78: Global electronic goods packaging boxes Volume K Forecast, by Country 2020 & 2033
- Table 79: China electronic goods packaging boxes Revenue (undefined) Forecast, by Application 2020 & 2033
- Table 80: China electronic goods packaging boxes Volume (K) Forecast, by Application 2020 & 2033
- Table 81: India electronic goods packaging boxes Revenue (undefined) Forecast, by Application 2020 & 2033
- Table 82: India electronic goods packaging boxes Volume (K) Forecast, by Application 2020 & 2033
- Table 83: Japan electronic goods packaging boxes Revenue (undefined) Forecast, by Application 2020 & 2033
- Table 84: Japan electronic goods packaging boxes Volume (K) Forecast, by Application 2020 & 2033
- Table 85: South Korea electronic goods packaging boxes Revenue (undefined) Forecast, by Application 2020 & 2033
- Table 86: South Korea electronic goods packaging boxes Volume (K) Forecast, by Application 2020 & 2033
- Table 87: ASEAN electronic goods packaging boxes Revenue (undefined) Forecast, by Application 2020 & 2033
- Table 88: ASEAN electronic goods packaging boxes Volume (K) Forecast, by Application 2020 & 2033
- Table 89: Oceania electronic goods packaging boxes Revenue (undefined) Forecast, by Application 2020 & 2033
- Table 90: Oceania electronic goods packaging boxes Volume (K) Forecast, by Application 2020 & 2033
- Table 91: Rest of Asia Pacific electronic goods packaging boxes Revenue (undefined) Forecast, by Application 2020 & 2033
- Table 92: Rest of Asia Pacific electronic goods packaging boxes Volume (K) Forecast, by Application 2020 & 2033
Frequently Asked Questions
1. What is the projected Compound Annual Growth Rate (CAGR) of the electronic goods packaging boxes?
The projected CAGR is approximately 13%.
2. Which companies are prominent players in the electronic goods packaging boxes?
Key companies in the market include DS Smith, International Paper, Mondi, Sealed Air, Lihua Group, Smurfit Kappa, Dunapack Packaging, Georgia Pacific, Graham Packaging, Pregis, Sonoco, Stora Enso, Unisource Worldwide, Universal Protective Packaging, WestRock.
3. What are the main segments of the electronic goods packaging boxes?
The market segments include Application, Types.
4. Can you provide details about the market size?
The market size is estimated to be USD XXX N/A as of 2022.
5. What are some drivers contributing to market growth?
N/A
6. What are the notable trends driving market growth?
N/A
7. Are there any restraints impacting market growth?
N/A
8. Can you provide examples of recent developments in the market?
N/A
9. What pricing options are available for accessing the report?
Pricing options include single-user, multi-user, and enterprise licenses priced at USD 4350.00, USD 6525.00, and USD 8700.00 respectively.
10. Is the market size provided in terms of value or volume?
The market size is provided in terms of value, measured in N/A and volume, measured in K.
11. Are there any specific market keywords associated with the report?
Yes, the market keyword associated with the report is "electronic goods packaging boxes," which aids in identifying and referencing the specific market segment covered.
12. How do I determine which pricing option suits my needs best?
The pricing options vary based on user requirements and access needs. Individual users may opt for single-user licenses, while businesses requiring broader access may choose multi-user or enterprise licenses for cost-effective access to the report.
13. Are there any additional resources or data provided in the electronic goods packaging boxes report?
While the report offers comprehensive insights, it's advisable to review the specific contents or supplementary materials provided to ascertain if additional resources or data are available.
14. How can I stay updated on further developments or reports in the electronic goods packaging boxes?
To stay informed about further developments, trends, and reports in the electronic goods packaging boxes, consider subscribing to industry newsletters, following relevant companies and organizations, or regularly checking reputable industry news sources and publications.
Methodology
Step 1 - Identification of Relevant Samples Size from Population Database


Step 2 - Approaches for Defining Global Market Size (Value, Volume* & Price*)

Note*: In applicable scenarios
Step 3 - Data Sources
Primary Research
- Web Analytics
- Survey Reports
- Research Institute
- Latest Research Reports
- Opinion Leaders
Secondary Research
- Annual Reports
- White Paper
- Latest Press Release
- Industry Association
- Paid Database
- Investor Presentations

Step 4 - Data Triangulation
Involves using different sources of information in order to increase the validity of a study
These sources are likely to be stakeholders in a program - participants, other researchers, program staff, other community members, and so on.
Then we put all data in single framework & apply various statistical tools to find out the dynamic on the market.
During the analysis stage, feedback from the stakeholder groups would be compared to determine areas of agreement as well as areas of divergence