

Key Insights
The Electronic Toll Collection (ETC) System market is experiencing robust growth, driven by increasing traffic congestion in urban areas and a rising preference for faster, more efficient payment methods. The market's Compound Annual Growth Rate (CAGR) exceeding 8% from 2019-2033 indicates a significant expansion trajectory. Key drivers include government initiatives promoting smart transportation infrastructure, technological advancements in RFID and GPS-based tolling systems, and the growing adoption of cashless payment solutions. The Electronic Toll Collection segment is the fastest-growing within the broader Toll Collection market, fueled by its ability to minimize traffic delays and improve operational efficiency. Market segmentation reveals strong demand across various applications, including bridges, roads, and tunnels, with Electronic Toll Collection leading the charge in all three. Leading players such as Thales Group, Xerox Corporation, and others are actively investing in R&D and strategic partnerships to enhance their market position. The North American market currently holds a significant share, largely due to early adoption of ETC systems and robust infrastructure investments. However, the Asia-Pacific region is expected to experience the fastest growth during the forecast period (2025-2033), driven by rapid urbanization and significant government investments in transportation infrastructure development across countries like China and India.
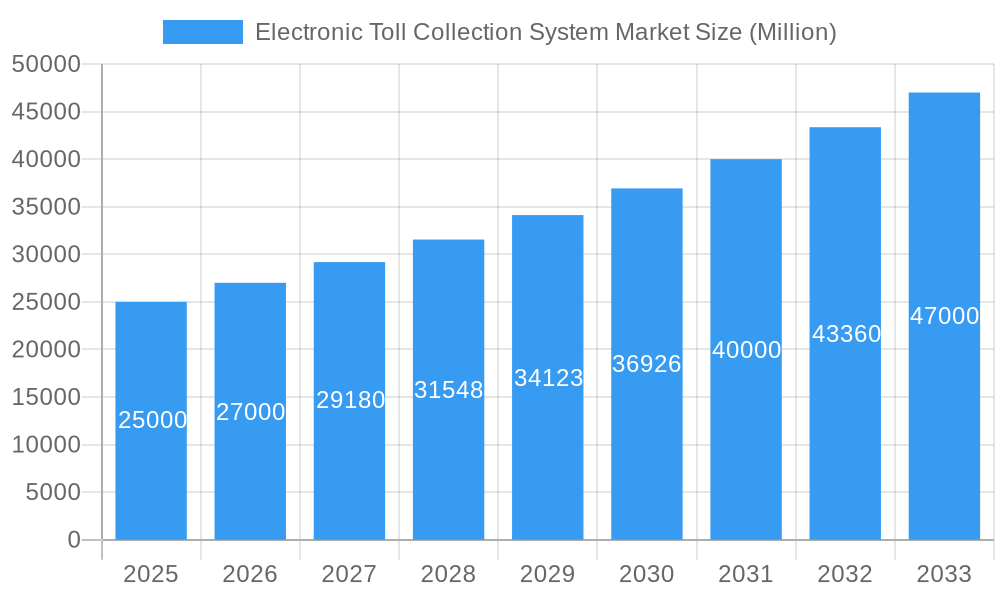
Electronic Toll Collection System Market Market Size (In Billion)
The market is segmented by toll collection type (Barrier Toll Collection, Entry/Exit Toll Collection, Electronic Toll Collection) and application type (Bridges, Roads, Tunnels). While barrier and entry/exit toll collection systems remain prevalent, Electronic Toll Collection is rapidly gaining traction due to its seamless integration with modern payment gateways and improved traffic flow. Market restraints include the high initial investment costs for deploying ETC systems, concerns around data privacy and security, and the need for robust and reliable communication networks in various geographical locations. Nevertheless, ongoing technological improvements, falling hardware costs, and increasing public awareness of the benefits of ETC systems are expected to mitigate these challenges, paving the way for continued market expansion. Future market trends point towards greater integration of ETC systems with Intelligent Transportation Systems (ITS), providing more sophisticated traffic management solutions and enhancing overall efficiency and safety.
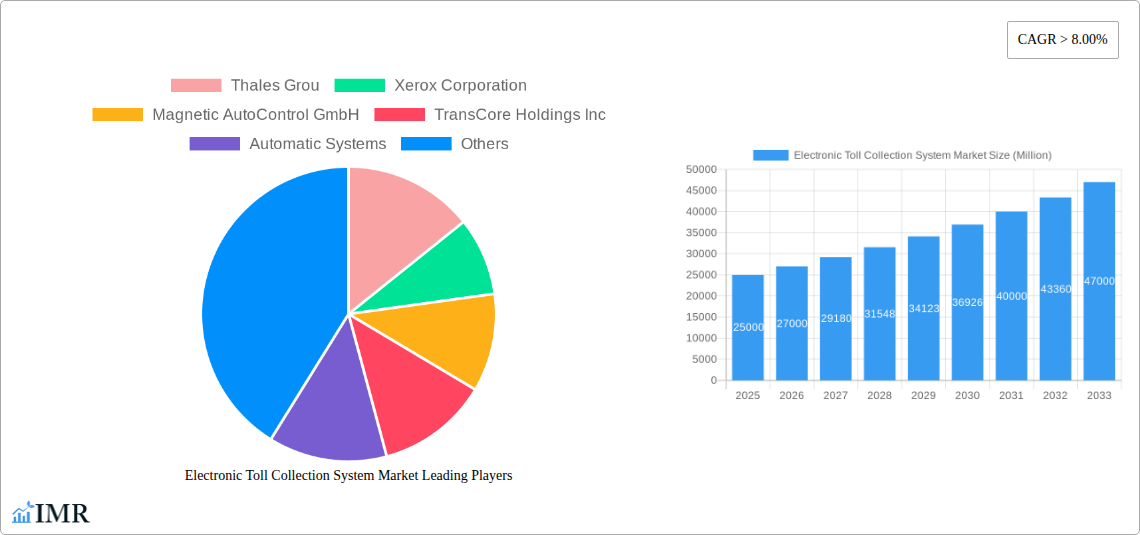
Electronic Toll Collection System Market Company Market Share
Electronic Toll Collection System Market: A Comprehensive Report (2019-2033)
This in-depth report provides a comprehensive analysis of the Electronic Toll Collection (ETC) System market, encompassing market dynamics, growth trends, regional dominance, product landscape, key players, and future outlook. The study period covers 2019-2033, with a base year of 2025 and a forecast period of 2025-2033. The total market size in 2025 is estimated at XXX Million and is projected to reach XXX Million by 2033. This report serves as an invaluable resource for industry professionals, investors, and stakeholders seeking to understand and capitalize on the opportunities within this rapidly evolving sector. The parent market is Intelligent Transportation Systems (ITS) and the child market is Toll Collection Systems.
Electronic Toll Collection System Market Dynamics & Structure
This section analyzes the competitive landscape, technological advancements, regulatory influences, and market trends shaping the ETC system market. The market is characterized by a moderately consolidated structure, with key players holding significant market share. The global market is currently dominated by a few large players such as Thales Group and others, with a combined market share of approximately XX%. However, the market exhibits a dynamic competitive environment with several regional and niche players.
- Market Concentration: Moderately concentrated with top 5 players holding approximately XX% market share in 2025.
- Technological Innovation: Continuous innovation in RFID, DSRC, and other communication technologies drives market growth. The integration of AI and big data analytics is also a significant factor.
- Regulatory Frameworks: Government regulations and policies mandating ETC systems for highway infrastructure development influence market growth positively. However, variations in regulations across regions present challenges.
- Competitive Product Substitutes: Traditional barrier toll systems remain a substitute, but their limitations in terms of efficiency and scalability are prompting a shift towards ETC systems.
- End-User Demographics: The primary end-users are highway authorities, transportation agencies, and private toll operators.
- M&A Trends: The last five years (2019-2024) witnessed approximately XX M&A deals, primarily focused on technology integration and market expansion. The average deal size was approximately XX Million. Consolidation is anticipated to continue, especially amongst smaller players.
Electronic Toll Collection System Market Growth Trends & Insights
The ETC system market has witnessed significant growth over the past few years, driven by increasing urbanization, traffic congestion, and government initiatives promoting efficient transportation systems. The market experienced a CAGR of approximately XX% during the historical period (2019-2024) and is projected to maintain a CAGR of XX% during the forecast period (2025-2033). This growth is fueled by the increasing adoption of electronic toll collection systems in various applications, such as bridges, roads, and tunnels, across the globe. The rising demand for seamless and efficient toll collection solutions, coupled with advancements in technology, is further accelerating market growth. The shift in consumer preference toward cashless transactions and the integration of advanced technologies like Artificial Intelligence (AI) and the Internet of Things (IoT) in ETC systems are significant factors influencing the growth trajectory of the market. Market penetration in developed regions is high (approximately XX%), whereas in developing regions, it shows significant growth potential.
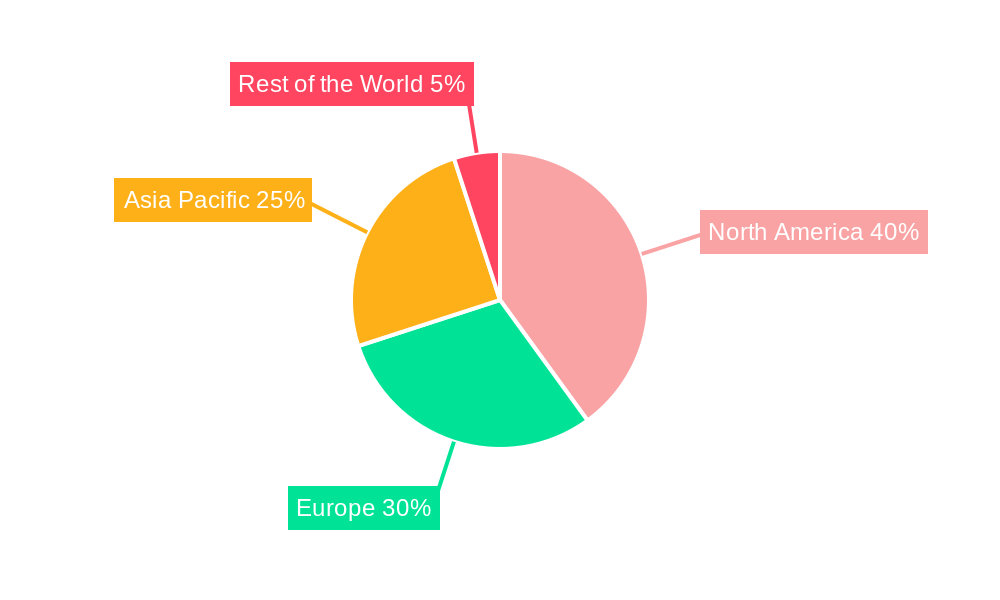
Dominant Regions, Countries, or Segments in Electronic Toll Collection System Market
North America and Europe currently hold the largest market share in the ETC system market, driven by strong infrastructure development and early adoption of advanced technologies. However, Asia Pacific is projected to experience the fastest growth during the forecast period, fueled by significant infrastructure investments and government initiatives to upgrade transportation infrastructure.
By Toll Collection Type:
- Electronic Toll Collection: This segment dominates the market due to its efficiency, reduced congestion, and ease of use.
- Barrier Toll Collection: This segment is gradually declining due to limitations in efficiency and increasing demand for automated systems.
- Entry/Exit Toll Collection: This segment holds a niche market share and is mostly employed in specific applications.
By Application Type:
- Roads: This application segment dominates the market due to the extensive road networks across the globe.
- Bridges: This segment experiences significant growth due to the increasing construction of new bridges and upgrading existing infrastructure.
- Tunnels: This segment presents a significant market opportunity due to the need for efficient toll collection in tunnel systems.
Key drivers for growth in these segments include government policies promoting smart city initiatives, private investments in infrastructure development, and technological innovations that enhance the efficiency and security of ETC systems. North America accounts for approximately XX% of the market share in 2025, followed by Europe at XX% and Asia-Pacific at XX%. Asia-Pacific is expected to witness the highest CAGR during the forecast period, driven by rapid infrastructure development and rising adoption rates.
Electronic Toll Collection System Market Product Landscape
ETC systems encompass a range of technologies, including RFID, DSRC, and other communication systems, integrated with advanced software and hardware components. Product innovations focus on improving accuracy, speed, security, and interoperability. Key performance indicators include transaction speed, error rates, and overall system reliability. Unique selling propositions center on seamless integration, data analytics capabilities, and cost-effectiveness. Recent advancements include the integration of AI and machine learning for predictive maintenance and fraud detection.
Key Drivers, Barriers & Challenges in Electronic Toll Collection System Market
Key Drivers:
- Increasing urbanization and traffic congestion are pushing for efficient toll collection methods.
- Government initiatives promoting smart cities and advanced transportation systems.
- Technological advancements in RFID, DSRC, and other related technologies.
- Growing demand for cashless transactions.
Challenges & Restraints:
- High initial investment costs for implementing ETC systems can be a barrier for smaller operators.
- Ensuring interoperability between different ETC systems across various regions is crucial.
- Security concerns related to data breaches and fraud need to be addressed. Approximately XX% of the ETC system market expressed concerns regarding data security in 2024, leading to increased investment in robust security solutions.
- Regulatory hurdles and differing standards across jurisdictions can hinder seamless market expansion.
Emerging Opportunities in Electronic Toll Collection System Market
- Expanding into untapped markets in developing economies presents significant growth opportunities.
- Integration of ETC systems with other smart city technologies, such as traffic management systems, can improve overall transportation efficiency.
- Development of more advanced and secure payment technologies, such as blockchain-based solutions.
- The increasing demand for multi-lane free-flow ETC systems presents a substantial growth prospect for companies specializing in this field.
Growth Accelerators in the Electronic Toll Collection System Market Industry
Technological innovations such as the adoption of 5G communication for enhanced data transmission, AI-powered analytics for traffic optimization, and the integration of blockchain for increased security and transparency are significant long-term growth catalysts. Strategic partnerships between technology providers and transportation authorities facilitate the implementation of advanced ETC solutions. The ongoing expansion of highway networks and the construction of new transportation infrastructure in developing regions offer enormous growth potential.
Key Players Shaping the Electronic Toll Collection System Market Market
- Thales Group
- Xerox Corporation
- Magnetic AutoControl GmbH
- TransCore Holdings Inc
- Automatic Systems
- Feig Electronics
- TRMI Systems Integration
- Siemens AG
- Schneider Electric SE
- Nedap NV
- DENSO Corporation
- Mitsubishi Heavy Industries Ltd
Notable Milestones in Electronic Toll Collection System Market Sector
- 2020, Q4: Launch of a new generation of RFID-based ETC systems by Thales Group, significantly enhancing transaction speed and accuracy.
- 2021, Q2: Strategic partnership between TransCore Holdings Inc and a major highway authority to deploy a large-scale ETC system.
- 2022, Q3: Successful completion of a major M&A deal consolidating two leading ETC system providers, creating a stronger market player.
- 2023, Q1: Introduction of AI-powered fraud detection system by Siemens AG, leading to improved system security.
In-Depth Electronic Toll Collection System Market Market Outlook
The future of the ETC system market is promising, driven by sustained investment in infrastructure, technological innovations, and the increasing adoption of electronic payment systems. Strategic opportunities lie in developing integrated solutions that leverage emerging technologies such as AI, IoT, and 5G communication, ensuring seamless interoperability across different regions and expanding into high-growth markets. The market's future growth will heavily depend on the seamless integration of advanced technologies with the current system and its expansion into developing economies. The market is poised for significant expansion as governments continue to prioritize efficient and sustainable transportation solutions.
Electronic Toll Collection System Market Segmentation
-
1. Toll Collection Type
- 1.1. Barrier Toll Collection
- 1.2. Entry/Exit Toll Collection
- 1.3. Electronic Toll Collection
-
2. Application Type
- 2.1. Bridges
- 2.2. Roads
- 2.3. Tunnels
Electronic Toll Collection System Market Segmentation By Geography
-
1. North America
- 1.1. United States
- 1.2. Canada
- 1.3. Mexico
-
2. Europe
- 2.1. Germany
- 2.2. United Kingdom
- 2.3. France
- 2.4. Italy
- 2.5. Rest of Europe
-
3. Asia Pacific
- 3.1. China
- 3.2. Japan
- 3.3. India
- 3.4. South Korea
- 3.5. Rest of Asia Pacific
-
4. Rest of the World
- 4.1. Brazil
- 4.2. South Africa
- 4.3. Other Countries
Electronic Toll Collection System Market Regional Market Share
Geographic Coverage of Electronic Toll Collection System Market
Electronic Toll Collection System Market REPORT HIGHLIGHTS
| Aspects | Details |
|---|---|
| Study Period | 2020-2034 |
| Base Year | 2025 |
| Estimated Year | 2026 |
| Forecast Period | 2026-2034 |
| Historical Period | 2020-2025 |
| Growth Rate | CAGR of 8.34% from 2020-2034 |
| Segmentation |
|
Table of Contents
- 1. Introduction
- 1.1. Research Scope
- 1.2. Market Segmentation
- 1.3. Research Objective
- 1.4. Definitions and Assumptions
- 2. Executive Summary
- 2.1. Market Snapshot
- 3. Market Dynamics
- 3.1. Market Drivers
- 3.2. Market Restrains
- 3.3. Market Trends
- 3.4. Market Opportunities
- 4. Market Factor Analysis
- 4.1. Porters Five Forces
- 4.1.1. Bargaining Power of Suppliers
- 4.1.2. Bargaining Power of Buyers
- 4.1.3. Threat of New Entrants
- 4.1.4. Threat of Substitutes
- 4.1.5. Competitive Rivalry
- 4.2. PESTEL analysis
- 4.3. BCG Analysis
- 4.3.1. Stars (High Growth, High Market Share)
- 4.3.2. Cash Cows (Low Growth, High Market Share)
- 4.3.3. Question Mark (High Growth, Low Market Share)
- 4.3.4. Dogs (Low Growth, Low Market Share)
- 4.4. Ansoff Matrix Analysis
- 4.5. Supply Chain Analysis
- 4.6. Regulatory Landscape
- 4.7. Current Market Potential and Opportunity Assessment (TAM–SAM–SOM Framework)
- 4.8. IMR Analyst Note
- 4.1. Porters Five Forces
- 5. Market Analysis, Insights and Forecast 2021-2033
- 5.1. Market Analysis, Insights and Forecast - by Toll Collection Type
- 5.1.1. Barrier Toll Collection
- 5.1.2. Entry/Exit Toll Collection
- 5.1.3. Electronic Toll Collection
- 5.2. Market Analysis, Insights and Forecast - by Application Type
- 5.2.1. Bridges
- 5.2.2. Roads
- 5.2.3. Tunnels
- 5.3. Market Analysis, Insights and Forecast - by Region
- 5.3.1. North America
- 5.3.2. Europe
- 5.3.3. Asia Pacific
- 5.3.4. Rest of the World
- 5.1. Market Analysis, Insights and Forecast - by Toll Collection Type
- 6. Global Electronic Toll Collection System Market Analysis, Insights and Forecast, 2021-2033
- 6.1. Market Analysis, Insights and Forecast - by Toll Collection Type
- 6.1.1. Barrier Toll Collection
- 6.1.2. Entry/Exit Toll Collection
- 6.1.3. Electronic Toll Collection
- 6.2. Market Analysis, Insights and Forecast - by Application Type
- 6.2.1. Bridges
- 6.2.2. Roads
- 6.2.3. Tunnels
- 6.1. Market Analysis, Insights and Forecast - by Toll Collection Type
- 7. North America Electronic Toll Collection System Market Analysis, Insights and Forecast, 2020-2032
- 7.1. Market Analysis, Insights and Forecast - by Toll Collection Type
- 7.1.1. Barrier Toll Collection
- 7.1.2. Entry/Exit Toll Collection
- 7.1.3. Electronic Toll Collection
- 7.2. Market Analysis, Insights and Forecast - by Application Type
- 7.2.1. Bridges
- 7.2.2. Roads
- 7.2.3. Tunnels
- 7.1. Market Analysis, Insights and Forecast - by Toll Collection Type
- 8. Europe Electronic Toll Collection System Market Analysis, Insights and Forecast, 2020-2032
- 8.1. Market Analysis, Insights and Forecast - by Toll Collection Type
- 8.1.1. Barrier Toll Collection
- 8.1.2. Entry/Exit Toll Collection
- 8.1.3. Electronic Toll Collection
- 8.2. Market Analysis, Insights and Forecast - by Application Type
- 8.2.1. Bridges
- 8.2.2. Roads
- 8.2.3. Tunnels
- 8.1. Market Analysis, Insights and Forecast - by Toll Collection Type
- 9. Asia Pacific Electronic Toll Collection System Market Analysis, Insights and Forecast, 2020-2032
- 9.1. Market Analysis, Insights and Forecast - by Toll Collection Type
- 9.1.1. Barrier Toll Collection
- 9.1.2. Entry/Exit Toll Collection
- 9.1.3. Electronic Toll Collection
- 9.2. Market Analysis, Insights and Forecast - by Application Type
- 9.2.1. Bridges
- 9.2.2. Roads
- 9.2.3. Tunnels
- 9.1. Market Analysis, Insights and Forecast - by Toll Collection Type
- 10. Rest of the World Electronic Toll Collection System Market Analysis, Insights and Forecast, 2020-2032
- 10.1. Market Analysis, Insights and Forecast - by Toll Collection Type
- 10.1.1. Barrier Toll Collection
- 10.1.2. Entry/Exit Toll Collection
- 10.1.3. Electronic Toll Collection
- 10.2. Market Analysis, Insights and Forecast - by Application Type
- 10.2.1. Bridges
- 10.2.2. Roads
- 10.2.3. Tunnels
- 10.1. Market Analysis, Insights and Forecast - by Toll Collection Type
- 11. Competitive Analysis
- 11.1. Company Profiles
- 11.1.1 Thales Grou
- 11.1.1.1. Company Overview
- 11.1.1.2. Products
- 11.1.1.3. Company Financials
- 11.1.1.4. SWOT Analysis
- 11.1.2 Xerox Corporation
- 11.1.2.1. Company Overview
- 11.1.2.2. Products
- 11.1.2.3. Company Financials
- 11.1.2.4. SWOT Analysis
- 11.1.3 Magnetic AutoControl GmbH
- 11.1.3.1. Company Overview
- 11.1.3.2. Products
- 11.1.3.3. Company Financials
- 11.1.3.4. SWOT Analysis
- 11.1.4 TransCore Holdings Inc
- 11.1.4.1. Company Overview
- 11.1.4.2. Products
- 11.1.4.3. Company Financials
- 11.1.4.4. SWOT Analysis
- 11.1.5 Automatic Systems
- 11.1.5.1. Company Overview
- 11.1.5.2. Products
- 11.1.5.3. Company Financials
- 11.1.5.4. SWOT Analysis
- 11.1.6 Feig Electronics
- 11.1.6.1. Company Overview
- 11.1.6.2. Products
- 11.1.6.3. Company Financials
- 11.1.6.4. SWOT Analysis
- 11.1.7 TRMI Systems Integration
- 11.1.7.1. Company Overview
- 11.1.7.2. Products
- 11.1.7.3. Company Financials
- 11.1.7.4. SWOT Analysis
- 11.1.8 Siemens AG
- 11.1.8.1. Company Overview
- 11.1.8.2. Products
- 11.1.8.3. Company Financials
- 11.1.8.4. SWOT Analysis
- 11.1.9 Schneider Electric SE
- 11.1.9.1. Company Overview
- 11.1.9.2. Products
- 11.1.9.3. Company Financials
- 11.1.9.4. SWOT Analysis
- 11.1.10 Nedap NV
- 11.1.10.1. Company Overview
- 11.1.10.2. Products
- 11.1.10.3. Company Financials
- 11.1.10.4. SWOT Analysis
- 11.1.11 DENSO Corporation
- 11.1.11.1. Company Overview
- 11.1.11.2. Products
- 11.1.11.3. Company Financials
- 11.1.11.4. SWOT Analysis
- 11.1.12 Mitsubishi Heavy Industries Ltd
- 11.1.12.1. Company Overview
- 11.1.12.2. Products
- 11.1.12.3. Company Financials
- 11.1.12.4. SWOT Analysis
- 11.1.1 Thales Grou
- 11.2. Market Entropy
- 11.2.1 Company's Key Areas Served
- 11.2.2 Recent Developments
- 11.3. Company Market Share Analysis 2025
- 11.3.1 Top 5 Companies Market Share Analysis
- 11.3.2 Top 3 Companies Market Share Analysis
- 11.4. List of Potential Customers
- 12. Research Methodology
List of Figures
- Figure 1: Global Electronic Toll Collection System Market Revenue Breakdown (billion, %) by Region 2025 & 2033
- Figure 2: North America Electronic Toll Collection System Market Revenue (billion), by Toll Collection Type 2025 & 2033
- Figure 3: North America Electronic Toll Collection System Market Revenue Share (%), by Toll Collection Type 2025 & 2033
- Figure 4: North America Electronic Toll Collection System Market Revenue (billion), by Application Type 2025 & 2033
- Figure 5: North America Electronic Toll Collection System Market Revenue Share (%), by Application Type 2025 & 2033
- Figure 6: North America Electronic Toll Collection System Market Revenue (billion), by Country 2025 & 2033
- Figure 7: North America Electronic Toll Collection System Market Revenue Share (%), by Country 2025 & 2033
- Figure 8: Europe Electronic Toll Collection System Market Revenue (billion), by Toll Collection Type 2025 & 2033
- Figure 9: Europe Electronic Toll Collection System Market Revenue Share (%), by Toll Collection Type 2025 & 2033
- Figure 10: Europe Electronic Toll Collection System Market Revenue (billion), by Application Type 2025 & 2033
- Figure 11: Europe Electronic Toll Collection System Market Revenue Share (%), by Application Type 2025 & 2033
- Figure 12: Europe Electronic Toll Collection System Market Revenue (billion), by Country 2025 & 2033
- Figure 13: Europe Electronic Toll Collection System Market Revenue Share (%), by Country 2025 & 2033
- Figure 14: Asia Pacific Electronic Toll Collection System Market Revenue (billion), by Toll Collection Type 2025 & 2033
- Figure 15: Asia Pacific Electronic Toll Collection System Market Revenue Share (%), by Toll Collection Type 2025 & 2033
- Figure 16: Asia Pacific Electronic Toll Collection System Market Revenue (billion), by Application Type 2025 & 2033
- Figure 17: Asia Pacific Electronic Toll Collection System Market Revenue Share (%), by Application Type 2025 & 2033
- Figure 18: Asia Pacific Electronic Toll Collection System Market Revenue (billion), by Country 2025 & 2033
- Figure 19: Asia Pacific Electronic Toll Collection System Market Revenue Share (%), by Country 2025 & 2033
- Figure 20: Rest of the World Electronic Toll Collection System Market Revenue (billion), by Toll Collection Type 2025 & 2033
- Figure 21: Rest of the World Electronic Toll Collection System Market Revenue Share (%), by Toll Collection Type 2025 & 2033
- Figure 22: Rest of the World Electronic Toll Collection System Market Revenue (billion), by Application Type 2025 & 2033
- Figure 23: Rest of the World Electronic Toll Collection System Market Revenue Share (%), by Application Type 2025 & 2033
- Figure 24: Rest of the World Electronic Toll Collection System Market Revenue (billion), by Country 2025 & 2033
- Figure 25: Rest of the World Electronic Toll Collection System Market Revenue Share (%), by Country 2025 & 2033
List of Tables
- Table 1: Global Electronic Toll Collection System Market Revenue billion Forecast, by Toll Collection Type 2020 & 2033
- Table 2: Global Electronic Toll Collection System Market Revenue billion Forecast, by Application Type 2020 & 2033
- Table 3: Global Electronic Toll Collection System Market Revenue billion Forecast, by Region 2020 & 2033
- Table 4: Global Electronic Toll Collection System Market Revenue billion Forecast, by Toll Collection Type 2020 & 2033
- Table 5: Global Electronic Toll Collection System Market Revenue billion Forecast, by Application Type 2020 & 2033
- Table 6: Global Electronic Toll Collection System Market Revenue billion Forecast, by Country 2020 & 2033
- Table 7: United States Electronic Toll Collection System Market Revenue (billion) Forecast, by Application 2020 & 2033
- Table 8: Canada Electronic Toll Collection System Market Revenue (billion) Forecast, by Application 2020 & 2033
- Table 9: Mexico Electronic Toll Collection System Market Revenue (billion) Forecast, by Application 2020 & 2033
- Table 10: Global Electronic Toll Collection System Market Revenue billion Forecast, by Toll Collection Type 2020 & 2033
- Table 11: Global Electronic Toll Collection System Market Revenue billion Forecast, by Application Type 2020 & 2033
- Table 12: Global Electronic Toll Collection System Market Revenue billion Forecast, by Country 2020 & 2033
- Table 13: Germany Electronic Toll Collection System Market Revenue (billion) Forecast, by Application 2020 & 2033
- Table 14: United Kingdom Electronic Toll Collection System Market Revenue (billion) Forecast, by Application 2020 & 2033
- Table 15: France Electronic Toll Collection System Market Revenue (billion) Forecast, by Application 2020 & 2033
- Table 16: Italy Electronic Toll Collection System Market Revenue (billion) Forecast, by Application 2020 & 2033
- Table 17: Rest of Europe Electronic Toll Collection System Market Revenue (billion) Forecast, by Application 2020 & 2033
- Table 18: Global Electronic Toll Collection System Market Revenue billion Forecast, by Toll Collection Type 2020 & 2033
- Table 19: Global Electronic Toll Collection System Market Revenue billion Forecast, by Application Type 2020 & 2033
- Table 20: Global Electronic Toll Collection System Market Revenue billion Forecast, by Country 2020 & 2033
- Table 21: China Electronic Toll Collection System Market Revenue (billion) Forecast, by Application 2020 & 2033
- Table 22: Japan Electronic Toll Collection System Market Revenue (billion) Forecast, by Application 2020 & 2033
- Table 23: India Electronic Toll Collection System Market Revenue (billion) Forecast, by Application 2020 & 2033
- Table 24: South Korea Electronic Toll Collection System Market Revenue (billion) Forecast, by Application 2020 & 2033
- Table 25: Rest of Asia Pacific Electronic Toll Collection System Market Revenue (billion) Forecast, by Application 2020 & 2033
- Table 26: Global Electronic Toll Collection System Market Revenue billion Forecast, by Toll Collection Type 2020 & 2033
- Table 27: Global Electronic Toll Collection System Market Revenue billion Forecast, by Application Type 2020 & 2033
- Table 28: Global Electronic Toll Collection System Market Revenue billion Forecast, by Country 2020 & 2033
- Table 29: Brazil Electronic Toll Collection System Market Revenue (billion) Forecast, by Application 2020 & 2033
- Table 30: South Africa Electronic Toll Collection System Market Revenue (billion) Forecast, by Application 2020 & 2033
- Table 31: Other Countries Electronic Toll Collection System Market Revenue (billion) Forecast, by Application 2020 & 2033
Frequently Asked Questions
1. What is the projected Compound Annual Growth Rate (CAGR) of the Electronic Toll Collection System Market?
The projected CAGR is approximately 8.34%.
2. Which companies are prominent players in the Electronic Toll Collection System Market?
Key companies in the market include Thales Grou, Xerox Corporation, Magnetic AutoControl GmbH, TransCore Holdings Inc, Automatic Systems, Feig Electronics, TRMI Systems Integration, Siemens AG, Schneider Electric SE, Nedap NV, DENSO Corporation, Mitsubishi Heavy Industries Ltd.
3. What are the main segments of the Electronic Toll Collection System Market?
The market segments include Toll Collection Type, Application Type.
4. Can you provide details about the market size?
The market size is estimated to be USD 10.94 billion as of 2022.
5. What are some drivers contributing to market growth?
Rising Automotive Vehicle Sales Anticipated to Drive the Market.
6. What are the notable trends driving market growth?
Electronic Toll Collection is Expected to Witness the Highest Growth Rate.
7. Are there any restraints impacting market growth?
High Initial Cost Acting as Barrier for the Market.
8. Can you provide examples of recent developments in the market?
N/A
9. What pricing options are available for accessing the report?
Pricing options include single-user, multi-user, and enterprise licenses priced at USD 4750, USD 5250, and USD 8750 respectively.
10. Is the market size provided in terms of value or volume?
The market size is provided in terms of value, measured in billion.
11. Are there any specific market keywords associated with the report?
Yes, the market keyword associated with the report is "Electronic Toll Collection System Market," which aids in identifying and referencing the specific market segment covered.
12. How do I determine which pricing option suits my needs best?
The pricing options vary based on user requirements and access needs. Individual users may opt for single-user licenses, while businesses requiring broader access may choose multi-user or enterprise licenses for cost-effective access to the report.
13. Are there any additional resources or data provided in the Electronic Toll Collection System Market report?
While the report offers comprehensive insights, it's advisable to review the specific contents or supplementary materials provided to ascertain if additional resources or data are available.
14. How can I stay updated on further developments or reports in the Electronic Toll Collection System Market?
To stay informed about further developments, trends, and reports in the Electronic Toll Collection System Market, consider subscribing to industry newsletters, following relevant companies and organizations, or regularly checking reputable industry news sources and publications.
Methodology
Step 1 - Identification of Relevant Samples Size from Population Database


Step 2 - Approaches for Defining Global Market Size (Value, Volume* & Price*)

Note*: In applicable scenarios
Step 3 - Data Sources
Primary Research
- Web Analytics
- Survey Reports
- Research Institute
- Latest Research Reports
- Opinion Leaders
Secondary Research
- Annual Reports
- White Paper
- Latest Press Release
- Industry Association
- Paid Database
- Investor Presentations

Step 4 - Data Triangulation
Involves using different sources of information in order to increase the validity of a study
These sources are likely to be stakeholders in a program - participants, other researchers, program staff, other community members, and so on.
Then we put all data in single framework & apply various statistical tools to find out the dynamic on the market.
During the analysis stage, feedback from the stakeholder groups would be compared to determine areas of agreement as well as areas of divergence