

Key Insights
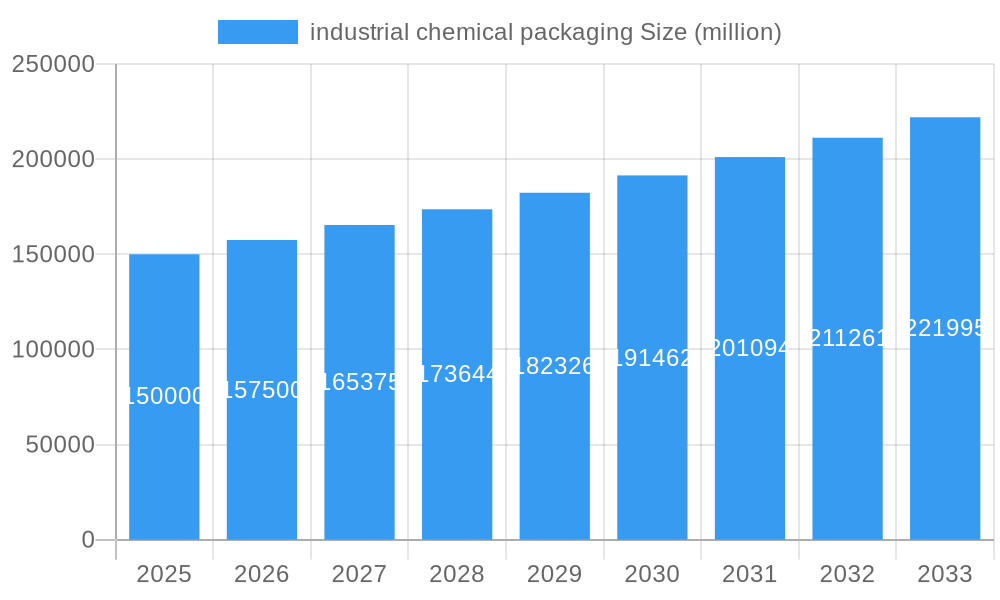
The industrial chemical packaging market is experiencing robust growth, driven by the increasing demand for chemicals across various industries, including pharmaceuticals, food and beverage, and automotive. The market's expansion is fueled by several key factors. Firstly, stringent regulations regarding chemical safety and transportation are mandating the use of specialized, high-performance packaging materials. Secondly, the growing focus on sustainability is pushing the adoption of eco-friendly packaging solutions made from recycled or biodegradable materials. This shift is creating new opportunities for innovative packaging designs and materials that minimize environmental impact. Thirdly, advancements in packaging technology, such as smart packaging incorporating sensors for real-time monitoring, are enhancing supply chain efficiency and reducing waste. Finally, the rise of e-commerce and the consequent need for secure and efficient packaging for chemical products delivered directly to consumers is significantly boosting market demand. We estimate the current market size (2025) to be approximately $150 billion, based on a reasonable projection considering growth trends in related sectors.
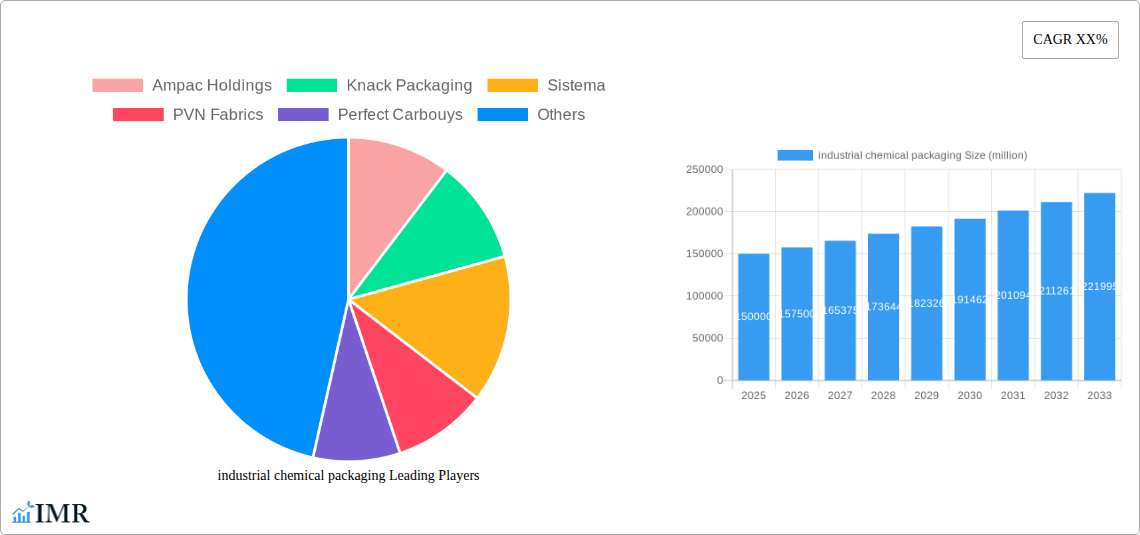
industrial chemical packaging Market Size (In Billion)
Looking ahead, the market is expected to maintain a healthy Compound Annual Growth Rate (CAGR) of around 5-7% from 2025 to 2033. This sustained growth will be influenced by the ongoing expansion of the chemical industry, technological innovations in packaging materials and designs, and the increasing emphasis on supply chain resilience and product safety. However, challenges such as fluctuating raw material prices and the need to balance cost-effectiveness with sustainability goals will continue to shape market dynamics. Companies like Ampac Holdings, Berry Global, and Sonoco Products are key players leveraging their expertise in material science and manufacturing to meet the evolving demands of the industrial chemical packaging market. Regional variations will exist, with developed economies potentially exhibiting a slightly slower growth rate compared to emerging markets where industrialization is rapidly progressing.
industrial chemical packaging Company Market Share
Industrial Chemical Packaging Market Report: 2019-2033
This comprehensive report provides a detailed analysis of the industrial chemical packaging market, offering invaluable insights for industry professionals, investors, and strategic decision-makers. Covering the period from 2019 to 2033, with a base year of 2025 and a forecast period of 2025-2033, this report leverages extensive data analysis and expert insights to deliver a complete understanding of this dynamic market. The market is segmented by packaging type (e.g., drums, IBCs, bags, flexible packaging) and by chemical type (e.g., acids, alkalis, solvents). The parent market is the broader packaging industry, while the child market includes specialized chemical packaging applications. The report projects a market size of xx million units by 2033.
Industrial Chemical Packaging Market Dynamics & Structure
The industrial chemical packaging market is characterized by moderate concentration, with a few dominant players and numerous smaller specialized companies. Technological innovation, driven by sustainability concerns and regulatory pressures, is a key driver. Stringent safety regulations and environmental mandates significantly impact packaging material selection and design. The market also sees competition from alternative packaging solutions and reusable containers. End-users span diverse industries, including chemicals, pharmaceuticals, and food processing. M&A activity has been moderate in recent years, with xx deals recorded between 2019 and 2024.
- Market Concentration: Moderately concentrated, with the top 5 players holding approximately xx% market share in 2024.
- Technological Innovation: Focus on lightweighting, improved barrier properties, and sustainable materials (e.g., bioplastics, recycled content).
- Regulatory Framework: Stringent regulations on hazardous material transportation and waste management drive innovation and compliance costs.
- Competitive Substitutes: Reusable containers and bulk transportation present competitive challenges.
- End-User Demographics: Diverse, encompassing chemical manufacturers, distributors, and end-users across various sectors.
- M&A Trends: xx M&A deals recorded between 2019 and 2024, primarily focused on consolidation and expansion into new markets.
Industrial Chemical Packaging Growth Trends & Insights
The industrial chemical packaging market has experienced steady growth over the past five years, with a CAGR of xx% between 2019 and 2024. This growth is driven by increasing industrial production, expanding chemical applications, and rising demand for safe and efficient packaging solutions. Technological advancements, such as smart packaging and improved barrier technologies, are accelerating market adoption. Consumer behavior shifts towards sustainability are also influencing material choices and packaging designs. The market penetration of sustainable packaging solutions is expected to increase from xx% in 2024 to xx% by 2033. The adoption rate of advanced packaging technologies (e.g., RFID tracking) is projected to grow at a CAGR of xx% during the forecast period.
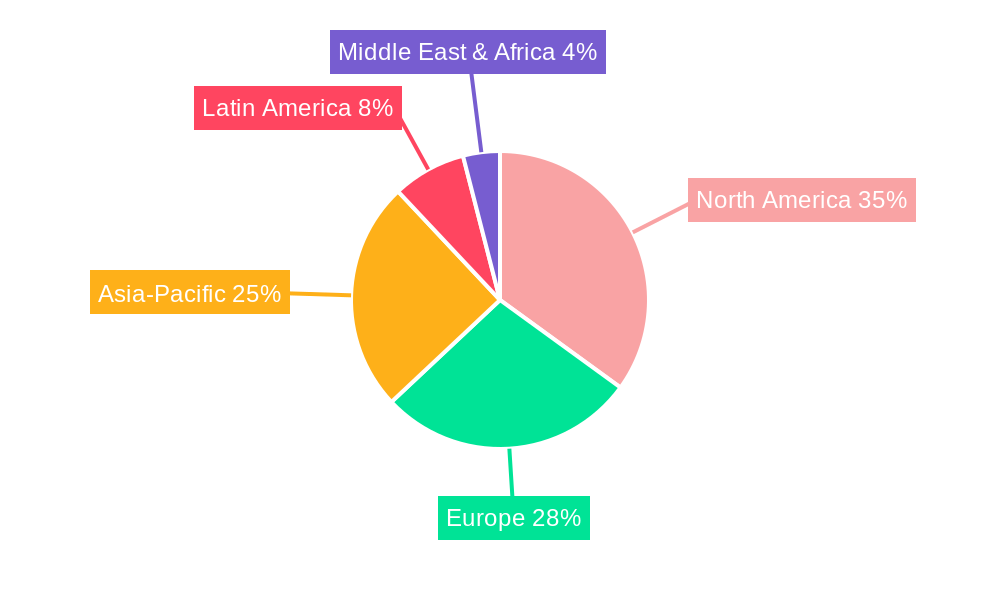
Dominant Regions, Countries, or Segments in Industrial Chemical Packaging
North America and Europe currently dominate the industrial chemical packaging market, driven by robust industrial activity and stringent environmental regulations. However, Asia-Pacific is poised for significant growth, fueled by rapid industrialization and increasing chemical production. The high-growth segment includes specialized packaging for hazardous chemicals and pharmaceuticals.
- Key Drivers in North America: Stringent environmental regulations, established chemical industry, and high demand for specialized packaging.
- Key Drivers in Europe: Similar to North America, stringent regulations and a well-established chemical industry drive growth.
- Key Drivers in Asia-Pacific: Rapid industrialization, expanding chemical manufacturing base, and rising consumer demand.
- Market Share: North America (xx%), Europe (xx%), Asia-Pacific (xx%), Rest of World (xx%) in 2024.
- Growth Potential: Asia-Pacific presents the highest growth potential due to its rapidly developing industrial sector.
Industrial Chemical Packaging Product Landscape
The industrial chemical packaging market offers a wide range of products, including drums, intermediate bulk containers (IBCs), flexible packaging (bags, liners), and specialized containers for hazardous materials. Recent innovations focus on lightweighting, improved barrier properties to prevent leakage and contamination, and incorporation of sustainable materials. These advancements enhance product safety, reduce transportation costs, and improve environmental sustainability. Key features like tamper-evident seals, RFID tags for tracking, and improved design for easier handling are adding value.
Key Drivers, Barriers & Challenges in Industrial Chemical Packaging
Key Drivers:
- Growing industrial production and chemical usage.
- Increasing demand for safe and efficient packaging solutions.
- Stringent regulatory compliance requirements.
- Advancements in packaging materials and technologies.
Challenges & Restraints:
- Fluctuating raw material prices impacting packaging costs.
- Stringent environmental regulations increasing production costs.
- Intense competition and price pressure.
- Supply chain disruptions affecting availability and delivery times. These disruptions resulted in a xx% increase in packaging costs in 2022.
Emerging Opportunities in Industrial Chemical Packaging
- Growing demand for sustainable and eco-friendly packaging solutions.
- Expanding applications of smart packaging technologies for improved traceability and supply chain management.
- Untapped potential in emerging markets with rapidly growing chemical industries.
- Increased focus on personalized packaging solutions tailored to specific customer needs.
Growth Accelerators in the Industrial Chemical Packaging Industry
Technological innovation in materials and manufacturing processes is a key growth accelerator. Strategic partnerships between packaging companies and chemical manufacturers will drive product development. Market expansion into developing economies with growing chemical sectors presents significant opportunities.
Key Players Shaping the Industrial Chemical Packaging Market
- Ampac Holdings
- Knack Packaging
- Sistema
- PVN Fabrics
- Perfect Carbouys
- Time Technoplast
- Hoover Ferguson Group
- Bway Holding
- Berlin Packaging
- DS Smith
- International Paper
- Berry Global
- Schutz Container Systems
- Sonoco Products
- Sealed Air
Notable Milestones in Industrial Chemical Packaging Sector
- 2021: Berry Global launched a new range of sustainable packaging solutions for chemicals.
- 2022: DS Smith invested in a new facility for producing recycled paperboard for chemical packaging.
- 2023: Sealed Air introduced innovative barrier film technology for enhanced chemical containment.
In-Depth Industrial Chemical Packaging Market Outlook
The industrial chemical packaging market is projected to experience sustained growth over the forecast period, driven by ongoing industrialization, technological advancements, and rising demand for sustainable packaging solutions. Strategic partnerships and investments in innovative technologies will further shape the market landscape. The market's future potential is significant, presenting considerable opportunities for companies that can adapt to changing market dynamics and deliver innovative solutions.
industrial chemical packaging Segmentation
-
1. Application
- 1.1. Pharmaceutical Industry
- 1.2. Water Treatment Industry
- 1.3. Others
-
2. Types
- 2.1. Hazardous Chemical Packaging
- 2.2. Non-hazardous Chemical Packaging
industrial chemical packaging Segmentation By Geography
-
1. North America
- 1.1. United States
- 1.2. Canada
- 1.3. Mexico
-
2. South America
- 2.1. Brazil
- 2.2. Argentina
- 2.3. Rest of South America
-
3. Europe
- 3.1. United Kingdom
- 3.2. Germany
- 3.3. France
- 3.4. Italy
- 3.5. Spain
- 3.6. Russia
- 3.7. Benelux
- 3.8. Nordics
- 3.9. Rest of Europe
-
4. Middle East & Africa
- 4.1. Turkey
- 4.2. Israel
- 4.3. GCC
- 4.4. North Africa
- 4.5. South Africa
- 4.6. Rest of Middle East & Africa
-
5. Asia Pacific
- 5.1. China
- 5.2. India
- 5.3. Japan
- 5.4. South Korea
- 5.5. ASEAN
- 5.6. Oceania
- 5.7. Rest of Asia Pacific
industrial chemical packaging Regional Market Share
Geographic Coverage of industrial chemical packaging
industrial chemical packaging REPORT HIGHLIGHTS
| Aspects | Details |
|---|---|
| Study Period | 2020-2034 |
| Base Year | 2025 |
| Estimated Year | 2026 |
| Forecast Period | 2026-2034 |
| Historical Period | 2020-2025 |
| Growth Rate | CAGR of XX% from 2020-2034 |
| Segmentation |
|
Table of Contents
- 1. Introduction
- 1.1. Research Scope
- 1.2. Market Segmentation
- 1.3. Research Methodology
- 1.4. Definitions and Assumptions
- 2. Executive Summary
- 2.1. Introduction
- 3. Market Dynamics
- 3.1. Introduction
- 3.2. Market Drivers
- 3.3. Market Restrains
- 3.4. Market Trends
- 4. Market Factor Analysis
- 4.1. Porters Five Forces
- 4.2. Supply/Value Chain
- 4.3. PESTEL analysis
- 4.4. Market Entropy
- 4.5. Patent/Trademark Analysis
- 5. Global industrial chemical packaging Analysis, Insights and Forecast, 2020-2032
- 5.1. Market Analysis, Insights and Forecast - by Application
- 5.1.1. Pharmaceutical Industry
- 5.1.2. Water Treatment Industry
- 5.1.3. Others
- 5.2. Market Analysis, Insights and Forecast - by Types
- 5.2.1. Hazardous Chemical Packaging
- 5.2.2. Non-hazardous Chemical Packaging
- 5.3. Market Analysis, Insights and Forecast - by Region
- 5.3.1. North America
- 5.3.2. South America
- 5.3.3. Europe
- 5.3.4. Middle East & Africa
- 5.3.5. Asia Pacific
- 5.1. Market Analysis, Insights and Forecast - by Application
- 6. North America industrial chemical packaging Analysis, Insights and Forecast, 2020-2032
- 6.1. Market Analysis, Insights and Forecast - by Application
- 6.1.1. Pharmaceutical Industry
- 6.1.2. Water Treatment Industry
- 6.1.3. Others
- 6.2. Market Analysis, Insights and Forecast - by Types
- 6.2.1. Hazardous Chemical Packaging
- 6.2.2. Non-hazardous Chemical Packaging
- 6.1. Market Analysis, Insights and Forecast - by Application
- 7. South America industrial chemical packaging Analysis, Insights and Forecast, 2020-2032
- 7.1. Market Analysis, Insights and Forecast - by Application
- 7.1.1. Pharmaceutical Industry
- 7.1.2. Water Treatment Industry
- 7.1.3. Others
- 7.2. Market Analysis, Insights and Forecast - by Types
- 7.2.1. Hazardous Chemical Packaging
- 7.2.2. Non-hazardous Chemical Packaging
- 7.1. Market Analysis, Insights and Forecast - by Application
- 8. Europe industrial chemical packaging Analysis, Insights and Forecast, 2020-2032
- 8.1. Market Analysis, Insights and Forecast - by Application
- 8.1.1. Pharmaceutical Industry
- 8.1.2. Water Treatment Industry
- 8.1.3. Others
- 8.2. Market Analysis, Insights and Forecast - by Types
- 8.2.1. Hazardous Chemical Packaging
- 8.2.2. Non-hazardous Chemical Packaging
- 8.1. Market Analysis, Insights and Forecast - by Application
- 9. Middle East & Africa industrial chemical packaging Analysis, Insights and Forecast, 2020-2032
- 9.1. Market Analysis, Insights and Forecast - by Application
- 9.1.1. Pharmaceutical Industry
- 9.1.2. Water Treatment Industry
- 9.1.3. Others
- 9.2. Market Analysis, Insights and Forecast - by Types
- 9.2.1. Hazardous Chemical Packaging
- 9.2.2. Non-hazardous Chemical Packaging
- 9.1. Market Analysis, Insights and Forecast - by Application
- 10. Asia Pacific industrial chemical packaging Analysis, Insights and Forecast, 2020-2032
- 10.1. Market Analysis, Insights and Forecast - by Application
- 10.1.1. Pharmaceutical Industry
- 10.1.2. Water Treatment Industry
- 10.1.3. Others
- 10.2. Market Analysis, Insights and Forecast - by Types
- 10.2.1. Hazardous Chemical Packaging
- 10.2.2. Non-hazardous Chemical Packaging
- 10.1. Market Analysis, Insights and Forecast - by Application
- 11. Competitive Analysis
- 11.1. Global Market Share Analysis 2025
- 11.2. Company Profiles
- 11.2.1 Ampac Holdings
- 11.2.1.1. Overview
- 11.2.1.2. Products
- 11.2.1.3. SWOT Analysis
- 11.2.1.4. Recent Developments
- 11.2.1.5. Financials (Based on Availability)
- 11.2.2 Knack Packaging
- 11.2.2.1. Overview
- 11.2.2.2. Products
- 11.2.2.3. SWOT Analysis
- 11.2.2.4. Recent Developments
- 11.2.2.5. Financials (Based on Availability)
- 11.2.3 Sistema
- 11.2.3.1. Overview
- 11.2.3.2. Products
- 11.2.3.3. SWOT Analysis
- 11.2.3.4. Recent Developments
- 11.2.3.5. Financials (Based on Availability)
- 11.2.4 PVN Fabrics
- 11.2.4.1. Overview
- 11.2.4.2. Products
- 11.2.4.3. SWOT Analysis
- 11.2.4.4. Recent Developments
- 11.2.4.5. Financials (Based on Availability)
- 11.2.5 Perfect Carbouys
- 11.2.5.1. Overview
- 11.2.5.2. Products
- 11.2.5.3. SWOT Analysis
- 11.2.5.4. Recent Developments
- 11.2.5.5. Financials (Based on Availability)
- 11.2.6 Time Technoplast
- 11.2.6.1. Overview
- 11.2.6.2. Products
- 11.2.6.3. SWOT Analysis
- 11.2.6.4. Recent Developments
- 11.2.6.5. Financials (Based on Availability)
- 11.2.7 Hoover Ferguson Group
- 11.2.7.1. Overview
- 11.2.7.2. Products
- 11.2.7.3. SWOT Analysis
- 11.2.7.4. Recent Developments
- 11.2.7.5. Financials (Based on Availability)
- 11.2.8 Bway Holding
- 11.2.8.1. Overview
- 11.2.8.2. Products
- 11.2.8.3. SWOT Analysis
- 11.2.8.4. Recent Developments
- 11.2.8.5. Financials (Based on Availability)
- 11.2.9 Berlin Packaging
- 11.2.9.1. Overview
- 11.2.9.2. Products
- 11.2.9.3. SWOT Analysis
- 11.2.9.4. Recent Developments
- 11.2.9.5. Financials (Based on Availability)
- 11.2.10 DS Smith
- 11.2.10.1. Overview
- 11.2.10.2. Products
- 11.2.10.3. SWOT Analysis
- 11.2.10.4. Recent Developments
- 11.2.10.5. Financials (Based on Availability)
- 11.2.11 International Paper
- 11.2.11.1. Overview
- 11.2.11.2. Products
- 11.2.11.3. SWOT Analysis
- 11.2.11.4. Recent Developments
- 11.2.11.5. Financials (Based on Availability)
- 11.2.12 Berry Global
- 11.2.12.1. Overview
- 11.2.12.2. Products
- 11.2.12.3. SWOT Analysis
- 11.2.12.4. Recent Developments
- 11.2.12.5. Financials (Based on Availability)
- 11.2.13 Schutz Container Systems
- 11.2.13.1. Overview
- 11.2.13.2. Products
- 11.2.13.3. SWOT Analysis
- 11.2.13.4. Recent Developments
- 11.2.13.5. Financials (Based on Availability)
- 11.2.14 Sonoco Products
- 11.2.14.1. Overview
- 11.2.14.2. Products
- 11.2.14.3. SWOT Analysis
- 11.2.14.4. Recent Developments
- 11.2.14.5. Financials (Based on Availability)
- 11.2.15 Sealed Air
- 11.2.15.1. Overview
- 11.2.15.2. Products
- 11.2.15.3. SWOT Analysis
- 11.2.15.4. Recent Developments
- 11.2.15.5. Financials (Based on Availability)
- 11.2.1 Ampac Holdings
List of Figures
- Figure 1: Global industrial chemical packaging Revenue Breakdown (million, %) by Region 2025 & 2033
- Figure 2: North America industrial chemical packaging Revenue (million), by Application 2025 & 2033
- Figure 3: North America industrial chemical packaging Revenue Share (%), by Application 2025 & 2033
- Figure 4: North America industrial chemical packaging Revenue (million), by Types 2025 & 2033
- Figure 5: North America industrial chemical packaging Revenue Share (%), by Types 2025 & 2033
- Figure 6: North America industrial chemical packaging Revenue (million), by Country 2025 & 2033
- Figure 7: North America industrial chemical packaging Revenue Share (%), by Country 2025 & 2033
- Figure 8: South America industrial chemical packaging Revenue (million), by Application 2025 & 2033
- Figure 9: South America industrial chemical packaging Revenue Share (%), by Application 2025 & 2033
- Figure 10: South America industrial chemical packaging Revenue (million), by Types 2025 & 2033
- Figure 11: South America industrial chemical packaging Revenue Share (%), by Types 2025 & 2033
- Figure 12: South America industrial chemical packaging Revenue (million), by Country 2025 & 2033
- Figure 13: South America industrial chemical packaging Revenue Share (%), by Country 2025 & 2033
- Figure 14: Europe industrial chemical packaging Revenue (million), by Application 2025 & 2033
- Figure 15: Europe industrial chemical packaging Revenue Share (%), by Application 2025 & 2033
- Figure 16: Europe industrial chemical packaging Revenue (million), by Types 2025 & 2033
- Figure 17: Europe industrial chemical packaging Revenue Share (%), by Types 2025 & 2033
- Figure 18: Europe industrial chemical packaging Revenue (million), by Country 2025 & 2033
- Figure 19: Europe industrial chemical packaging Revenue Share (%), by Country 2025 & 2033
- Figure 20: Middle East & Africa industrial chemical packaging Revenue (million), by Application 2025 & 2033
- Figure 21: Middle East & Africa industrial chemical packaging Revenue Share (%), by Application 2025 & 2033
- Figure 22: Middle East & Africa industrial chemical packaging Revenue (million), by Types 2025 & 2033
- Figure 23: Middle East & Africa industrial chemical packaging Revenue Share (%), by Types 2025 & 2033
- Figure 24: Middle East & Africa industrial chemical packaging Revenue (million), by Country 2025 & 2033
- Figure 25: Middle East & Africa industrial chemical packaging Revenue Share (%), by Country 2025 & 2033
- Figure 26: Asia Pacific industrial chemical packaging Revenue (million), by Application 2025 & 2033
- Figure 27: Asia Pacific industrial chemical packaging Revenue Share (%), by Application 2025 & 2033
- Figure 28: Asia Pacific industrial chemical packaging Revenue (million), by Types 2025 & 2033
- Figure 29: Asia Pacific industrial chemical packaging Revenue Share (%), by Types 2025 & 2033
- Figure 30: Asia Pacific industrial chemical packaging Revenue (million), by Country 2025 & 2033
- Figure 31: Asia Pacific industrial chemical packaging Revenue Share (%), by Country 2025 & 2033
List of Tables
- Table 1: Global industrial chemical packaging Revenue million Forecast, by Application 2020 & 2033
- Table 2: Global industrial chemical packaging Revenue million Forecast, by Types 2020 & 2033
- Table 3: Global industrial chemical packaging Revenue million Forecast, by Region 2020 & 2033
- Table 4: Global industrial chemical packaging Revenue million Forecast, by Application 2020 & 2033
- Table 5: Global industrial chemical packaging Revenue million Forecast, by Types 2020 & 2033
- Table 6: Global industrial chemical packaging Revenue million Forecast, by Country 2020 & 2033
- Table 7: United States industrial chemical packaging Revenue (million) Forecast, by Application 2020 & 2033
- Table 8: Canada industrial chemical packaging Revenue (million) Forecast, by Application 2020 & 2033
- Table 9: Mexico industrial chemical packaging Revenue (million) Forecast, by Application 2020 & 2033
- Table 10: Global industrial chemical packaging Revenue million Forecast, by Application 2020 & 2033
- Table 11: Global industrial chemical packaging Revenue million Forecast, by Types 2020 & 2033
- Table 12: Global industrial chemical packaging Revenue million Forecast, by Country 2020 & 2033
- Table 13: Brazil industrial chemical packaging Revenue (million) Forecast, by Application 2020 & 2033
- Table 14: Argentina industrial chemical packaging Revenue (million) Forecast, by Application 2020 & 2033
- Table 15: Rest of South America industrial chemical packaging Revenue (million) Forecast, by Application 2020 & 2033
- Table 16: Global industrial chemical packaging Revenue million Forecast, by Application 2020 & 2033
- Table 17: Global industrial chemical packaging Revenue million Forecast, by Types 2020 & 2033
- Table 18: Global industrial chemical packaging Revenue million Forecast, by Country 2020 & 2033
- Table 19: United Kingdom industrial chemical packaging Revenue (million) Forecast, by Application 2020 & 2033
- Table 20: Germany industrial chemical packaging Revenue (million) Forecast, by Application 2020 & 2033
- Table 21: France industrial chemical packaging Revenue (million) Forecast, by Application 2020 & 2033
- Table 22: Italy industrial chemical packaging Revenue (million) Forecast, by Application 2020 & 2033
- Table 23: Spain industrial chemical packaging Revenue (million) Forecast, by Application 2020 & 2033
- Table 24: Russia industrial chemical packaging Revenue (million) Forecast, by Application 2020 & 2033
- Table 25: Benelux industrial chemical packaging Revenue (million) Forecast, by Application 2020 & 2033
- Table 26: Nordics industrial chemical packaging Revenue (million) Forecast, by Application 2020 & 2033
- Table 27: Rest of Europe industrial chemical packaging Revenue (million) Forecast, by Application 2020 & 2033
- Table 28: Global industrial chemical packaging Revenue million Forecast, by Application 2020 & 2033
- Table 29: Global industrial chemical packaging Revenue million Forecast, by Types 2020 & 2033
- Table 30: Global industrial chemical packaging Revenue million Forecast, by Country 2020 & 2033
- Table 31: Turkey industrial chemical packaging Revenue (million) Forecast, by Application 2020 & 2033
- Table 32: Israel industrial chemical packaging Revenue (million) Forecast, by Application 2020 & 2033
- Table 33: GCC industrial chemical packaging Revenue (million) Forecast, by Application 2020 & 2033
- Table 34: North Africa industrial chemical packaging Revenue (million) Forecast, by Application 2020 & 2033
- Table 35: South Africa industrial chemical packaging Revenue (million) Forecast, by Application 2020 & 2033
- Table 36: Rest of Middle East & Africa industrial chemical packaging Revenue (million) Forecast, by Application 2020 & 2033
- Table 37: Global industrial chemical packaging Revenue million Forecast, by Application 2020 & 2033
- Table 38: Global industrial chemical packaging Revenue million Forecast, by Types 2020 & 2033
- Table 39: Global industrial chemical packaging Revenue million Forecast, by Country 2020 & 2033
- Table 40: China industrial chemical packaging Revenue (million) Forecast, by Application 2020 & 2033
- Table 41: India industrial chemical packaging Revenue (million) Forecast, by Application 2020 & 2033
- Table 42: Japan industrial chemical packaging Revenue (million) Forecast, by Application 2020 & 2033
- Table 43: South Korea industrial chemical packaging Revenue (million) Forecast, by Application 2020 & 2033
- Table 44: ASEAN industrial chemical packaging Revenue (million) Forecast, by Application 2020 & 2033
- Table 45: Oceania industrial chemical packaging Revenue (million) Forecast, by Application 2020 & 2033
- Table 46: Rest of Asia Pacific industrial chemical packaging Revenue (million) Forecast, by Application 2020 & 2033
Frequently Asked Questions
1. What is the projected Compound Annual Growth Rate (CAGR) of the industrial chemical packaging?
The projected CAGR is approximately XX%.
2. Which companies are prominent players in the industrial chemical packaging?
Key companies in the market include Ampac Holdings, Knack Packaging, Sistema, PVN Fabrics, Perfect Carbouys, Time Technoplast, Hoover Ferguson Group, Bway Holding, Berlin Packaging, DS Smith, International Paper, Berry Global, Schutz Container Systems, Sonoco Products, Sealed Air.
3. What are the main segments of the industrial chemical packaging?
The market segments include Application, Types.
4. Can you provide details about the market size?
The market size is estimated to be USD XXX million as of 2022.
5. What are some drivers contributing to market growth?
N/A
6. What are the notable trends driving market growth?
N/A
7. Are there any restraints impacting market growth?
N/A
8. Can you provide examples of recent developments in the market?
N/A
9. What pricing options are available for accessing the report?
Pricing options include single-user, multi-user, and enterprise licenses priced at USD 4350.00, USD 6525.00, and USD 8700.00 respectively.
10. Is the market size provided in terms of value or volume?
The market size is provided in terms of value, measured in million.
11. Are there any specific market keywords associated with the report?
Yes, the market keyword associated with the report is "industrial chemical packaging," which aids in identifying and referencing the specific market segment covered.
12. How do I determine which pricing option suits my needs best?
The pricing options vary based on user requirements and access needs. Individual users may opt for single-user licenses, while businesses requiring broader access may choose multi-user or enterprise licenses for cost-effective access to the report.
13. Are there any additional resources or data provided in the industrial chemical packaging report?
While the report offers comprehensive insights, it's advisable to review the specific contents or supplementary materials provided to ascertain if additional resources or data are available.
14. How can I stay updated on further developments or reports in the industrial chemical packaging?
To stay informed about further developments, trends, and reports in the industrial chemical packaging, consider subscribing to industry newsletters, following relevant companies and organizations, or regularly checking reputable industry news sources and publications.
Methodology
Step 1 - Identification of Relevant Samples Size from Population Database


Step 2 - Approaches for Defining Global Market Size (Value, Volume* & Price*)

Note*: In applicable scenarios
Step 3 - Data Sources
Primary Research
- Web Analytics
- Survey Reports
- Research Institute
- Latest Research Reports
- Opinion Leaders
Secondary Research
- Annual Reports
- White Paper
- Latest Press Release
- Industry Association
- Paid Database
- Investor Presentations

Step 4 - Data Triangulation
Involves using different sources of information in order to increase the validity of a study
These sources are likely to be stakeholders in a program - participants, other researchers, program staff, other community members, and so on.
Then we put all data in single framework & apply various statistical tools to find out the dynamic on the market.
During the analysis stage, feedback from the stakeholder groups would be compared to determine areas of agreement as well as areas of divergence