

Key Insights
The global infant formula packaging market is poised for substantial expansion, driven by increasing worldwide demand for infant nutrition. Key growth drivers include rising birth rates in emerging economies and a growing consumer preference for safe, convenient, and hygienic packaging solutions. The market is forecast to achieve a Compound Annual Growth Rate (CAGR) of 4.6% from a market size of 3.3 billion in the base year 2025. This growth is further propelled by rising disposable incomes in developing nations, leading to increased expenditure on premium infant formula brands utilizing advanced packaging. Leading manufacturers are responding with innovations in sustainable packaging, such as recyclable plastics and eco-friendly alternatives, aligning with consumer demand for environmentally responsible products.
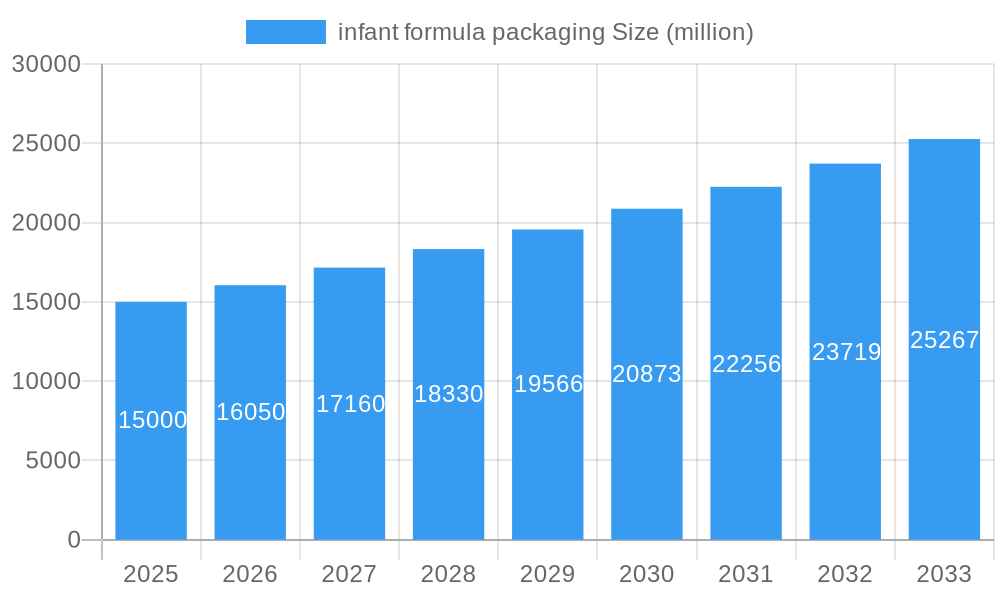
infant formula packaging Market Size (In Billion)
Despite positive growth trajectories, the market encounters challenges, including volatility in raw material prices for plastics and metals, impacting production costs. Stringent food safety and packaging material regulations also present operational complexities. Intense competition from established and new entrants necessitates continuous product development and cost-efficiency measures for sustained market leadership. Market segmentation by material (plastic, metal, composite), packaging type (cans, pouches, bottles), and distribution channels (retail, online) presents strategic opportunities for focused market penetration based on evolving consumer preferences and competitive dynamics. Future market success will depend on balancing innovation, sustainability, and effective cost management.
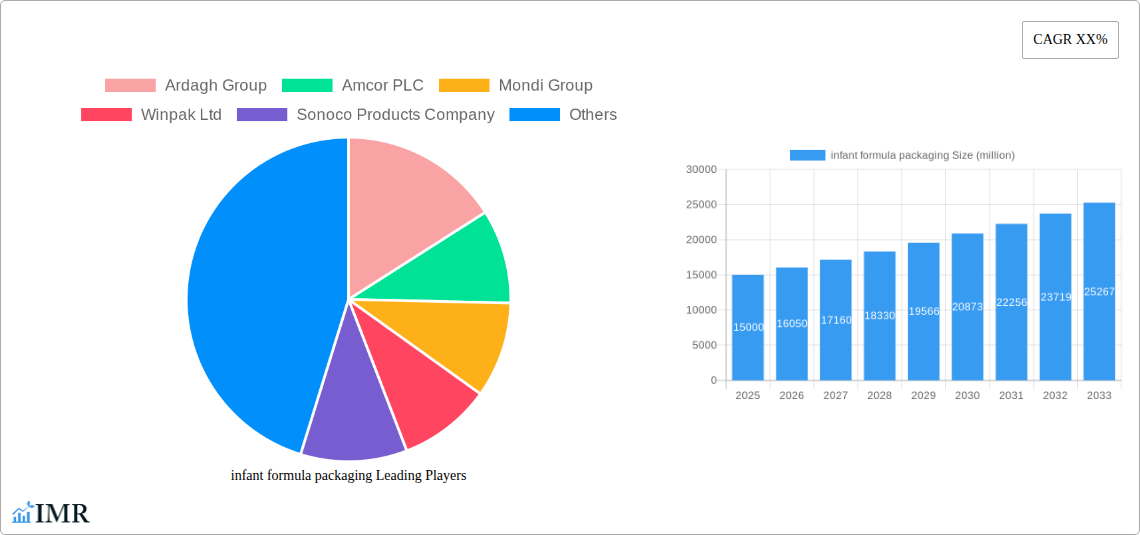
infant formula packaging Company Market Share
Infant Formula Packaging Market Report: 2019-2033
This comprehensive report provides an in-depth analysis of the infant formula packaging market, offering invaluable insights for industry professionals, investors, and parents alike. With a focus on market dynamics, growth trends, key players, and future opportunities, this report is an essential resource for navigating this dynamic sector. The report covers the period 2019-2033, with a base year of 2025. Market values are expressed in million units.
Infant Formula Packaging Market Dynamics & Structure
The infant formula packaging market is characterized by moderate concentration, with key players like Ardagh Group, Amcor PLC, Mondi Group, Winpak Ltd, Sonoco Products Company, and M.C.PACKAGING(PTE.)LIMITED vying for market share. Technological innovation, driven by the need for improved barrier properties, enhanced sustainability, and convenient dispensing, is a major growth driver. Stringent regulatory frameworks regarding food safety and material composition significantly influence packaging choices. Competition from alternative packaging materials and formats is present, but the dominance of traditional materials like cans and pouches remains strong. The market is heavily influenced by end-user demographics, with a focus on the needs of parents seeking safe, convenient, and environmentally friendly solutions. M&A activity has been relatively modest in recent years, with xx million units in deals recorded between 2019 and 2024.
- Market Concentration: Moderately concentrated, with top 6 players holding xx% market share in 2025.
- Technological Innovation: Focus on sustainable materials (e.g., recycled plastics, bioplastics), improved barrier properties, and easy-open features.
- Regulatory Landscape: Stringent regulations regarding food safety and material composition influence packaging choices.
- Competitive Substitutes: Growing competition from alternative packaging materials (e.g., flexible pouches, stand-up pouches).
- End-User Demographics: Market driven by parental preferences for convenience, safety, and sustainability.
- M&A Activity: xx million units in M&A deals (2019-2024), indicating potential for future consolidation.
Infant Formula Packaging Growth Trends & Insights
The infant formula packaging market experienced robust growth between 2019 and 2024, with a CAGR of xx%. This growth is attributed to rising birth rates in key regions, increasing disposable incomes, and a shift towards convenient and safe packaging solutions. Technological disruptions, particularly in sustainable packaging materials and smart packaging technologies, are accelerating market expansion. Changing consumer behavior, with an emphasis on eco-friendly choices, is driving demand for recyclable and compostable options. Market penetration of sustainable packaging is projected to reach xx% by 2033, driven by growing environmental awareness among parents. The market size is expected to reach xx million units by 2033.
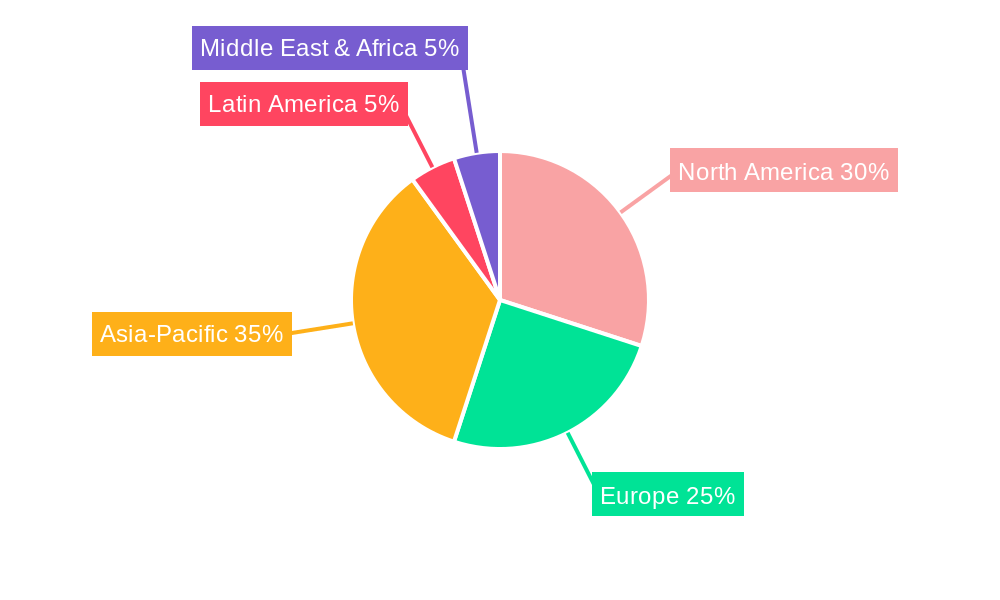
Dominant Regions, Countries, or Segments in Infant Formula Packaging
The Asia-Pacific region dominates the infant formula packaging market, driven by rapid economic growth, increasing birth rates, and rising consumer spending. China and India are key growth markets within this region. Strong government support for the infant nutrition industry and expanding retail infrastructure further contribute to regional dominance. North America also holds a significant market share, characterized by high per capita consumption and a strong focus on premium and specialized infant formula products.
- Asia-Pacific: High birth rates, rising disposable incomes, and expanding retail infrastructure are key drivers. China and India are major contributors.
- North America: High per capita consumption of infant formula and a strong focus on premium products contribute to market share.
- Europe: Mature market with a focus on sustainable and innovative packaging solutions.
Infant Formula Packaging Product Landscape
The infant formula packaging market offers a diverse range of products, including cans, pouches, bottles, and sachets. Innovation focuses on enhanced barrier properties to maintain product freshness and safety, convenient dispensing mechanisms, and sustainable materials to minimize environmental impact. Unique selling propositions include tamper-evident seals, easy-open features, and ergonomic designs for ease of use. Technological advancements encompass the incorporation of smart packaging features for enhanced traceability and product information access.
Key Drivers, Barriers & Challenges in Infant Formula Packaging
Key Drivers:
- Increasing birth rates globally.
- Growing demand for convenient and safe packaging solutions.
- Rising consumer awareness of sustainability.
- Technological advancements in packaging materials and technologies.
Challenges & Restraints:
- Fluctuations in raw material prices.
- Stringent regulatory requirements for food safety and packaging materials.
- Intense competition among packaging manufacturers.
- Supply chain disruptions impacting raw material availability and timely delivery. This has led to a xx% increase in production costs in 2024.
Emerging Opportunities in Infant Formula Packaging
Emerging opportunities lie in the development of sustainable and eco-friendly packaging solutions, including bio-based materials and compostable packaging. The growing demand for personalized and customized infant formula necessitates innovative packaging formats and designs. Untapped markets in developing economies offer significant growth potential. Expanding into e-commerce channels and direct-to-consumer sales provides new avenues for market penetration.
Growth Accelerators in the Infant Formula Packaging Industry
Technological advancements in sustainable materials, smart packaging, and efficient manufacturing processes are driving long-term growth. Strategic partnerships between packaging manufacturers and infant formula producers enhance product innovation and market penetration. Expansion into new geographical markets, particularly in developing economies with high birth rates, offers significant growth potential.
Key Players Shaping the Infant Formula Packaging Market
- Ardagh Group
- Amcor PLC
- Mondi Group
- Winpak Ltd
- Sonoco Products Company
- M.C.PACKAGING(PTE.)LIMITED
Notable Milestones in Infant Formula Packaging Sector
- 2021: Introduction of a new recyclable pouch by Amcor PLC.
- 2022: Mondi Group launches a sustainable paper-based packaging solution.
- 2023: Ardagh Group invests in a new production facility for infant formula cans.
- 2024: Sonoco Products Company announces a strategic partnership with a major infant formula producer.
In-Depth Infant Formula Packaging Market Outlook
The infant formula packaging market is poised for sustained growth over the forecast period (2025-2033), driven by several factors including the growing demand for convenient and safe packaging solutions, the increasing adoption of sustainable materials, and the continued innovation in packaging technologies. Strategic partnerships, investments in new production capacities, and expansion into new geographical markets present significant opportunities for growth and profitability. The market is expected to experience a CAGR of xx% during this period.
infant formula packaging Segmentation
-
1. Application
- 1.1. Sealing
- 1.2. Fresh-Keeping
-
2. Types
- 2.1. Spouted Pouches
- 2.2. Box with Lid
infant formula packaging Segmentation By Geography
-
1. North America
- 1.1. United States
- 1.2. Canada
- 1.3. Mexico
-
2. South America
- 2.1. Brazil
- 2.2. Argentina
- 2.3. Rest of South America
-
3. Europe
- 3.1. United Kingdom
- 3.2. Germany
- 3.3. France
- 3.4. Italy
- 3.5. Spain
- 3.6. Russia
- 3.7. Benelux
- 3.8. Nordics
- 3.9. Rest of Europe
-
4. Middle East & Africa
- 4.1. Turkey
- 4.2. Israel
- 4.3. GCC
- 4.4. North Africa
- 4.5. South Africa
- 4.6. Rest of Middle East & Africa
-
5. Asia Pacific
- 5.1. China
- 5.2. India
- 5.3. Japan
- 5.4. South Korea
- 5.5. ASEAN
- 5.6. Oceania
- 5.7. Rest of Asia Pacific
infant formula packaging Regional Market Share
Geographic Coverage of infant formula packaging
infant formula packaging REPORT HIGHLIGHTS
| Aspects | Details |
|---|---|
| Study Period | 2020-2034 |
| Base Year | 2025 |
| Estimated Year | 2026 |
| Forecast Period | 2026-2034 |
| Historical Period | 2020-2025 |
| Growth Rate | CAGR of 4.6% from 2020-2034 |
| Segmentation |
|
Table of Contents
- 1. Introduction
- 1.1. Research Scope
- 1.2. Market Segmentation
- 1.3. Research Methodology
- 1.4. Definitions and Assumptions
- 2. Executive Summary
- 2.1. Introduction
- 3. Market Dynamics
- 3.1. Introduction
- 3.2. Market Drivers
- 3.3. Market Restrains
- 3.4. Market Trends
- 4. Market Factor Analysis
- 4.1. Porters Five Forces
- 4.2. Supply/Value Chain
- 4.3. PESTEL analysis
- 4.4. Market Entropy
- 4.5. Patent/Trademark Analysis
- 5. Global infant formula packaging Analysis, Insights and Forecast, 2020-2032
- 5.1. Market Analysis, Insights and Forecast - by Application
- 5.1.1. Sealing
- 5.1.2. Fresh-Keeping
- 5.2. Market Analysis, Insights and Forecast - by Types
- 5.2.1. Spouted Pouches
- 5.2.2. Box with Lid
- 5.3. Market Analysis, Insights and Forecast - by Region
- 5.3.1. North America
- 5.3.2. South America
- 5.3.3. Europe
- 5.3.4. Middle East & Africa
- 5.3.5. Asia Pacific
- 5.1. Market Analysis, Insights and Forecast - by Application
- 6. North America infant formula packaging Analysis, Insights and Forecast, 2020-2032
- 6.1. Market Analysis, Insights and Forecast - by Application
- 6.1.1. Sealing
- 6.1.2. Fresh-Keeping
- 6.2. Market Analysis, Insights and Forecast - by Types
- 6.2.1. Spouted Pouches
- 6.2.2. Box with Lid
- 6.1. Market Analysis, Insights and Forecast - by Application
- 7. South America infant formula packaging Analysis, Insights and Forecast, 2020-2032
- 7.1. Market Analysis, Insights and Forecast - by Application
- 7.1.1. Sealing
- 7.1.2. Fresh-Keeping
- 7.2. Market Analysis, Insights and Forecast - by Types
- 7.2.1. Spouted Pouches
- 7.2.2. Box with Lid
- 7.1. Market Analysis, Insights and Forecast - by Application
- 8. Europe infant formula packaging Analysis, Insights and Forecast, 2020-2032
- 8.1. Market Analysis, Insights and Forecast - by Application
- 8.1.1. Sealing
- 8.1.2. Fresh-Keeping
- 8.2. Market Analysis, Insights and Forecast - by Types
- 8.2.1. Spouted Pouches
- 8.2.2. Box with Lid
- 8.1. Market Analysis, Insights and Forecast - by Application
- 9. Middle East & Africa infant formula packaging Analysis, Insights and Forecast, 2020-2032
- 9.1. Market Analysis, Insights and Forecast - by Application
- 9.1.1. Sealing
- 9.1.2. Fresh-Keeping
- 9.2. Market Analysis, Insights and Forecast - by Types
- 9.2.1. Spouted Pouches
- 9.2.2. Box with Lid
- 9.1. Market Analysis, Insights and Forecast - by Application
- 10. Asia Pacific infant formula packaging Analysis, Insights and Forecast, 2020-2032
- 10.1. Market Analysis, Insights and Forecast - by Application
- 10.1.1. Sealing
- 10.1.2. Fresh-Keeping
- 10.2. Market Analysis, Insights and Forecast - by Types
- 10.2.1. Spouted Pouches
- 10.2.2. Box with Lid
- 10.1. Market Analysis, Insights and Forecast - by Application
- 11. Competitive Analysis
- 11.1. Global Market Share Analysis 2025
- 11.2. Company Profiles
- 11.2.1 Ardagh Group
- 11.2.1.1. Overview
- 11.2.1.2. Products
- 11.2.1.3. SWOT Analysis
- 11.2.1.4. Recent Developments
- 11.2.1.5. Financials (Based on Availability)
- 11.2.2 Amcor PLC
- 11.2.2.1. Overview
- 11.2.2.2. Products
- 11.2.2.3. SWOT Analysis
- 11.2.2.4. Recent Developments
- 11.2.2.5. Financials (Based on Availability)
- 11.2.3 Mondi Group
- 11.2.3.1. Overview
- 11.2.3.2. Products
- 11.2.3.3. SWOT Analysis
- 11.2.3.4. Recent Developments
- 11.2.3.5. Financials (Based on Availability)
- 11.2.4 Winpak Ltd
- 11.2.4.1. Overview
- 11.2.4.2. Products
- 11.2.4.3. SWOT Analysis
- 11.2.4.4. Recent Developments
- 11.2.4.5. Financials (Based on Availability)
- 11.2.5 Sonoco Products Company
- 11.2.5.1. Overview
- 11.2.5.2. Products
- 11.2.5.3. SWOT Analysis
- 11.2.5.4. Recent Developments
- 11.2.5.5. Financials (Based on Availability)
- 11.2.6 M.C.PACKAGING(PTE.)LIMITED
- 11.2.6.1. Overview
- 11.2.6.2. Products
- 11.2.6.3. SWOT Analysis
- 11.2.6.4. Recent Developments
- 11.2.6.5. Financials (Based on Availability)
- 11.2.1 Ardagh Group
List of Figures
- Figure 1: Global infant formula packaging Revenue Breakdown (billion, %) by Region 2025 & 2033
- Figure 2: Global infant formula packaging Volume Breakdown (K, %) by Region 2025 & 2033
- Figure 3: North America infant formula packaging Revenue (billion), by Application 2025 & 2033
- Figure 4: North America infant formula packaging Volume (K), by Application 2025 & 2033
- Figure 5: North America infant formula packaging Revenue Share (%), by Application 2025 & 2033
- Figure 6: North America infant formula packaging Volume Share (%), by Application 2025 & 2033
- Figure 7: North America infant formula packaging Revenue (billion), by Types 2025 & 2033
- Figure 8: North America infant formula packaging Volume (K), by Types 2025 & 2033
- Figure 9: North America infant formula packaging Revenue Share (%), by Types 2025 & 2033
- Figure 10: North America infant formula packaging Volume Share (%), by Types 2025 & 2033
- Figure 11: North America infant formula packaging Revenue (billion), by Country 2025 & 2033
- Figure 12: North America infant formula packaging Volume (K), by Country 2025 & 2033
- Figure 13: North America infant formula packaging Revenue Share (%), by Country 2025 & 2033
- Figure 14: North America infant formula packaging Volume Share (%), by Country 2025 & 2033
- Figure 15: South America infant formula packaging Revenue (billion), by Application 2025 & 2033
- Figure 16: South America infant formula packaging Volume (K), by Application 2025 & 2033
- Figure 17: South America infant formula packaging Revenue Share (%), by Application 2025 & 2033
- Figure 18: South America infant formula packaging Volume Share (%), by Application 2025 & 2033
- Figure 19: South America infant formula packaging Revenue (billion), by Types 2025 & 2033
- Figure 20: South America infant formula packaging Volume (K), by Types 2025 & 2033
- Figure 21: South America infant formula packaging Revenue Share (%), by Types 2025 & 2033
- Figure 22: South America infant formula packaging Volume Share (%), by Types 2025 & 2033
- Figure 23: South America infant formula packaging Revenue (billion), by Country 2025 & 2033
- Figure 24: South America infant formula packaging Volume (K), by Country 2025 & 2033
- Figure 25: South America infant formula packaging Revenue Share (%), by Country 2025 & 2033
- Figure 26: South America infant formula packaging Volume Share (%), by Country 2025 & 2033
- Figure 27: Europe infant formula packaging Revenue (billion), by Application 2025 & 2033
- Figure 28: Europe infant formula packaging Volume (K), by Application 2025 & 2033
- Figure 29: Europe infant formula packaging Revenue Share (%), by Application 2025 & 2033
- Figure 30: Europe infant formula packaging Volume Share (%), by Application 2025 & 2033
- Figure 31: Europe infant formula packaging Revenue (billion), by Types 2025 & 2033
- Figure 32: Europe infant formula packaging Volume (K), by Types 2025 & 2033
- Figure 33: Europe infant formula packaging Revenue Share (%), by Types 2025 & 2033
- Figure 34: Europe infant formula packaging Volume Share (%), by Types 2025 & 2033
- Figure 35: Europe infant formula packaging Revenue (billion), by Country 2025 & 2033
- Figure 36: Europe infant formula packaging Volume (K), by Country 2025 & 2033
- Figure 37: Europe infant formula packaging Revenue Share (%), by Country 2025 & 2033
- Figure 38: Europe infant formula packaging Volume Share (%), by Country 2025 & 2033
- Figure 39: Middle East & Africa infant formula packaging Revenue (billion), by Application 2025 & 2033
- Figure 40: Middle East & Africa infant formula packaging Volume (K), by Application 2025 & 2033
- Figure 41: Middle East & Africa infant formula packaging Revenue Share (%), by Application 2025 & 2033
- Figure 42: Middle East & Africa infant formula packaging Volume Share (%), by Application 2025 & 2033
- Figure 43: Middle East & Africa infant formula packaging Revenue (billion), by Types 2025 & 2033
- Figure 44: Middle East & Africa infant formula packaging Volume (K), by Types 2025 & 2033
- Figure 45: Middle East & Africa infant formula packaging Revenue Share (%), by Types 2025 & 2033
- Figure 46: Middle East & Africa infant formula packaging Volume Share (%), by Types 2025 & 2033
- Figure 47: Middle East & Africa infant formula packaging Revenue (billion), by Country 2025 & 2033
- Figure 48: Middle East & Africa infant formula packaging Volume (K), by Country 2025 & 2033
- Figure 49: Middle East & Africa infant formula packaging Revenue Share (%), by Country 2025 & 2033
- Figure 50: Middle East & Africa infant formula packaging Volume Share (%), by Country 2025 & 2033
- Figure 51: Asia Pacific infant formula packaging Revenue (billion), by Application 2025 & 2033
- Figure 52: Asia Pacific infant formula packaging Volume (K), by Application 2025 & 2033
- Figure 53: Asia Pacific infant formula packaging Revenue Share (%), by Application 2025 & 2033
- Figure 54: Asia Pacific infant formula packaging Volume Share (%), by Application 2025 & 2033
- Figure 55: Asia Pacific infant formula packaging Revenue (billion), by Types 2025 & 2033
- Figure 56: Asia Pacific infant formula packaging Volume (K), by Types 2025 & 2033
- Figure 57: Asia Pacific infant formula packaging Revenue Share (%), by Types 2025 & 2033
- Figure 58: Asia Pacific infant formula packaging Volume Share (%), by Types 2025 & 2033
- Figure 59: Asia Pacific infant formula packaging Revenue (billion), by Country 2025 & 2033
- Figure 60: Asia Pacific infant formula packaging Volume (K), by Country 2025 & 2033
- Figure 61: Asia Pacific infant formula packaging Revenue Share (%), by Country 2025 & 2033
- Figure 62: Asia Pacific infant formula packaging Volume Share (%), by Country 2025 & 2033
List of Tables
- Table 1: Global infant formula packaging Revenue billion Forecast, by Application 2020 & 2033
- Table 2: Global infant formula packaging Volume K Forecast, by Application 2020 & 2033
- Table 3: Global infant formula packaging Revenue billion Forecast, by Types 2020 & 2033
- Table 4: Global infant formula packaging Volume K Forecast, by Types 2020 & 2033
- Table 5: Global infant formula packaging Revenue billion Forecast, by Region 2020 & 2033
- Table 6: Global infant formula packaging Volume K Forecast, by Region 2020 & 2033
- Table 7: Global infant formula packaging Revenue billion Forecast, by Application 2020 & 2033
- Table 8: Global infant formula packaging Volume K Forecast, by Application 2020 & 2033
- Table 9: Global infant formula packaging Revenue billion Forecast, by Types 2020 & 2033
- Table 10: Global infant formula packaging Volume K Forecast, by Types 2020 & 2033
- Table 11: Global infant formula packaging Revenue billion Forecast, by Country 2020 & 2033
- Table 12: Global infant formula packaging Volume K Forecast, by Country 2020 & 2033
- Table 13: United States infant formula packaging Revenue (billion) Forecast, by Application 2020 & 2033
- Table 14: United States infant formula packaging Volume (K) Forecast, by Application 2020 & 2033
- Table 15: Canada infant formula packaging Revenue (billion) Forecast, by Application 2020 & 2033
- Table 16: Canada infant formula packaging Volume (K) Forecast, by Application 2020 & 2033
- Table 17: Mexico infant formula packaging Revenue (billion) Forecast, by Application 2020 & 2033
- Table 18: Mexico infant formula packaging Volume (K) Forecast, by Application 2020 & 2033
- Table 19: Global infant formula packaging Revenue billion Forecast, by Application 2020 & 2033
- Table 20: Global infant formula packaging Volume K Forecast, by Application 2020 & 2033
- Table 21: Global infant formula packaging Revenue billion Forecast, by Types 2020 & 2033
- Table 22: Global infant formula packaging Volume K Forecast, by Types 2020 & 2033
- Table 23: Global infant formula packaging Revenue billion Forecast, by Country 2020 & 2033
- Table 24: Global infant formula packaging Volume K Forecast, by Country 2020 & 2033
- Table 25: Brazil infant formula packaging Revenue (billion) Forecast, by Application 2020 & 2033
- Table 26: Brazil infant formula packaging Volume (K) Forecast, by Application 2020 & 2033
- Table 27: Argentina infant formula packaging Revenue (billion) Forecast, by Application 2020 & 2033
- Table 28: Argentina infant formula packaging Volume (K) Forecast, by Application 2020 & 2033
- Table 29: Rest of South America infant formula packaging Revenue (billion) Forecast, by Application 2020 & 2033
- Table 30: Rest of South America infant formula packaging Volume (K) Forecast, by Application 2020 & 2033
- Table 31: Global infant formula packaging Revenue billion Forecast, by Application 2020 & 2033
- Table 32: Global infant formula packaging Volume K Forecast, by Application 2020 & 2033
- Table 33: Global infant formula packaging Revenue billion Forecast, by Types 2020 & 2033
- Table 34: Global infant formula packaging Volume K Forecast, by Types 2020 & 2033
- Table 35: Global infant formula packaging Revenue billion Forecast, by Country 2020 & 2033
- Table 36: Global infant formula packaging Volume K Forecast, by Country 2020 & 2033
- Table 37: United Kingdom infant formula packaging Revenue (billion) Forecast, by Application 2020 & 2033
- Table 38: United Kingdom infant formula packaging Volume (K) Forecast, by Application 2020 & 2033
- Table 39: Germany infant formula packaging Revenue (billion) Forecast, by Application 2020 & 2033
- Table 40: Germany infant formula packaging Volume (K) Forecast, by Application 2020 & 2033
- Table 41: France infant formula packaging Revenue (billion) Forecast, by Application 2020 & 2033
- Table 42: France infant formula packaging Volume (K) Forecast, by Application 2020 & 2033
- Table 43: Italy infant formula packaging Revenue (billion) Forecast, by Application 2020 & 2033
- Table 44: Italy infant formula packaging Volume (K) Forecast, by Application 2020 & 2033
- Table 45: Spain infant formula packaging Revenue (billion) Forecast, by Application 2020 & 2033
- Table 46: Spain infant formula packaging Volume (K) Forecast, by Application 2020 & 2033
- Table 47: Russia infant formula packaging Revenue (billion) Forecast, by Application 2020 & 2033
- Table 48: Russia infant formula packaging Volume (K) Forecast, by Application 2020 & 2033
- Table 49: Benelux infant formula packaging Revenue (billion) Forecast, by Application 2020 & 2033
- Table 50: Benelux infant formula packaging Volume (K) Forecast, by Application 2020 & 2033
- Table 51: Nordics infant formula packaging Revenue (billion) Forecast, by Application 2020 & 2033
- Table 52: Nordics infant formula packaging Volume (K) Forecast, by Application 2020 & 2033
- Table 53: Rest of Europe infant formula packaging Revenue (billion) Forecast, by Application 2020 & 2033
- Table 54: Rest of Europe infant formula packaging Volume (K) Forecast, by Application 2020 & 2033
- Table 55: Global infant formula packaging Revenue billion Forecast, by Application 2020 & 2033
- Table 56: Global infant formula packaging Volume K Forecast, by Application 2020 & 2033
- Table 57: Global infant formula packaging Revenue billion Forecast, by Types 2020 & 2033
- Table 58: Global infant formula packaging Volume K Forecast, by Types 2020 & 2033
- Table 59: Global infant formula packaging Revenue billion Forecast, by Country 2020 & 2033
- Table 60: Global infant formula packaging Volume K Forecast, by Country 2020 & 2033
- Table 61: Turkey infant formula packaging Revenue (billion) Forecast, by Application 2020 & 2033
- Table 62: Turkey infant formula packaging Volume (K) Forecast, by Application 2020 & 2033
- Table 63: Israel infant formula packaging Revenue (billion) Forecast, by Application 2020 & 2033
- Table 64: Israel infant formula packaging Volume (K) Forecast, by Application 2020 & 2033
- Table 65: GCC infant formula packaging Revenue (billion) Forecast, by Application 2020 & 2033
- Table 66: GCC infant formula packaging Volume (K) Forecast, by Application 2020 & 2033
- Table 67: North Africa infant formula packaging Revenue (billion) Forecast, by Application 2020 & 2033
- Table 68: North Africa infant formula packaging Volume (K) Forecast, by Application 2020 & 2033
- Table 69: South Africa infant formula packaging Revenue (billion) Forecast, by Application 2020 & 2033
- Table 70: South Africa infant formula packaging Volume (K) Forecast, by Application 2020 & 2033
- Table 71: Rest of Middle East & Africa infant formula packaging Revenue (billion) Forecast, by Application 2020 & 2033
- Table 72: Rest of Middle East & Africa infant formula packaging Volume (K) Forecast, by Application 2020 & 2033
- Table 73: Global infant formula packaging Revenue billion Forecast, by Application 2020 & 2033
- Table 74: Global infant formula packaging Volume K Forecast, by Application 2020 & 2033
- Table 75: Global infant formula packaging Revenue billion Forecast, by Types 2020 & 2033
- Table 76: Global infant formula packaging Volume K Forecast, by Types 2020 & 2033
- Table 77: Global infant formula packaging Revenue billion Forecast, by Country 2020 & 2033
- Table 78: Global infant formula packaging Volume K Forecast, by Country 2020 & 2033
- Table 79: China infant formula packaging Revenue (billion) Forecast, by Application 2020 & 2033
- Table 80: China infant formula packaging Volume (K) Forecast, by Application 2020 & 2033
- Table 81: India infant formula packaging Revenue (billion) Forecast, by Application 2020 & 2033
- Table 82: India infant formula packaging Volume (K) Forecast, by Application 2020 & 2033
- Table 83: Japan infant formula packaging Revenue (billion) Forecast, by Application 2020 & 2033
- Table 84: Japan infant formula packaging Volume (K) Forecast, by Application 2020 & 2033
- Table 85: South Korea infant formula packaging Revenue (billion) Forecast, by Application 2020 & 2033
- Table 86: South Korea infant formula packaging Volume (K) Forecast, by Application 2020 & 2033
- Table 87: ASEAN infant formula packaging Revenue (billion) Forecast, by Application 2020 & 2033
- Table 88: ASEAN infant formula packaging Volume (K) Forecast, by Application 2020 & 2033
- Table 89: Oceania infant formula packaging Revenue (billion) Forecast, by Application 2020 & 2033
- Table 90: Oceania infant formula packaging Volume (K) Forecast, by Application 2020 & 2033
- Table 91: Rest of Asia Pacific infant formula packaging Revenue (billion) Forecast, by Application 2020 & 2033
- Table 92: Rest of Asia Pacific infant formula packaging Volume (K) Forecast, by Application 2020 & 2033
Frequently Asked Questions
1. What is the projected Compound Annual Growth Rate (CAGR) of the infant formula packaging?
The projected CAGR is approximately 4.6%.
2. Which companies are prominent players in the infant formula packaging?
Key companies in the market include Ardagh Group, Amcor PLC, Mondi Group, Winpak Ltd, Sonoco Products Company, M.C.PACKAGING(PTE.)LIMITED.
3. What are the main segments of the infant formula packaging?
The market segments include Application, Types.
4. Can you provide details about the market size?
The market size is estimated to be USD 3.3 billion as of 2022.
5. What are some drivers contributing to market growth?
N/A
6. What are the notable trends driving market growth?
N/A
7. Are there any restraints impacting market growth?
N/A
8. Can you provide examples of recent developments in the market?
N/A
9. What pricing options are available for accessing the report?
Pricing options include single-user, multi-user, and enterprise licenses priced at USD 4350.00, USD 6525.00, and USD 8700.00 respectively.
10. Is the market size provided in terms of value or volume?
The market size is provided in terms of value, measured in billion and volume, measured in K.
11. Are there any specific market keywords associated with the report?
Yes, the market keyword associated with the report is "infant formula packaging," which aids in identifying and referencing the specific market segment covered.
12. How do I determine which pricing option suits my needs best?
The pricing options vary based on user requirements and access needs. Individual users may opt for single-user licenses, while businesses requiring broader access may choose multi-user or enterprise licenses for cost-effective access to the report.
13. Are there any additional resources or data provided in the infant formula packaging report?
While the report offers comprehensive insights, it's advisable to review the specific contents or supplementary materials provided to ascertain if additional resources or data are available.
14. How can I stay updated on further developments or reports in the infant formula packaging?
To stay informed about further developments, trends, and reports in the infant formula packaging, consider subscribing to industry newsletters, following relevant companies and organizations, or regularly checking reputable industry news sources and publications.
Methodology
Step 1 - Identification of Relevant Samples Size from Population Database


Step 2 - Approaches for Defining Global Market Size (Value, Volume* & Price*)

Note*: In applicable scenarios
Step 3 - Data Sources
Primary Research
- Web Analytics
- Survey Reports
- Research Institute
- Latest Research Reports
- Opinion Leaders
Secondary Research
- Annual Reports
- White Paper
- Latest Press Release
- Industry Association
- Paid Database
- Investor Presentations

Step 4 - Data Triangulation
Involves using different sources of information in order to increase the validity of a study
These sources are likely to be stakeholders in a program - participants, other researchers, program staff, other community members, and so on.
Then we put all data in single framework & apply various statistical tools to find out the dynamic on the market.
During the analysis stage, feedback from the stakeholder groups would be compared to determine areas of agreement as well as areas of divergence