

Key Insights
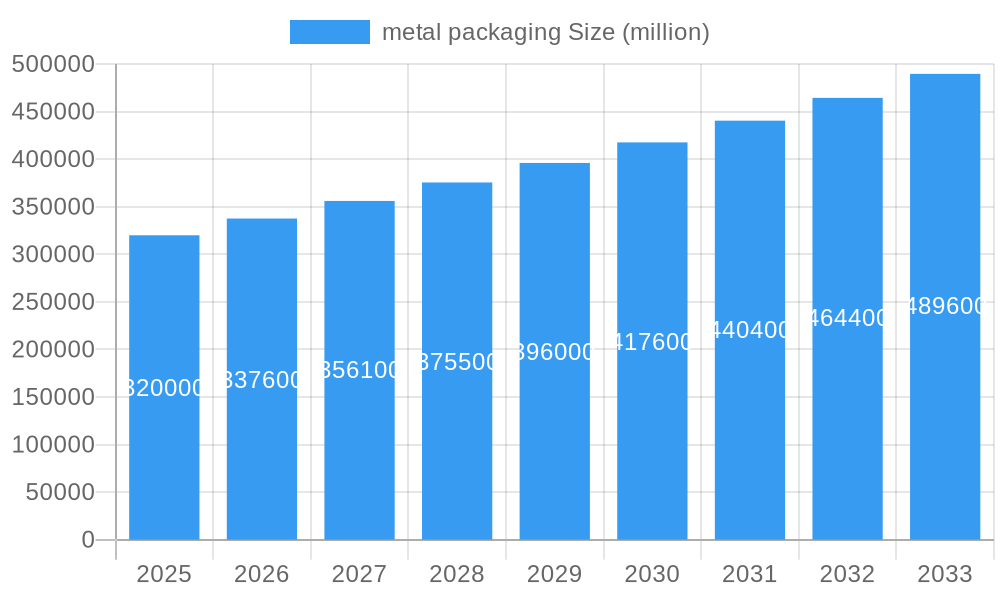
The global metal packaging market is poised for robust expansion, projected to reach a substantial market size of approximately \$320 billion by 2025, with a projected Compound Annual Growth Rate (CAGR) of 5.5% through 2033. This growth is primarily propelled by the enduring appeal of metal for its durability, recyclability, and premium aesthetic, making it a preferred choice across diverse applications. Food and beverage packaging continue to dominate the market, driven by increasing consumer demand for convenience and shelf-stable products. The personal care sector is also witnessing significant adoption of metal packaging, as brands leverage its eco-friendly attributes to appeal to environmentally conscious consumers. Furthermore, the industrial packaging segment is benefiting from the need for robust containment solutions for various goods. Key market drivers include a growing emphasis on sustainability and the circular economy, with metal's high recyclability rate making it an attractive alternative to plastics. Technological advancements in manufacturing, leading to lighter and more efficient metal packaging, are also contributing to market growth.
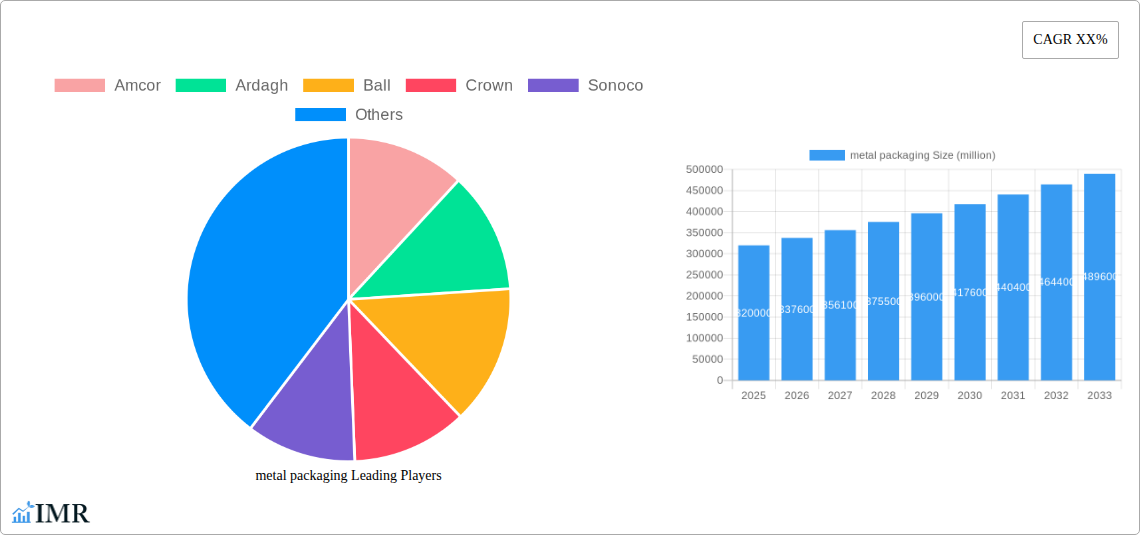
metal packaging Market Size (In Billion)
Despite the positive outlook, certain factors could temper the market's ascent. Fluctuations in raw material prices, particularly aluminum and steel, can impact production costs and subsequently influence pricing strategies. Stringent environmental regulations in some regions, while generally favoring metal, can also introduce compliance costs for manufacturers. However, the overarching trend towards sustainable consumption patterns, coupled with ongoing innovation in metal packaging design and functionality, is expected to outweigh these restraints. The market is characterized by intense competition among a wide array of players, from global giants like Amcor and Ball Corporation to specialized regional manufacturers. Strategic collaborations, mergers, and acquisitions are likely to shape the competitive landscape as companies seek to expand their product portfolios and geographical reach. The Asia Pacific region, particularly China and India, is emerging as a significant growth engine due to rapid industrialization and a burgeoning middle class.
metal packaging Company Market Share
Metal Packaging Market Report: Trends, Opportunities, and Key Players (2019-2033)
This comprehensive report delves into the global metal packaging market, providing an in-depth analysis of its dynamics, growth trajectory, and future outlook. Covering the period from 2019 to 2033, with a base year of 2025, this report offers actionable insights for industry professionals, investors, and stakeholders seeking to navigate this evolving sector.
Metal Packaging Market Dynamics & Structure
The global metal packaging market exhibits a moderate to high degree of market concentration, driven by the significant presence of large multinational corporations and strategic consolidations. Technological innovation is a primary driver, with advancements in material science, coating technologies, and sustainable manufacturing processes continually shaping product offerings. Regulatory frameworks, particularly those focused on environmental sustainability, recycling initiatives, and food safety, play a crucial role in dictating market access and product development. Competitive product substitutes, such as flexible packaging, glass, and advanced plastics, present a constant challenge, necessitating continuous innovation and value proposition enhancement in metal packaging solutions. End-user demographics are shifting, with increasing demand for convenient, durable, and eco-friendly packaging options across various applications. Mergers and acquisitions (M&A) trends are a significant feature, with key players actively consolidating their market positions, expanding their geographical reach, and acquiring innovative technologies.
- Market Concentration: Dominated by key players, with a trend towards consolidation.
- Technological Innovation: Focus on enhanced barrier properties, lightweighting, and recyclability.
- Regulatory Frameworks: Emphasis on sustainability, recycled content, and extended producer responsibility.
- Competitive Substitutes: Continuous pressure from flexible packaging and advanced composite materials.
- End-User Demographics: Growing demand for premium, sustainable, and convenient packaging.
- M&A Trends: Active consolidation and strategic acquisitions for market share and technological advancement. Example M&A deal volume: 75 deals estimated in 2023.
Metal Packaging Growth Trends & Insights
The global metal packaging market is poised for robust growth, driven by an escalating demand for sustainable and high-performance packaging solutions. The market size is projected to expand from USD 135,600 million in 2019 to an estimated USD 180,500 million by 2033, exhibiting a Compound Annual Growth Rate (CAGR) of approximately 2.5%. This growth is underpinned by increasing consumer awareness regarding the environmental impact of packaging materials, leading to a preference for infinitely recyclable options like aluminum and steel. Technological disruptions, including advancements in can manufacturing efficiency and the development of novel coatings, are further enhancing the appeal of metal packaging. Consumer behavior shifts, such as the rise of on-the-go consumption and the demand for shelf-stable products, also contribute significantly to market expansion. The adoption rates for metal packaging are particularly high in emerging economies, fueled by growing disposable incomes and urbanization.
- Market Size Evolution: Projected to grow from USD 135,600 million (2019) to USD 180,500 million (2033).
- CAGR: Estimated at 2.5% over the forecast period.
- Adoption Rates: Increasing, especially in emerging markets due to sustainability focus and convenience.
- Technological Disruptions: Innovations in can design, lightweighting, and barrier technologies are enhancing performance and appeal.
- Consumer Behavior Shifts: Growing preference for durable, recyclable, and premium packaging.
- Market Penetration: Strong penetration in food and beverage sectors, with expanding applications in personal care and industrial segments.
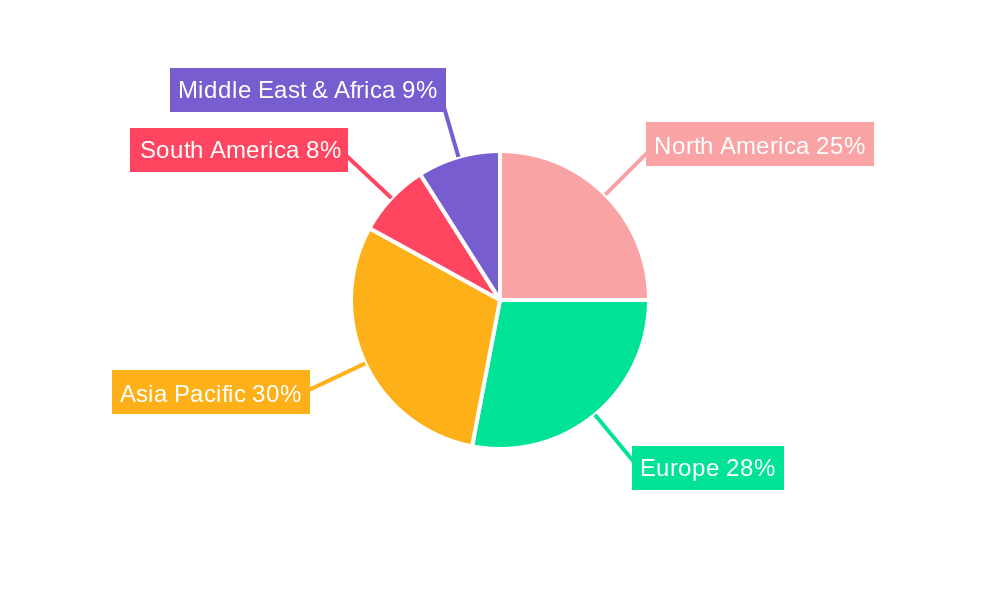
Dominant Regions, Countries, or Segments in Metal Packaging
The Beverage Packaging segment, particularly for carbonated soft drinks and beers, is a dominant force in the global metal packaging market, driven by the widespread adoption of aluminum cans. This segment is projected to account for approximately 45% of the total market share in 2025. North America and Europe currently lead in terms of market size and consumption, owing to established beverage industries, high consumer purchasing power, and strong recycling infrastructures. However, the Asia-Pacific region is emerging as a significant growth engine, fueled by rapid industrialization, a burgeoning middle class, and increasing demand for canned beverages.
- Dominant Segment: Beverage Packaging, particularly aluminum cans for carbonated drinks and beer.
- Market Share (Beverage Packaging): Estimated at 45% of the total market in 2025.
- Leading Regions: North America and Europe due to mature beverage industries and advanced recycling.
- Growth Engine Region: Asia-Pacific, driven by economic growth and increasing beverage consumption.
- Key Drivers in Dominance:
- Aluminum Cans: Superior recyclability, lightweight, and excellent barrier properties.
- Convenience: Portability and rapid cooling capabilities for beverages.
- Brand Appeal: Premium perception and effective branding opportunities.
- Economic Policies: Favorable trade policies and investment in manufacturing infrastructure in leading regions.
- Consumer Preferences: Growing demand for ready-to-drink beverages and single-serving formats.
- Growth Potential in Other Segments:
- Food Packaging: Continued growth driven by demand for convenience and shelf-stable products.
- Industrial Packaging: Stable demand for aerosols and lubricants.
- Personal Care Packaging: Expanding use in beauty and grooming products.
Metal Packaging Product Landscape
The metal packaging product landscape is characterized by continuous innovation focused on enhancing sustainability, functionality, and aesthetics. Aluminum packaging, particularly cans and foils, dominates due to its lightweight nature and infinite recyclability, finding extensive applications in beverage and food preservation. Steel packaging, often used for larger containers like drums and pails, offers robust protection for industrial goods, chemicals, and certain food products. Product innovations include advanced interior and exterior coatings that improve product integrity and shelf life, lightweighting techniques that reduce material consumption and transportation costs, and the development of easy-open features for enhanced consumer convenience. Performance metrics such as barrier properties against light, oxygen, and moisture, along with durability and structural integrity, remain critical selling points for metal packaging solutions.
Key Drivers, Barriers & Challenges in Metal Packaging
The metal packaging industry is propelled by several key drivers. Foremost is the growing global emphasis on sustainability and circular economy principles, with aluminum and steel being highly recyclable materials. Durability and protection offered by metal containers are crucial for preserving product quality, especially for food and beverages. The convenience factor, including portability and rapid cooling of canned beverages, appeals to modern lifestyles. Technological advancements in manufacturing processes and material science are also significant accelerators.
However, the market faces notable barriers and challenges. Volatility in raw material prices, particularly for aluminum and steel, can impact profitability. Competition from alternative packaging materials, such as flexible films and advanced plastics, presents a constant threat. Energy-intensive production processes and associated environmental concerns require continuous investment in cleaner technologies. Furthermore, evolving regulatory landscapes concerning recycling and waste management can impose compliance burdens. Supply chain disruptions and geopolitical factors can also affect raw material availability and cost.
Emerging Opportunities in Metal Packaging
Emerging opportunities in the metal packaging sector lie in the expanding use of aluminum and steel in innovative applications beyond traditional food and beverage. This includes the growing demand for metal packaging in the personal care and cosmetics industry, particularly for sustainable and premium product presentations. The rise of ready-to-drink (RTD) alcoholic and non-alcoholic beverages continues to fuel demand for aluminum cans. Furthermore, advancements in smart packaging technologies, such as embedded sensors or interactive elements, offer potential for enhanced traceability and consumer engagement. The increasing focus on refillable and reusable metal packaging solutions also presents a significant growth avenue, aligning with evolving consumer preferences for a circular economy.
Growth Accelerators in the Metal Packaging Industry
Several catalysts are accelerating long-term growth in the metal packaging industry. Continued advancements in recycling technologies and infrastructure globally will further enhance the sustainability credentials of metal. Strategic partnerships between packaging manufacturers and consumer goods companies are fostering co-innovation and the development of tailored packaging solutions. Market expansion into developing economies, driven by rising disposable incomes and urbanization, presents significant untapped potential. Investment in lightweighting technologies reduces material costs and environmental impact, making metal packaging more competitive. The increasing preference for premium and aesthetically pleasing packaging also benefits metal, which offers excellent printability and perceived value.
Key Players Shaping the Metal Packaging Market
- Amcor
- Ardagh
- Ball Corporation
- Crown
- Sonoco
- CPMC
- Greif
- Silgan
- Bway
- Toyo Seikan Kaisha
- Huber Packaging
- Kian Joo Group
- JL Clark
- Avon Crowncaps & Containers
- UnitedCan Company
- Macbey
- William Say
- Can Pack Group
- Tata Steel
Notable Milestones in Metal Packaging Sector
- 2019: Increased focus on lightweight aluminum can production to reduce material usage.
- 2020: Growing adoption of tinplate cans for shelf-stable food products amid global supply chain disruptions.
- 2021: Significant investment in advanced recycling technologies for aluminum and steel packaging.
- 2022: Launch of new decorative printing techniques for enhanced brand appeal on metal cans.
- 2023: Greater emphasis on Extended Producer Responsibility (EPR) schemes influencing packaging design and material choices.
- 2024: Development of enhanced barrier coatings for metal packaging to extend product shelf life.
In-Depth Metal Packaging Market Outlook
The future outlook for the metal packaging market remains exceptionally positive, driven by its inherent sustainability and performance advantages. Key growth accelerators, including enhanced recycling rates, continuous technological innovation in lightweighting and material science, and expansion into emerging markets, will sustain robust demand. Strategic collaborations and the development of innovative applications, particularly in the personal care and industrial sectors, will further diversify revenue streams. The market is well-positioned to capitalize on the global shift towards a circular economy, solidifying metal packaging's role as a preferred choice for environmentally conscious brands and consumers alike.
metal packaging Segmentation
-
1. Application
- 1.1. Food Packaging
- 1.2. Beverage Packaging
- 1.3. Personal Care Packaging
- 1.4. Industrial Packaging
-
2. Types
- 2.1. Aluminium Packaging
- 2.2. Steel Packaging
metal packaging Segmentation By Geography
-
1. North America
- 1.1. United States
- 1.2. Canada
- 1.3. Mexico
-
2. South America
- 2.1. Brazil
- 2.2. Argentina
- 2.3. Rest of South America
-
3. Europe
- 3.1. United Kingdom
- 3.2. Germany
- 3.3. France
- 3.4. Italy
- 3.5. Spain
- 3.6. Russia
- 3.7. Benelux
- 3.8. Nordics
- 3.9. Rest of Europe
-
4. Middle East & Africa
- 4.1. Turkey
- 4.2. Israel
- 4.3. GCC
- 4.4. North Africa
- 4.5. South Africa
- 4.6. Rest of Middle East & Africa
-
5. Asia Pacific
- 5.1. China
- 5.2. India
- 5.3. Japan
- 5.4. South Korea
- 5.5. ASEAN
- 5.6. Oceania
- 5.7. Rest of Asia Pacific
metal packaging Regional Market Share
Geographic Coverage of metal packaging
metal packaging REPORT HIGHLIGHTS
| Aspects | Details |
|---|---|
| Study Period | 2020-2034 |
| Base Year | 2025 |
| Estimated Year | 2026 |
| Forecast Period | 2026-2034 |
| Historical Period | 2020-2025 |
| Growth Rate | CAGR of XX% from 2020-2034 |
| Segmentation |
|
Table of Contents
- 1. Introduction
- 1.1. Research Scope
- 1.2. Market Segmentation
- 1.3. Research Methodology
- 1.4. Definitions and Assumptions
- 2. Executive Summary
- 2.1. Introduction
- 3. Market Dynamics
- 3.1. Introduction
- 3.2. Market Drivers
- 3.3. Market Restrains
- 3.4. Market Trends
- 4. Market Factor Analysis
- 4.1. Porters Five Forces
- 4.2. Supply/Value Chain
- 4.3. PESTEL analysis
- 4.4. Market Entropy
- 4.5. Patent/Trademark Analysis
- 5. Global metal packaging Analysis, Insights and Forecast, 2020-2032
- 5.1. Market Analysis, Insights and Forecast - by Application
- 5.1.1. Food Packaging
- 5.1.2. Beverage Packaging
- 5.1.3. Personal Care Packaging
- 5.1.4. Industrial Packaging
- 5.2. Market Analysis, Insights and Forecast - by Types
- 5.2.1. Aluminium Packaging
- 5.2.2. Steel Packaging
- 5.3. Market Analysis, Insights and Forecast - by Region
- 5.3.1. North America
- 5.3.2. South America
- 5.3.3. Europe
- 5.3.4. Middle East & Africa
- 5.3.5. Asia Pacific
- 5.1. Market Analysis, Insights and Forecast - by Application
- 6. North America metal packaging Analysis, Insights and Forecast, 2020-2032
- 6.1. Market Analysis, Insights and Forecast - by Application
- 6.1.1. Food Packaging
- 6.1.2. Beverage Packaging
- 6.1.3. Personal Care Packaging
- 6.1.4. Industrial Packaging
- 6.2. Market Analysis, Insights and Forecast - by Types
- 6.2.1. Aluminium Packaging
- 6.2.2. Steel Packaging
- 6.1. Market Analysis, Insights and Forecast - by Application
- 7. South America metal packaging Analysis, Insights and Forecast, 2020-2032
- 7.1. Market Analysis, Insights and Forecast - by Application
- 7.1.1. Food Packaging
- 7.1.2. Beverage Packaging
- 7.1.3. Personal Care Packaging
- 7.1.4. Industrial Packaging
- 7.2. Market Analysis, Insights and Forecast - by Types
- 7.2.1. Aluminium Packaging
- 7.2.2. Steel Packaging
- 7.1. Market Analysis, Insights and Forecast - by Application
- 8. Europe metal packaging Analysis, Insights and Forecast, 2020-2032
- 8.1. Market Analysis, Insights and Forecast - by Application
- 8.1.1. Food Packaging
- 8.1.2. Beverage Packaging
- 8.1.3. Personal Care Packaging
- 8.1.4. Industrial Packaging
- 8.2. Market Analysis, Insights and Forecast - by Types
- 8.2.1. Aluminium Packaging
- 8.2.2. Steel Packaging
- 8.1. Market Analysis, Insights and Forecast - by Application
- 9. Middle East & Africa metal packaging Analysis, Insights and Forecast, 2020-2032
- 9.1. Market Analysis, Insights and Forecast - by Application
- 9.1.1. Food Packaging
- 9.1.2. Beverage Packaging
- 9.1.3. Personal Care Packaging
- 9.1.4. Industrial Packaging
- 9.2. Market Analysis, Insights and Forecast - by Types
- 9.2.1. Aluminium Packaging
- 9.2.2. Steel Packaging
- 9.1. Market Analysis, Insights and Forecast - by Application
- 10. Asia Pacific metal packaging Analysis, Insights and Forecast, 2020-2032
- 10.1. Market Analysis, Insights and Forecast - by Application
- 10.1.1. Food Packaging
- 10.1.2. Beverage Packaging
- 10.1.3. Personal Care Packaging
- 10.1.4. Industrial Packaging
- 10.2. Market Analysis, Insights and Forecast - by Types
- 10.2.1. Aluminium Packaging
- 10.2.2. Steel Packaging
- 10.1. Market Analysis, Insights and Forecast - by Application
- 11. Competitive Analysis
- 11.1. Global Market Share Analysis 2025
- 11.2. Company Profiles
- 11.2.1 Amcor
- 11.2.1.1. Overview
- 11.2.1.2. Products
- 11.2.1.3. SWOT Analysis
- 11.2.1.4. Recent Developments
- 11.2.1.5. Financials (Based on Availability)
- 11.2.2 Ardagh
- 11.2.2.1. Overview
- 11.2.2.2. Products
- 11.2.2.3. SWOT Analysis
- 11.2.2.4. Recent Developments
- 11.2.2.5. Financials (Based on Availability)
- 11.2.3 Ball
- 11.2.3.1. Overview
- 11.2.3.2. Products
- 11.2.3.3. SWOT Analysis
- 11.2.3.4. Recent Developments
- 11.2.3.5. Financials (Based on Availability)
- 11.2.4 Crown
- 11.2.4.1. Overview
- 11.2.4.2. Products
- 11.2.4.3. SWOT Analysis
- 11.2.4.4. Recent Developments
- 11.2.4.5. Financials (Based on Availability)
- 11.2.5 Sonoco
- 11.2.5.1. Overview
- 11.2.5.2. Products
- 11.2.5.3. SWOT Analysis
- 11.2.5.4. Recent Developments
- 11.2.5.5. Financials (Based on Availability)
- 11.2.6 CPMC
- 11.2.6.1. Overview
- 11.2.6.2. Products
- 11.2.6.3. SWOT Analysis
- 11.2.6.4. Recent Developments
- 11.2.6.5. Financials (Based on Availability)
- 11.2.7 Greif
- 11.2.7.1. Overview
- 11.2.7.2. Products
- 11.2.7.3. SWOT Analysis
- 11.2.7.4. Recent Developments
- 11.2.7.5. Financials (Based on Availability)
- 11.2.8 Ball Corporation
- 11.2.8.1. Overview
- 11.2.8.2. Products
- 11.2.8.3. SWOT Analysis
- 11.2.8.4. Recent Developments
- 11.2.8.5. Financials (Based on Availability)
- 11.2.9 Silgan
- 11.2.9.1. Overview
- 11.2.9.2. Products
- 11.2.9.3. SWOT Analysis
- 11.2.9.4. Recent Developments
- 11.2.9.5. Financials (Based on Availability)
- 11.2.10 Bway
- 11.2.10.1. Overview
- 11.2.10.2. Products
- 11.2.10.3. SWOT Analysis
- 11.2.10.4. Recent Developments
- 11.2.10.5. Financials (Based on Availability)
- 11.2.11 Toyo Seikan Kaisha
- 11.2.11.1. Overview
- 11.2.11.2. Products
- 11.2.11.3. SWOT Analysis
- 11.2.11.4. Recent Developments
- 11.2.11.5. Financials (Based on Availability)
- 11.2.12 Huber Packaging
- 11.2.12.1. Overview
- 11.2.12.2. Products
- 11.2.12.3. SWOT Analysis
- 11.2.12.4. Recent Developments
- 11.2.12.5. Financials (Based on Availability)
- 11.2.13 Kian Joo Group
- 11.2.13.1. Overview
- 11.2.13.2. Products
- 11.2.13.3. SWOT Analysis
- 11.2.13.4. Recent Developments
- 11.2.13.5. Financials (Based on Availability)
- 11.2.14 JL Clark
- 11.2.14.1. Overview
- 11.2.14.2. Products
- 11.2.14.3. SWOT Analysis
- 11.2.14.4. Recent Developments
- 11.2.14.5. Financials (Based on Availability)
- 11.2.15 Avon Crowncaps & Containers
- 11.2.15.1. Overview
- 11.2.15.2. Products
- 11.2.15.3. SWOT Analysis
- 11.2.15.4. Recent Developments
- 11.2.15.5. Financials (Based on Availability)
- 11.2.16 UnitedCan Company
- 11.2.16.1. Overview
- 11.2.16.2. Products
- 11.2.16.3. SWOT Analysis
- 11.2.16.4. Recent Developments
- 11.2.16.5. Financials (Based on Availability)
- 11.2.17 Macbey
- 11.2.17.1. Overview
- 11.2.17.2. Products
- 11.2.17.3. SWOT Analysis
- 11.2.17.4. Recent Developments
- 11.2.17.5. Financials (Based on Availability)
- 11.2.18 William Say
- 11.2.18.1. Overview
- 11.2.18.2. Products
- 11.2.18.3. SWOT Analysis
- 11.2.18.4. Recent Developments
- 11.2.18.5. Financials (Based on Availability)
- 11.2.19 Can Pack Group
- 11.2.19.1. Overview
- 11.2.19.2. Products
- 11.2.19.3. SWOT Analysis
- 11.2.19.4. Recent Developments
- 11.2.19.5. Financials (Based on Availability)
- 11.2.20 Greif
- 11.2.20.1. Overview
- 11.2.20.2. Products
- 11.2.20.3. SWOT Analysis
- 11.2.20.4. Recent Developments
- 11.2.20.5. Financials (Based on Availability)
- 11.2.21 HUBER Packaging
- 11.2.21.1. Overview
- 11.2.21.2. Products
- 11.2.21.3. SWOT Analysis
- 11.2.21.4. Recent Developments
- 11.2.21.5. Financials (Based on Availability)
- 11.2.22 Tata Steel
- 11.2.22.1. Overview
- 11.2.22.2. Products
- 11.2.22.3. SWOT Analysis
- 11.2.22.4. Recent Developments
- 11.2.22.5. Financials (Based on Availability)
- 11.2.23 Toyo Seikan
- 11.2.23.1. Overview
- 11.2.23.2. Products
- 11.2.23.3. SWOT Analysis
- 11.2.23.4. Recent Developments
- 11.2.23.5. Financials (Based on Availability)
- 11.2.1 Amcor
List of Figures
- Figure 1: Global metal packaging Revenue Breakdown (million, %) by Region 2025 & 2033
- Figure 2: Global metal packaging Volume Breakdown (K, %) by Region 2025 & 2033
- Figure 3: North America metal packaging Revenue (million), by Application 2025 & 2033
- Figure 4: North America metal packaging Volume (K), by Application 2025 & 2033
- Figure 5: North America metal packaging Revenue Share (%), by Application 2025 & 2033
- Figure 6: North America metal packaging Volume Share (%), by Application 2025 & 2033
- Figure 7: North America metal packaging Revenue (million), by Types 2025 & 2033
- Figure 8: North America metal packaging Volume (K), by Types 2025 & 2033
- Figure 9: North America metal packaging Revenue Share (%), by Types 2025 & 2033
- Figure 10: North America metal packaging Volume Share (%), by Types 2025 & 2033
- Figure 11: North America metal packaging Revenue (million), by Country 2025 & 2033
- Figure 12: North America metal packaging Volume (K), by Country 2025 & 2033
- Figure 13: North America metal packaging Revenue Share (%), by Country 2025 & 2033
- Figure 14: North America metal packaging Volume Share (%), by Country 2025 & 2033
- Figure 15: South America metal packaging Revenue (million), by Application 2025 & 2033
- Figure 16: South America metal packaging Volume (K), by Application 2025 & 2033
- Figure 17: South America metal packaging Revenue Share (%), by Application 2025 & 2033
- Figure 18: South America metal packaging Volume Share (%), by Application 2025 & 2033
- Figure 19: South America metal packaging Revenue (million), by Types 2025 & 2033
- Figure 20: South America metal packaging Volume (K), by Types 2025 & 2033
- Figure 21: South America metal packaging Revenue Share (%), by Types 2025 & 2033
- Figure 22: South America metal packaging Volume Share (%), by Types 2025 & 2033
- Figure 23: South America metal packaging Revenue (million), by Country 2025 & 2033
- Figure 24: South America metal packaging Volume (K), by Country 2025 & 2033
- Figure 25: South America metal packaging Revenue Share (%), by Country 2025 & 2033
- Figure 26: South America metal packaging Volume Share (%), by Country 2025 & 2033
- Figure 27: Europe metal packaging Revenue (million), by Application 2025 & 2033
- Figure 28: Europe metal packaging Volume (K), by Application 2025 & 2033
- Figure 29: Europe metal packaging Revenue Share (%), by Application 2025 & 2033
- Figure 30: Europe metal packaging Volume Share (%), by Application 2025 & 2033
- Figure 31: Europe metal packaging Revenue (million), by Types 2025 & 2033
- Figure 32: Europe metal packaging Volume (K), by Types 2025 & 2033
- Figure 33: Europe metal packaging Revenue Share (%), by Types 2025 & 2033
- Figure 34: Europe metal packaging Volume Share (%), by Types 2025 & 2033
- Figure 35: Europe metal packaging Revenue (million), by Country 2025 & 2033
- Figure 36: Europe metal packaging Volume (K), by Country 2025 & 2033
- Figure 37: Europe metal packaging Revenue Share (%), by Country 2025 & 2033
- Figure 38: Europe metal packaging Volume Share (%), by Country 2025 & 2033
- Figure 39: Middle East & Africa metal packaging Revenue (million), by Application 2025 & 2033
- Figure 40: Middle East & Africa metal packaging Volume (K), by Application 2025 & 2033
- Figure 41: Middle East & Africa metal packaging Revenue Share (%), by Application 2025 & 2033
- Figure 42: Middle East & Africa metal packaging Volume Share (%), by Application 2025 & 2033
- Figure 43: Middle East & Africa metal packaging Revenue (million), by Types 2025 & 2033
- Figure 44: Middle East & Africa metal packaging Volume (K), by Types 2025 & 2033
- Figure 45: Middle East & Africa metal packaging Revenue Share (%), by Types 2025 & 2033
- Figure 46: Middle East & Africa metal packaging Volume Share (%), by Types 2025 & 2033
- Figure 47: Middle East & Africa metal packaging Revenue (million), by Country 2025 & 2033
- Figure 48: Middle East & Africa metal packaging Volume (K), by Country 2025 & 2033
- Figure 49: Middle East & Africa metal packaging Revenue Share (%), by Country 2025 & 2033
- Figure 50: Middle East & Africa metal packaging Volume Share (%), by Country 2025 & 2033
- Figure 51: Asia Pacific metal packaging Revenue (million), by Application 2025 & 2033
- Figure 52: Asia Pacific metal packaging Volume (K), by Application 2025 & 2033
- Figure 53: Asia Pacific metal packaging Revenue Share (%), by Application 2025 & 2033
- Figure 54: Asia Pacific metal packaging Volume Share (%), by Application 2025 & 2033
- Figure 55: Asia Pacific metal packaging Revenue (million), by Types 2025 & 2033
- Figure 56: Asia Pacific metal packaging Volume (K), by Types 2025 & 2033
- Figure 57: Asia Pacific metal packaging Revenue Share (%), by Types 2025 & 2033
- Figure 58: Asia Pacific metal packaging Volume Share (%), by Types 2025 & 2033
- Figure 59: Asia Pacific metal packaging Revenue (million), by Country 2025 & 2033
- Figure 60: Asia Pacific metal packaging Volume (K), by Country 2025 & 2033
- Figure 61: Asia Pacific metal packaging Revenue Share (%), by Country 2025 & 2033
- Figure 62: Asia Pacific metal packaging Volume Share (%), by Country 2025 & 2033
List of Tables
- Table 1: Global metal packaging Revenue million Forecast, by Application 2020 & 2033
- Table 2: Global metal packaging Volume K Forecast, by Application 2020 & 2033
- Table 3: Global metal packaging Revenue million Forecast, by Types 2020 & 2033
- Table 4: Global metal packaging Volume K Forecast, by Types 2020 & 2033
- Table 5: Global metal packaging Revenue million Forecast, by Region 2020 & 2033
- Table 6: Global metal packaging Volume K Forecast, by Region 2020 & 2033
- Table 7: Global metal packaging Revenue million Forecast, by Application 2020 & 2033
- Table 8: Global metal packaging Volume K Forecast, by Application 2020 & 2033
- Table 9: Global metal packaging Revenue million Forecast, by Types 2020 & 2033
- Table 10: Global metal packaging Volume K Forecast, by Types 2020 & 2033
- Table 11: Global metal packaging Revenue million Forecast, by Country 2020 & 2033
- Table 12: Global metal packaging Volume K Forecast, by Country 2020 & 2033
- Table 13: United States metal packaging Revenue (million) Forecast, by Application 2020 & 2033
- Table 14: United States metal packaging Volume (K) Forecast, by Application 2020 & 2033
- Table 15: Canada metal packaging Revenue (million) Forecast, by Application 2020 & 2033
- Table 16: Canada metal packaging Volume (K) Forecast, by Application 2020 & 2033
- Table 17: Mexico metal packaging Revenue (million) Forecast, by Application 2020 & 2033
- Table 18: Mexico metal packaging Volume (K) Forecast, by Application 2020 & 2033
- Table 19: Global metal packaging Revenue million Forecast, by Application 2020 & 2033
- Table 20: Global metal packaging Volume K Forecast, by Application 2020 & 2033
- Table 21: Global metal packaging Revenue million Forecast, by Types 2020 & 2033
- Table 22: Global metal packaging Volume K Forecast, by Types 2020 & 2033
- Table 23: Global metal packaging Revenue million Forecast, by Country 2020 & 2033
- Table 24: Global metal packaging Volume K Forecast, by Country 2020 & 2033
- Table 25: Brazil metal packaging Revenue (million) Forecast, by Application 2020 & 2033
- Table 26: Brazil metal packaging Volume (K) Forecast, by Application 2020 & 2033
- Table 27: Argentina metal packaging Revenue (million) Forecast, by Application 2020 & 2033
- Table 28: Argentina metal packaging Volume (K) Forecast, by Application 2020 & 2033
- Table 29: Rest of South America metal packaging Revenue (million) Forecast, by Application 2020 & 2033
- Table 30: Rest of South America metal packaging Volume (K) Forecast, by Application 2020 & 2033
- Table 31: Global metal packaging Revenue million Forecast, by Application 2020 & 2033
- Table 32: Global metal packaging Volume K Forecast, by Application 2020 & 2033
- Table 33: Global metal packaging Revenue million Forecast, by Types 2020 & 2033
- Table 34: Global metal packaging Volume K Forecast, by Types 2020 & 2033
- Table 35: Global metal packaging Revenue million Forecast, by Country 2020 & 2033
- Table 36: Global metal packaging Volume K Forecast, by Country 2020 & 2033
- Table 37: United Kingdom metal packaging Revenue (million) Forecast, by Application 2020 & 2033
- Table 38: United Kingdom metal packaging Volume (K) Forecast, by Application 2020 & 2033
- Table 39: Germany metal packaging Revenue (million) Forecast, by Application 2020 & 2033
- Table 40: Germany metal packaging Volume (K) Forecast, by Application 2020 & 2033
- Table 41: France metal packaging Revenue (million) Forecast, by Application 2020 & 2033
- Table 42: France metal packaging Volume (K) Forecast, by Application 2020 & 2033
- Table 43: Italy metal packaging Revenue (million) Forecast, by Application 2020 & 2033
- Table 44: Italy metal packaging Volume (K) Forecast, by Application 2020 & 2033
- Table 45: Spain metal packaging Revenue (million) Forecast, by Application 2020 & 2033
- Table 46: Spain metal packaging Volume (K) Forecast, by Application 2020 & 2033
- Table 47: Russia metal packaging Revenue (million) Forecast, by Application 2020 & 2033
- Table 48: Russia metal packaging Volume (K) Forecast, by Application 2020 & 2033
- Table 49: Benelux metal packaging Revenue (million) Forecast, by Application 2020 & 2033
- Table 50: Benelux metal packaging Volume (K) Forecast, by Application 2020 & 2033
- Table 51: Nordics metal packaging Revenue (million) Forecast, by Application 2020 & 2033
- Table 52: Nordics metal packaging Volume (K) Forecast, by Application 2020 & 2033
- Table 53: Rest of Europe metal packaging Revenue (million) Forecast, by Application 2020 & 2033
- Table 54: Rest of Europe metal packaging Volume (K) Forecast, by Application 2020 & 2033
- Table 55: Global metal packaging Revenue million Forecast, by Application 2020 & 2033
- Table 56: Global metal packaging Volume K Forecast, by Application 2020 & 2033
- Table 57: Global metal packaging Revenue million Forecast, by Types 2020 & 2033
- Table 58: Global metal packaging Volume K Forecast, by Types 2020 & 2033
- Table 59: Global metal packaging Revenue million Forecast, by Country 2020 & 2033
- Table 60: Global metal packaging Volume K Forecast, by Country 2020 & 2033
- Table 61: Turkey metal packaging Revenue (million) Forecast, by Application 2020 & 2033
- Table 62: Turkey metal packaging Volume (K) Forecast, by Application 2020 & 2033
- Table 63: Israel metal packaging Revenue (million) Forecast, by Application 2020 & 2033
- Table 64: Israel metal packaging Volume (K) Forecast, by Application 2020 & 2033
- Table 65: GCC metal packaging Revenue (million) Forecast, by Application 2020 & 2033
- Table 66: GCC metal packaging Volume (K) Forecast, by Application 2020 & 2033
- Table 67: North Africa metal packaging Revenue (million) Forecast, by Application 2020 & 2033
- Table 68: North Africa metal packaging Volume (K) Forecast, by Application 2020 & 2033
- Table 69: South Africa metal packaging Revenue (million) Forecast, by Application 2020 & 2033
- Table 70: South Africa metal packaging Volume (K) Forecast, by Application 2020 & 2033
- Table 71: Rest of Middle East & Africa metal packaging Revenue (million) Forecast, by Application 2020 & 2033
- Table 72: Rest of Middle East & Africa metal packaging Volume (K) Forecast, by Application 2020 & 2033
- Table 73: Global metal packaging Revenue million Forecast, by Application 2020 & 2033
- Table 74: Global metal packaging Volume K Forecast, by Application 2020 & 2033
- Table 75: Global metal packaging Revenue million Forecast, by Types 2020 & 2033
- Table 76: Global metal packaging Volume K Forecast, by Types 2020 & 2033
- Table 77: Global metal packaging Revenue million Forecast, by Country 2020 & 2033
- Table 78: Global metal packaging Volume K Forecast, by Country 2020 & 2033
- Table 79: China metal packaging Revenue (million) Forecast, by Application 2020 & 2033
- Table 80: China metal packaging Volume (K) Forecast, by Application 2020 & 2033
- Table 81: India metal packaging Revenue (million) Forecast, by Application 2020 & 2033
- Table 82: India metal packaging Volume (K) Forecast, by Application 2020 & 2033
- Table 83: Japan metal packaging Revenue (million) Forecast, by Application 2020 & 2033
- Table 84: Japan metal packaging Volume (K) Forecast, by Application 2020 & 2033
- Table 85: South Korea metal packaging Revenue (million) Forecast, by Application 2020 & 2033
- Table 86: South Korea metal packaging Volume (K) Forecast, by Application 2020 & 2033
- Table 87: ASEAN metal packaging Revenue (million) Forecast, by Application 2020 & 2033
- Table 88: ASEAN metal packaging Volume (K) Forecast, by Application 2020 & 2033
- Table 89: Oceania metal packaging Revenue (million) Forecast, by Application 2020 & 2033
- Table 90: Oceania metal packaging Volume (K) Forecast, by Application 2020 & 2033
- Table 91: Rest of Asia Pacific metal packaging Revenue (million) Forecast, by Application 2020 & 2033
- Table 92: Rest of Asia Pacific metal packaging Volume (K) Forecast, by Application 2020 & 2033
Frequently Asked Questions
1. What is the projected Compound Annual Growth Rate (CAGR) of the metal packaging?
The projected CAGR is approximately XX%.
2. Which companies are prominent players in the metal packaging?
Key companies in the market include Amcor, Ardagh, Ball, Crown, Sonoco, CPMC, Greif, Ball Corporation, Silgan, Bway, Toyo Seikan Kaisha, Huber Packaging, Kian Joo Group, JL Clark, Avon Crowncaps & Containers, UnitedCan Company, Macbey, William Say, Can Pack Group, Greif, HUBER Packaging, Tata Steel, Toyo Seikan.
3. What are the main segments of the metal packaging?
The market segments include Application, Types.
4. Can you provide details about the market size?
The market size is estimated to be USD XXX million as of 2022.
5. What are some drivers contributing to market growth?
N/A
6. What are the notable trends driving market growth?
N/A
7. Are there any restraints impacting market growth?
N/A
8. Can you provide examples of recent developments in the market?
N/A
9. What pricing options are available for accessing the report?
Pricing options include single-user, multi-user, and enterprise licenses priced at USD 4350.00, USD 6525.00, and USD 8700.00 respectively.
10. Is the market size provided in terms of value or volume?
The market size is provided in terms of value, measured in million and volume, measured in K.
11. Are there any specific market keywords associated with the report?
Yes, the market keyword associated with the report is "metal packaging," which aids in identifying and referencing the specific market segment covered.
12. How do I determine which pricing option suits my needs best?
The pricing options vary based on user requirements and access needs. Individual users may opt for single-user licenses, while businesses requiring broader access may choose multi-user or enterprise licenses for cost-effective access to the report.
13. Are there any additional resources or data provided in the metal packaging report?
While the report offers comprehensive insights, it's advisable to review the specific contents or supplementary materials provided to ascertain if additional resources or data are available.
14. How can I stay updated on further developments or reports in the metal packaging?
To stay informed about further developments, trends, and reports in the metal packaging, consider subscribing to industry newsletters, following relevant companies and organizations, or regularly checking reputable industry news sources and publications.
Methodology
Step 1 - Identification of Relevant Samples Size from Population Database


Step 2 - Approaches for Defining Global Market Size (Value, Volume* & Price*)

Note*: In applicable scenarios
Step 3 - Data Sources
Primary Research
- Web Analytics
- Survey Reports
- Research Institute
- Latest Research Reports
- Opinion Leaders
Secondary Research
- Annual Reports
- White Paper
- Latest Press Release
- Industry Association
- Paid Database
- Investor Presentations

Step 4 - Data Triangulation
Involves using different sources of information in order to increase the validity of a study
These sources are likely to be stakeholders in a program - participants, other researchers, program staff, other community members, and so on.
Then we put all data in single framework & apply various statistical tools to find out the dynamic on the market.
During the analysis stage, feedback from the stakeholder groups would be compared to determine areas of agreement as well as areas of divergence