

Key Insights
The global metal returnable packaging market is poised for significant expansion, driven by the escalating demand for sustainable and efficient logistics. This growth is propelled by the widespread adoption of circular economy principles, stringent environmental mandates promoting waste reduction, and the critical need for reusable packaging to optimize supply chain efficiency and lower operational costs. Key industries such as automotive, food & beverage, and chemicals are primary drivers, owing to their extensive reliance on dependable product transportation. While upfront investment in metal returnable packaging may exceed that of disposable alternatives, the demonstrable long-term financial benefits, including reduced waste disposal expenses, lower material procurement costs, and optimized transportation, present a compelling value proposition for sustainability-focused enterprises. The market is segmented by packaging type (e.g., bins, containers, pallets), end-use industry, and geographical region. Leading market participants are prioritizing innovation, focusing on the development of lighter, more durable materials, advanced tracking and management systems, and strategic partnerships to broaden market reach and enhance supply chain solutions.
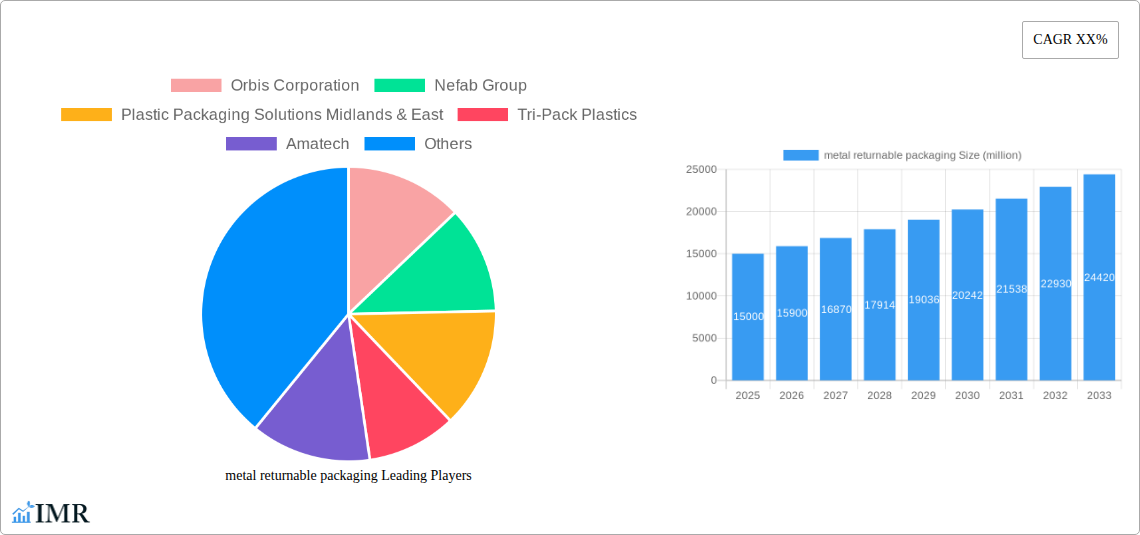
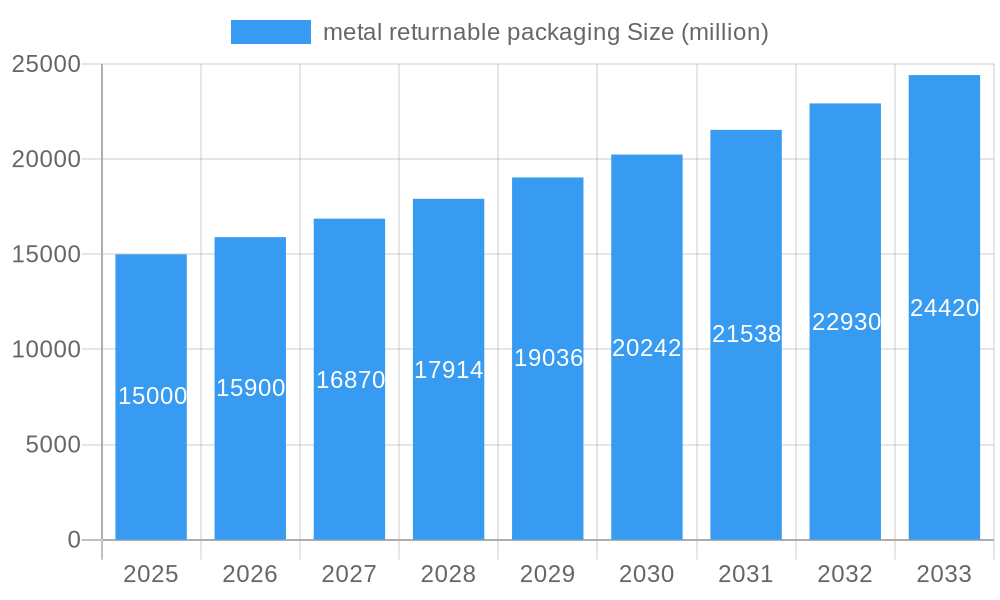
metal returnable packaging Market Size (In Billion)
Intensifying competition among established vendors and emerging players is fostering strategic alliances, mergers, and acquisitions. This dynamic market is projected to achieve a market size of $141.7 billion by 2025, exhibiting a Compound Annual Growth Rate (CAGR) of 3.9%. Future growth trajectories will be shaped by evolving consumer preferences, material science advancements, and the increasing imperative to reduce carbon emissions. Regional market dynamics will be influenced by existing infrastructure, regulatory frameworks, and economic development. Despite a positive outlook, the market confronts challenges such as volatile raw material prices and potential supply chain disruptions. Nevertheless, the overarching trend indicates a substantial increase in the adoption of metal returnable packaging, propelled by both economic advantages and environmental imperatives.
metal returnable packaging Company Market Share
Metal Returnable Packaging Market Report: 2019-2033
This comprehensive report provides an in-depth analysis of the global metal returnable packaging market, offering invaluable insights for industry professionals, investors, and strategic decision-makers. The study covers the period 2019-2033, with a focus on the forecast period 2025-2033 (Base Year: 2025, Estimated Year: 2025). The report segments the market by various factors and analyzes key players shaping its evolution. With a detailed examination of market dynamics, growth trends, regional dominance, and emerging opportunities, this report is an essential resource for navigating the complexities of this dynamic sector. The market size is expected to reach xx million units by 2033.
Metal Returnable Packaging Market Dynamics & Structure
This section delves into the intricate structure of the metal returnable packaging market, analyzing its competitive landscape, technological advancements, and regulatory influences. The market is moderately concentrated, with key players holding significant market share. However, smaller, specialized firms contribute substantially to innovation. The report quantifies market concentration using the Herfindahl-Hirschman Index (HHI) and provides insights into recent mergers and acquisitions (M&A) activity, with an estimated xx million units worth of deals in the past five years.
- Market Concentration: The HHI for the metal returnable packaging market is estimated at xx, indicating a moderately concentrated market.
- Technological Innovation: Significant advancements in materials science, particularly in the development of lighter, stronger, and more durable metals, are driving market growth. However, high initial investment costs represent a barrier to entry for some firms.
- Regulatory Frameworks: Environmental regulations, promoting sustainable packaging solutions, are creating favorable conditions for the adoption of metal returnable packaging. However, varying regulations across regions present challenges for global players.
- Competitive Product Substitutes: Plastics and other materials pose competition; however, the inherent durability and recyclability of metal provide a significant advantage.
- End-User Demographics: The primary end-users are concentrated in the food and beverage, automotive, and manufacturing sectors.
- M&A Trends: Consolidation within the market is expected to continue, driven by the need for scale and technological expertise.
Metal Returnable Packaging Growth Trends & Insights
This section provides a comprehensive analysis of the market's growth trajectory, utilizing data-driven insights and expert analysis. The global metal returnable packaging market exhibited a CAGR of xx% during the historical period (2019-2024) and is projected to maintain a CAGR of xx% during the forecast period (2025-2033). This growth is attributed to several factors, including the increasing adoption of sustainable packaging practices and the rising demand for reusable packaging solutions across various end-use industries. The report analyzes market penetration rates across different regions and segments, providing granular insights into market dynamics. Technological advancements, such as the use of smart sensors and RFID technology in metal returnable packaging, are further accelerating market growth. The shift toward e-commerce and the growing need for efficient supply chain management are also contributing to market expansion.
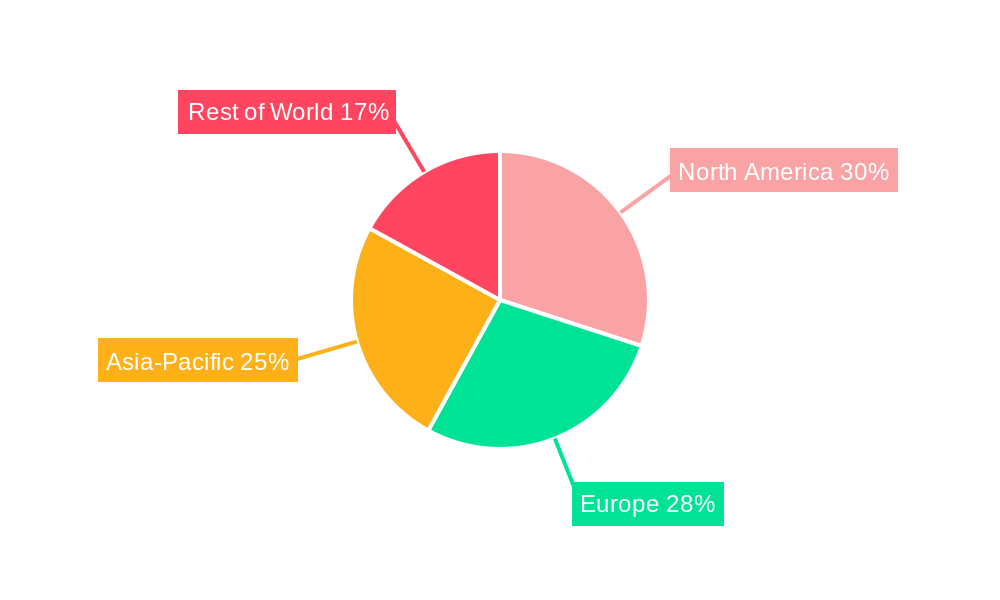
Dominant Regions, Countries, or Segments in Metal Returnable Packaging
North America currently dominates the metal returnable packaging market, accounting for xx% of global market share in 2025. This dominance is driven by stringent environmental regulations, a robust manufacturing sector, and a high demand for efficient logistics solutions. Europe follows closely, with a market share of xx%.
- Key Drivers in North America: Stringent environmental regulations, high manufacturing output, and a well-established logistics infrastructure.
- Key Drivers in Europe: Increasing awareness of sustainable practices and growing demand from the food and beverage industry.
- Asia-Pacific Growth Potential: The Asia-Pacific region shows considerable potential for future growth, driven by rising industrialization and increasing disposable incomes.
Metal Returnable Packaging Product Landscape
The metal returnable packaging market offers a diverse range of products, including crates, pallets, and containers, each designed for specific applications. Recent innovations focus on lightweighting to reduce transportation costs and incorporating features such as integrated RFID tags for improved track-and-trace capabilities. These advancements enhance product performance and provide unique selling propositions, contributing to increased market adoption.
Key Drivers, Barriers & Challenges in Metal Returnable Packaging
Key Drivers: The market is primarily driven by the increasing demand for sustainable packaging, rising concerns over environmental regulations and the need for efficient logistics and supply chain management. Government incentives for sustainable practices and the growing adoption of circular economy principles also significantly contribute.
Key Challenges: High initial investment costs associated with metal returnable packaging systems can be a barrier to entry for some businesses. Additionally, variations in regulations across different regions and the competition from alternative packaging materials (such as plastics) pose significant challenges. Supply chain disruptions can also impact the availability and cost of metal returnable packaging.
Emerging Opportunities in Metal Returnable Packaging
Untapped opportunities exist in emerging economies, where rising industrialization and increasing disposable incomes are driving demand for efficient packaging solutions. Further growth potential lies in developing innovative applications for metal returnable packaging within new industries and sectors.
Growth Accelerators in the Metal Returnable Packaging Industry
Technological advancements such as smart sensors and improved material science are key growth catalysts. Strategic partnerships between packaging providers and end-users are enhancing the efficiency of returnable packaging systems. Expanding into new geographic markets and diversifying product offerings can further stimulate long-term growth.
Key Players Shaping the Metal Returnable Packaging Market
- Orbis Corporation
- Nefab Group
- Plastic Packaging Solutions Midlands & East
- Tri-Pack Plastics
- Amatech
- CHEP
- Celina Industries
- UBEECO Packaging Solutions
- RPR
- Schoeller Allibert
Notable Milestones in Metal Returnable Packaging Sector
- 2022: Schoeller Allibert launched a new range of sustainable metal returnable packaging solutions.
- 2023: CHEP invested in expanding its metal returnable packaging fleet to meet rising demand.
- 2024: Orbis Corporation and Nefab Group announced a joint venture focused on the development of next-generation metal returnable packaging. (Further milestones require specific data and cannot be reliably predicted.)
In-Depth Metal Returnable Packaging Market Outlook
The metal returnable packaging market is poised for sustained growth, driven by increasing demand for sustainable and efficient packaging solutions. Strategic partnerships and technological advancements are expected to further fuel expansion. Companies focused on innovation and sustainability are best positioned to capitalize on emerging opportunities.
metal returnable packaging Segmentation
-
1. Application
- 1.1. Food & Beverages
- 1.2. Automotive
- 1.3. Consumer Durables
- 1.4. Healthcare
- 1.5. Others
-
2. Types
- 2.1. Pallets
- 2.2. Crates
- 2.3. Drums
- 2.4. Other
metal returnable packaging Segmentation By Geography
-
1. North America
- 1.1. United States
- 1.2. Canada
- 1.3. Mexico
-
2. South America
- 2.1. Brazil
- 2.2. Argentina
- 2.3. Rest of South America
-
3. Europe
- 3.1. United Kingdom
- 3.2. Germany
- 3.3. France
- 3.4. Italy
- 3.5. Spain
- 3.6. Russia
- 3.7. Benelux
- 3.8. Nordics
- 3.9. Rest of Europe
-
4. Middle East & Africa
- 4.1. Turkey
- 4.2. Israel
- 4.3. GCC
- 4.4. North Africa
- 4.5. South Africa
- 4.6. Rest of Middle East & Africa
-
5. Asia Pacific
- 5.1. China
- 5.2. India
- 5.3. Japan
- 5.4. South Korea
- 5.5. ASEAN
- 5.6. Oceania
- 5.7. Rest of Asia Pacific
metal returnable packaging Regional Market Share
Geographic Coverage of metal returnable packaging
metal returnable packaging REPORT HIGHLIGHTS
| Aspects | Details |
|---|---|
| Study Period | 2020-2034 |
| Base Year | 2025 |
| Estimated Year | 2026 |
| Forecast Period | 2026-2034 |
| Historical Period | 2020-2025 |
| Growth Rate | CAGR of 3.9% from 2020-2034 |
| Segmentation |
|
Table of Contents
- 1. Introduction
- 1.1. Research Scope
- 1.2. Market Segmentation
- 1.3. Research Methodology
- 1.4. Definitions and Assumptions
- 2. Executive Summary
- 2.1. Introduction
- 3. Market Dynamics
- 3.1. Introduction
- 3.2. Market Drivers
- 3.3. Market Restrains
- 3.4. Market Trends
- 4. Market Factor Analysis
- 4.1. Porters Five Forces
- 4.2. Supply/Value Chain
- 4.3. PESTEL analysis
- 4.4. Market Entropy
- 4.5. Patent/Trademark Analysis
- 5. Global metal returnable packaging Analysis, Insights and Forecast, 2020-2032
- 5.1. Market Analysis, Insights and Forecast - by Application
- 5.1.1. Food & Beverages
- 5.1.2. Automotive
- 5.1.3. Consumer Durables
- 5.1.4. Healthcare
- 5.1.5. Others
- 5.2. Market Analysis, Insights and Forecast - by Types
- 5.2.1. Pallets
- 5.2.2. Crates
- 5.2.3. Drums
- 5.2.4. Other
- 5.3. Market Analysis, Insights and Forecast - by Region
- 5.3.1. North America
- 5.3.2. South America
- 5.3.3. Europe
- 5.3.4. Middle East & Africa
- 5.3.5. Asia Pacific
- 5.1. Market Analysis, Insights and Forecast - by Application
- 6. North America metal returnable packaging Analysis, Insights and Forecast, 2020-2032
- 6.1. Market Analysis, Insights and Forecast - by Application
- 6.1.1. Food & Beverages
- 6.1.2. Automotive
- 6.1.3. Consumer Durables
- 6.1.4. Healthcare
- 6.1.5. Others
- 6.2. Market Analysis, Insights and Forecast - by Types
- 6.2.1. Pallets
- 6.2.2. Crates
- 6.2.3. Drums
- 6.2.4. Other
- 6.1. Market Analysis, Insights and Forecast - by Application
- 7. South America metal returnable packaging Analysis, Insights and Forecast, 2020-2032
- 7.1. Market Analysis, Insights and Forecast - by Application
- 7.1.1. Food & Beverages
- 7.1.2. Automotive
- 7.1.3. Consumer Durables
- 7.1.4. Healthcare
- 7.1.5. Others
- 7.2. Market Analysis, Insights and Forecast - by Types
- 7.2.1. Pallets
- 7.2.2. Crates
- 7.2.3. Drums
- 7.2.4. Other
- 7.1. Market Analysis, Insights and Forecast - by Application
- 8. Europe metal returnable packaging Analysis, Insights and Forecast, 2020-2032
- 8.1. Market Analysis, Insights and Forecast - by Application
- 8.1.1. Food & Beverages
- 8.1.2. Automotive
- 8.1.3. Consumer Durables
- 8.1.4. Healthcare
- 8.1.5. Others
- 8.2. Market Analysis, Insights and Forecast - by Types
- 8.2.1. Pallets
- 8.2.2. Crates
- 8.2.3. Drums
- 8.2.4. Other
- 8.1. Market Analysis, Insights and Forecast - by Application
- 9. Middle East & Africa metal returnable packaging Analysis, Insights and Forecast, 2020-2032
- 9.1. Market Analysis, Insights and Forecast - by Application
- 9.1.1. Food & Beverages
- 9.1.2. Automotive
- 9.1.3. Consumer Durables
- 9.1.4. Healthcare
- 9.1.5. Others
- 9.2. Market Analysis, Insights and Forecast - by Types
- 9.2.1. Pallets
- 9.2.2. Crates
- 9.2.3. Drums
- 9.2.4. Other
- 9.1. Market Analysis, Insights and Forecast - by Application
- 10. Asia Pacific metal returnable packaging Analysis, Insights and Forecast, 2020-2032
- 10.1. Market Analysis, Insights and Forecast - by Application
- 10.1.1. Food & Beverages
- 10.1.2. Automotive
- 10.1.3. Consumer Durables
- 10.1.4. Healthcare
- 10.1.5. Others
- 10.2. Market Analysis, Insights and Forecast - by Types
- 10.2.1. Pallets
- 10.2.2. Crates
- 10.2.3. Drums
- 10.2.4. Other
- 10.1. Market Analysis, Insights and Forecast - by Application
- 11. Competitive Analysis
- 11.1. Global Market Share Analysis 2025
- 11.2. Company Profiles
- 11.2.1 Orbis Corporation
- 11.2.1.1. Overview
- 11.2.1.2. Products
- 11.2.1.3. SWOT Analysis
- 11.2.1.4. Recent Developments
- 11.2.1.5. Financials (Based on Availability)
- 11.2.2 Nefab Group
- 11.2.2.1. Overview
- 11.2.2.2. Products
- 11.2.2.3. SWOT Analysis
- 11.2.2.4. Recent Developments
- 11.2.2.5. Financials (Based on Availability)
- 11.2.3 Plastic Packaging Solutions Midlands & East
- 11.2.3.1. Overview
- 11.2.3.2. Products
- 11.2.3.3. SWOT Analysis
- 11.2.3.4. Recent Developments
- 11.2.3.5. Financials (Based on Availability)
- 11.2.4 Tri-Pack Plastics
- 11.2.4.1. Overview
- 11.2.4.2. Products
- 11.2.4.3. SWOT Analysis
- 11.2.4.4. Recent Developments
- 11.2.4.5. Financials (Based on Availability)
- 11.2.5 Amatech
- 11.2.5.1. Overview
- 11.2.5.2. Products
- 11.2.5.3. SWOT Analysis
- 11.2.5.4. Recent Developments
- 11.2.5.5. Financials (Based on Availability)
- 11.2.6 CHEP
- 11.2.6.1. Overview
- 11.2.6.2. Products
- 11.2.6.3. SWOT Analysis
- 11.2.6.4. Recent Developments
- 11.2.6.5. Financials (Based on Availability)
- 11.2.7 Celina Industries
- 11.2.7.1. Overview
- 11.2.7.2. Products
- 11.2.7.3. SWOT Analysis
- 11.2.7.4. Recent Developments
- 11.2.7.5. Financials (Based on Availability)
- 11.2.8 UBEECO Packaging Solutions
- 11.2.8.1. Overview
- 11.2.8.2. Products
- 11.2.8.3. SWOT Analysis
- 11.2.8.4. Recent Developments
- 11.2.8.5. Financials (Based on Availability)
- 11.2.9 RPR
- 11.2.9.1. Overview
- 11.2.9.2. Products
- 11.2.9.3. SWOT Analysis
- 11.2.9.4. Recent Developments
- 11.2.9.5. Financials (Based on Availability)
- 11.2.10 Schoeller Allibert
- 11.2.10.1. Overview
- 11.2.10.2. Products
- 11.2.10.3. SWOT Analysis
- 11.2.10.4. Recent Developments
- 11.2.10.5. Financials (Based on Availability)
- 11.2.1 Orbis Corporation
List of Figures
- Figure 1: Global metal returnable packaging Revenue Breakdown (billion, %) by Region 2025 & 2033
- Figure 2: Global metal returnable packaging Volume Breakdown (K, %) by Region 2025 & 2033
- Figure 3: North America metal returnable packaging Revenue (billion), by Application 2025 & 2033
- Figure 4: North America metal returnable packaging Volume (K), by Application 2025 & 2033
- Figure 5: North America metal returnable packaging Revenue Share (%), by Application 2025 & 2033
- Figure 6: North America metal returnable packaging Volume Share (%), by Application 2025 & 2033
- Figure 7: North America metal returnable packaging Revenue (billion), by Types 2025 & 2033
- Figure 8: North America metal returnable packaging Volume (K), by Types 2025 & 2033
- Figure 9: North America metal returnable packaging Revenue Share (%), by Types 2025 & 2033
- Figure 10: North America metal returnable packaging Volume Share (%), by Types 2025 & 2033
- Figure 11: North America metal returnable packaging Revenue (billion), by Country 2025 & 2033
- Figure 12: North America metal returnable packaging Volume (K), by Country 2025 & 2033
- Figure 13: North America metal returnable packaging Revenue Share (%), by Country 2025 & 2033
- Figure 14: North America metal returnable packaging Volume Share (%), by Country 2025 & 2033
- Figure 15: South America metal returnable packaging Revenue (billion), by Application 2025 & 2033
- Figure 16: South America metal returnable packaging Volume (K), by Application 2025 & 2033
- Figure 17: South America metal returnable packaging Revenue Share (%), by Application 2025 & 2033
- Figure 18: South America metal returnable packaging Volume Share (%), by Application 2025 & 2033
- Figure 19: South America metal returnable packaging Revenue (billion), by Types 2025 & 2033
- Figure 20: South America metal returnable packaging Volume (K), by Types 2025 & 2033
- Figure 21: South America metal returnable packaging Revenue Share (%), by Types 2025 & 2033
- Figure 22: South America metal returnable packaging Volume Share (%), by Types 2025 & 2033
- Figure 23: South America metal returnable packaging Revenue (billion), by Country 2025 & 2033
- Figure 24: South America metal returnable packaging Volume (K), by Country 2025 & 2033
- Figure 25: South America metal returnable packaging Revenue Share (%), by Country 2025 & 2033
- Figure 26: South America metal returnable packaging Volume Share (%), by Country 2025 & 2033
- Figure 27: Europe metal returnable packaging Revenue (billion), by Application 2025 & 2033
- Figure 28: Europe metal returnable packaging Volume (K), by Application 2025 & 2033
- Figure 29: Europe metal returnable packaging Revenue Share (%), by Application 2025 & 2033
- Figure 30: Europe metal returnable packaging Volume Share (%), by Application 2025 & 2033
- Figure 31: Europe metal returnable packaging Revenue (billion), by Types 2025 & 2033
- Figure 32: Europe metal returnable packaging Volume (K), by Types 2025 & 2033
- Figure 33: Europe metal returnable packaging Revenue Share (%), by Types 2025 & 2033
- Figure 34: Europe metal returnable packaging Volume Share (%), by Types 2025 & 2033
- Figure 35: Europe metal returnable packaging Revenue (billion), by Country 2025 & 2033
- Figure 36: Europe metal returnable packaging Volume (K), by Country 2025 & 2033
- Figure 37: Europe metal returnable packaging Revenue Share (%), by Country 2025 & 2033
- Figure 38: Europe metal returnable packaging Volume Share (%), by Country 2025 & 2033
- Figure 39: Middle East & Africa metal returnable packaging Revenue (billion), by Application 2025 & 2033
- Figure 40: Middle East & Africa metal returnable packaging Volume (K), by Application 2025 & 2033
- Figure 41: Middle East & Africa metal returnable packaging Revenue Share (%), by Application 2025 & 2033
- Figure 42: Middle East & Africa metal returnable packaging Volume Share (%), by Application 2025 & 2033
- Figure 43: Middle East & Africa metal returnable packaging Revenue (billion), by Types 2025 & 2033
- Figure 44: Middle East & Africa metal returnable packaging Volume (K), by Types 2025 & 2033
- Figure 45: Middle East & Africa metal returnable packaging Revenue Share (%), by Types 2025 & 2033
- Figure 46: Middle East & Africa metal returnable packaging Volume Share (%), by Types 2025 & 2033
- Figure 47: Middle East & Africa metal returnable packaging Revenue (billion), by Country 2025 & 2033
- Figure 48: Middle East & Africa metal returnable packaging Volume (K), by Country 2025 & 2033
- Figure 49: Middle East & Africa metal returnable packaging Revenue Share (%), by Country 2025 & 2033
- Figure 50: Middle East & Africa metal returnable packaging Volume Share (%), by Country 2025 & 2033
- Figure 51: Asia Pacific metal returnable packaging Revenue (billion), by Application 2025 & 2033
- Figure 52: Asia Pacific metal returnable packaging Volume (K), by Application 2025 & 2033
- Figure 53: Asia Pacific metal returnable packaging Revenue Share (%), by Application 2025 & 2033
- Figure 54: Asia Pacific metal returnable packaging Volume Share (%), by Application 2025 & 2033
- Figure 55: Asia Pacific metal returnable packaging Revenue (billion), by Types 2025 & 2033
- Figure 56: Asia Pacific metal returnable packaging Volume (K), by Types 2025 & 2033
- Figure 57: Asia Pacific metal returnable packaging Revenue Share (%), by Types 2025 & 2033
- Figure 58: Asia Pacific metal returnable packaging Volume Share (%), by Types 2025 & 2033
- Figure 59: Asia Pacific metal returnable packaging Revenue (billion), by Country 2025 & 2033
- Figure 60: Asia Pacific metal returnable packaging Volume (K), by Country 2025 & 2033
- Figure 61: Asia Pacific metal returnable packaging Revenue Share (%), by Country 2025 & 2033
- Figure 62: Asia Pacific metal returnable packaging Volume Share (%), by Country 2025 & 2033
List of Tables
- Table 1: Global metal returnable packaging Revenue billion Forecast, by Application 2020 & 2033
- Table 2: Global metal returnable packaging Volume K Forecast, by Application 2020 & 2033
- Table 3: Global metal returnable packaging Revenue billion Forecast, by Types 2020 & 2033
- Table 4: Global metal returnable packaging Volume K Forecast, by Types 2020 & 2033
- Table 5: Global metal returnable packaging Revenue billion Forecast, by Region 2020 & 2033
- Table 6: Global metal returnable packaging Volume K Forecast, by Region 2020 & 2033
- Table 7: Global metal returnable packaging Revenue billion Forecast, by Application 2020 & 2033
- Table 8: Global metal returnable packaging Volume K Forecast, by Application 2020 & 2033
- Table 9: Global metal returnable packaging Revenue billion Forecast, by Types 2020 & 2033
- Table 10: Global metal returnable packaging Volume K Forecast, by Types 2020 & 2033
- Table 11: Global metal returnable packaging Revenue billion Forecast, by Country 2020 & 2033
- Table 12: Global metal returnable packaging Volume K Forecast, by Country 2020 & 2033
- Table 13: United States metal returnable packaging Revenue (billion) Forecast, by Application 2020 & 2033
- Table 14: United States metal returnable packaging Volume (K) Forecast, by Application 2020 & 2033
- Table 15: Canada metal returnable packaging Revenue (billion) Forecast, by Application 2020 & 2033
- Table 16: Canada metal returnable packaging Volume (K) Forecast, by Application 2020 & 2033
- Table 17: Mexico metal returnable packaging Revenue (billion) Forecast, by Application 2020 & 2033
- Table 18: Mexico metal returnable packaging Volume (K) Forecast, by Application 2020 & 2033
- Table 19: Global metal returnable packaging Revenue billion Forecast, by Application 2020 & 2033
- Table 20: Global metal returnable packaging Volume K Forecast, by Application 2020 & 2033
- Table 21: Global metal returnable packaging Revenue billion Forecast, by Types 2020 & 2033
- Table 22: Global metal returnable packaging Volume K Forecast, by Types 2020 & 2033
- Table 23: Global metal returnable packaging Revenue billion Forecast, by Country 2020 & 2033
- Table 24: Global metal returnable packaging Volume K Forecast, by Country 2020 & 2033
- Table 25: Brazil metal returnable packaging Revenue (billion) Forecast, by Application 2020 & 2033
- Table 26: Brazil metal returnable packaging Volume (K) Forecast, by Application 2020 & 2033
- Table 27: Argentina metal returnable packaging Revenue (billion) Forecast, by Application 2020 & 2033
- Table 28: Argentina metal returnable packaging Volume (K) Forecast, by Application 2020 & 2033
- Table 29: Rest of South America metal returnable packaging Revenue (billion) Forecast, by Application 2020 & 2033
- Table 30: Rest of South America metal returnable packaging Volume (K) Forecast, by Application 2020 & 2033
- Table 31: Global metal returnable packaging Revenue billion Forecast, by Application 2020 & 2033
- Table 32: Global metal returnable packaging Volume K Forecast, by Application 2020 & 2033
- Table 33: Global metal returnable packaging Revenue billion Forecast, by Types 2020 & 2033
- Table 34: Global metal returnable packaging Volume K Forecast, by Types 2020 & 2033
- Table 35: Global metal returnable packaging Revenue billion Forecast, by Country 2020 & 2033
- Table 36: Global metal returnable packaging Volume K Forecast, by Country 2020 & 2033
- Table 37: United Kingdom metal returnable packaging Revenue (billion) Forecast, by Application 2020 & 2033
- Table 38: United Kingdom metal returnable packaging Volume (K) Forecast, by Application 2020 & 2033
- Table 39: Germany metal returnable packaging Revenue (billion) Forecast, by Application 2020 & 2033
- Table 40: Germany metal returnable packaging Volume (K) Forecast, by Application 2020 & 2033
- Table 41: France metal returnable packaging Revenue (billion) Forecast, by Application 2020 & 2033
- Table 42: France metal returnable packaging Volume (K) Forecast, by Application 2020 & 2033
- Table 43: Italy metal returnable packaging Revenue (billion) Forecast, by Application 2020 & 2033
- Table 44: Italy metal returnable packaging Volume (K) Forecast, by Application 2020 & 2033
- Table 45: Spain metal returnable packaging Revenue (billion) Forecast, by Application 2020 & 2033
- Table 46: Spain metal returnable packaging Volume (K) Forecast, by Application 2020 & 2033
- Table 47: Russia metal returnable packaging Revenue (billion) Forecast, by Application 2020 & 2033
- Table 48: Russia metal returnable packaging Volume (K) Forecast, by Application 2020 & 2033
- Table 49: Benelux metal returnable packaging Revenue (billion) Forecast, by Application 2020 & 2033
- Table 50: Benelux metal returnable packaging Volume (K) Forecast, by Application 2020 & 2033
- Table 51: Nordics metal returnable packaging Revenue (billion) Forecast, by Application 2020 & 2033
- Table 52: Nordics metal returnable packaging Volume (K) Forecast, by Application 2020 & 2033
- Table 53: Rest of Europe metal returnable packaging Revenue (billion) Forecast, by Application 2020 & 2033
- Table 54: Rest of Europe metal returnable packaging Volume (K) Forecast, by Application 2020 & 2033
- Table 55: Global metal returnable packaging Revenue billion Forecast, by Application 2020 & 2033
- Table 56: Global metal returnable packaging Volume K Forecast, by Application 2020 & 2033
- Table 57: Global metal returnable packaging Revenue billion Forecast, by Types 2020 & 2033
- Table 58: Global metal returnable packaging Volume K Forecast, by Types 2020 & 2033
- Table 59: Global metal returnable packaging Revenue billion Forecast, by Country 2020 & 2033
- Table 60: Global metal returnable packaging Volume K Forecast, by Country 2020 & 2033
- Table 61: Turkey metal returnable packaging Revenue (billion) Forecast, by Application 2020 & 2033
- Table 62: Turkey metal returnable packaging Volume (K) Forecast, by Application 2020 & 2033
- Table 63: Israel metal returnable packaging Revenue (billion) Forecast, by Application 2020 & 2033
- Table 64: Israel metal returnable packaging Volume (K) Forecast, by Application 2020 & 2033
- Table 65: GCC metal returnable packaging Revenue (billion) Forecast, by Application 2020 & 2033
- Table 66: GCC metal returnable packaging Volume (K) Forecast, by Application 2020 & 2033
- Table 67: North Africa metal returnable packaging Revenue (billion) Forecast, by Application 2020 & 2033
- Table 68: North Africa metal returnable packaging Volume (K) Forecast, by Application 2020 & 2033
- Table 69: South Africa metal returnable packaging Revenue (billion) Forecast, by Application 2020 & 2033
- Table 70: South Africa metal returnable packaging Volume (K) Forecast, by Application 2020 & 2033
- Table 71: Rest of Middle East & Africa metal returnable packaging Revenue (billion) Forecast, by Application 2020 & 2033
- Table 72: Rest of Middle East & Africa metal returnable packaging Volume (K) Forecast, by Application 2020 & 2033
- Table 73: Global metal returnable packaging Revenue billion Forecast, by Application 2020 & 2033
- Table 74: Global metal returnable packaging Volume K Forecast, by Application 2020 & 2033
- Table 75: Global metal returnable packaging Revenue billion Forecast, by Types 2020 & 2033
- Table 76: Global metal returnable packaging Volume K Forecast, by Types 2020 & 2033
- Table 77: Global metal returnable packaging Revenue billion Forecast, by Country 2020 & 2033
- Table 78: Global metal returnable packaging Volume K Forecast, by Country 2020 & 2033
- Table 79: China metal returnable packaging Revenue (billion) Forecast, by Application 2020 & 2033
- Table 80: China metal returnable packaging Volume (K) Forecast, by Application 2020 & 2033
- Table 81: India metal returnable packaging Revenue (billion) Forecast, by Application 2020 & 2033
- Table 82: India metal returnable packaging Volume (K) Forecast, by Application 2020 & 2033
- Table 83: Japan metal returnable packaging Revenue (billion) Forecast, by Application 2020 & 2033
- Table 84: Japan metal returnable packaging Volume (K) Forecast, by Application 2020 & 2033
- Table 85: South Korea metal returnable packaging Revenue (billion) Forecast, by Application 2020 & 2033
- Table 86: South Korea metal returnable packaging Volume (K) Forecast, by Application 2020 & 2033
- Table 87: ASEAN metal returnable packaging Revenue (billion) Forecast, by Application 2020 & 2033
- Table 88: ASEAN metal returnable packaging Volume (K) Forecast, by Application 2020 & 2033
- Table 89: Oceania metal returnable packaging Revenue (billion) Forecast, by Application 2020 & 2033
- Table 90: Oceania metal returnable packaging Volume (K) Forecast, by Application 2020 & 2033
- Table 91: Rest of Asia Pacific metal returnable packaging Revenue (billion) Forecast, by Application 2020 & 2033
- Table 92: Rest of Asia Pacific metal returnable packaging Volume (K) Forecast, by Application 2020 & 2033
Frequently Asked Questions
1. What is the projected Compound Annual Growth Rate (CAGR) of the metal returnable packaging?
The projected CAGR is approximately 3.9%.
2. Which companies are prominent players in the metal returnable packaging?
Key companies in the market include Orbis Corporation, Nefab Group, Plastic Packaging Solutions Midlands & East, Tri-Pack Plastics, Amatech, CHEP, Celina Industries, UBEECO Packaging Solutions, RPR, Schoeller Allibert.
3. What are the main segments of the metal returnable packaging?
The market segments include Application, Types.
4. Can you provide details about the market size?
The market size is estimated to be USD 141.7 billion as of 2022.
5. What are some drivers contributing to market growth?
N/A
6. What are the notable trends driving market growth?
N/A
7. Are there any restraints impacting market growth?
N/A
8. Can you provide examples of recent developments in the market?
N/A
9. What pricing options are available for accessing the report?
Pricing options include single-user, multi-user, and enterprise licenses priced at USD 4350.00, USD 6525.00, and USD 8700.00 respectively.
10. Is the market size provided in terms of value or volume?
The market size is provided in terms of value, measured in billion and volume, measured in K.
11. Are there any specific market keywords associated with the report?
Yes, the market keyword associated with the report is "metal returnable packaging," which aids in identifying and referencing the specific market segment covered.
12. How do I determine which pricing option suits my needs best?
The pricing options vary based on user requirements and access needs. Individual users may opt for single-user licenses, while businesses requiring broader access may choose multi-user or enterprise licenses for cost-effective access to the report.
13. Are there any additional resources or data provided in the metal returnable packaging report?
While the report offers comprehensive insights, it's advisable to review the specific contents or supplementary materials provided to ascertain if additional resources or data are available.
14. How can I stay updated on further developments or reports in the metal returnable packaging?
To stay informed about further developments, trends, and reports in the metal returnable packaging, consider subscribing to industry newsletters, following relevant companies and organizations, or regularly checking reputable industry news sources and publications.
Methodology
Step 1 - Identification of Relevant Samples Size from Population Database


Step 2 - Approaches for Defining Global Market Size (Value, Volume* & Price*)

Note*: In applicable scenarios
Step 3 - Data Sources
Primary Research
- Web Analytics
- Survey Reports
- Research Institute
- Latest Research Reports
- Opinion Leaders
Secondary Research
- Annual Reports
- White Paper
- Latest Press Release
- Industry Association
- Paid Database
- Investor Presentations

Step 4 - Data Triangulation
Involves using different sources of information in order to increase the validity of a study
These sources are likely to be stakeholders in a program - participants, other researchers, program staff, other community members, and so on.
Then we put all data in single framework & apply various statistical tools to find out the dynamic on the market.
During the analysis stage, feedback from the stakeholder groups would be compared to determine areas of agreement as well as areas of divergence