

Key Insights
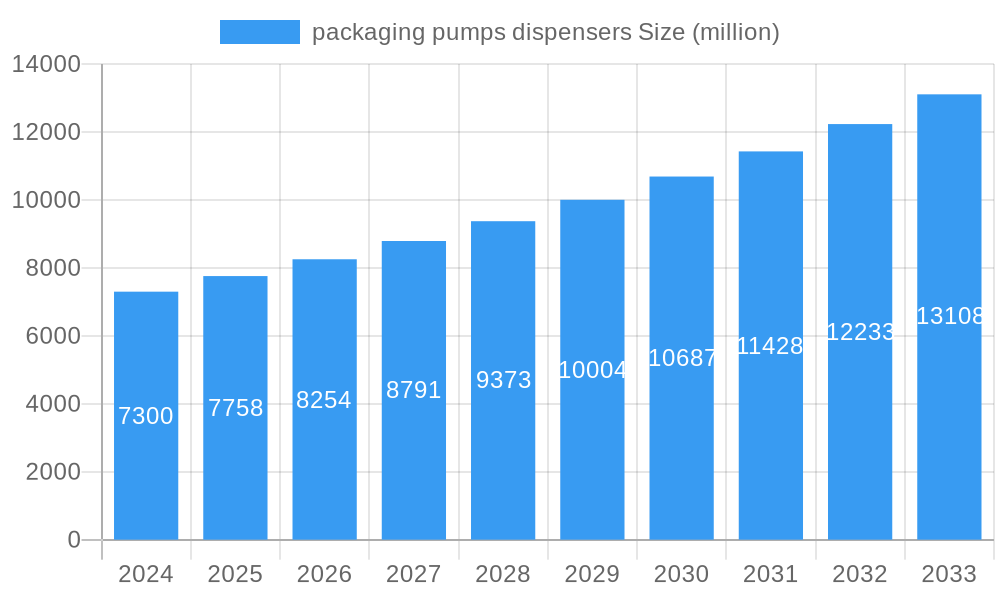
The global packaging pumps and dispensers market is poised for significant expansion, with an estimated market size of $7.30 billion in 2024. This growth is propelled by a CAGR of 6.23%, indicating a robust upward trajectory. The market is driven by increasing consumer demand for convenience and product usability across various sectors, including personal care, home care, pharmaceuticals, and food & beverages. Innovations in dispensing technology, such as the development of more precise, sustainable, and child-resistant mechanisms, are key drivers. Furthermore, the growing e-commerce sector, which relies heavily on secure and efficient product packaging for shipping and consumer appeal, also contributes substantially to this market's momentum. Manufacturers are focusing on lightweight materials, enhanced barrier properties, and aesthetic appeal to capture market share.
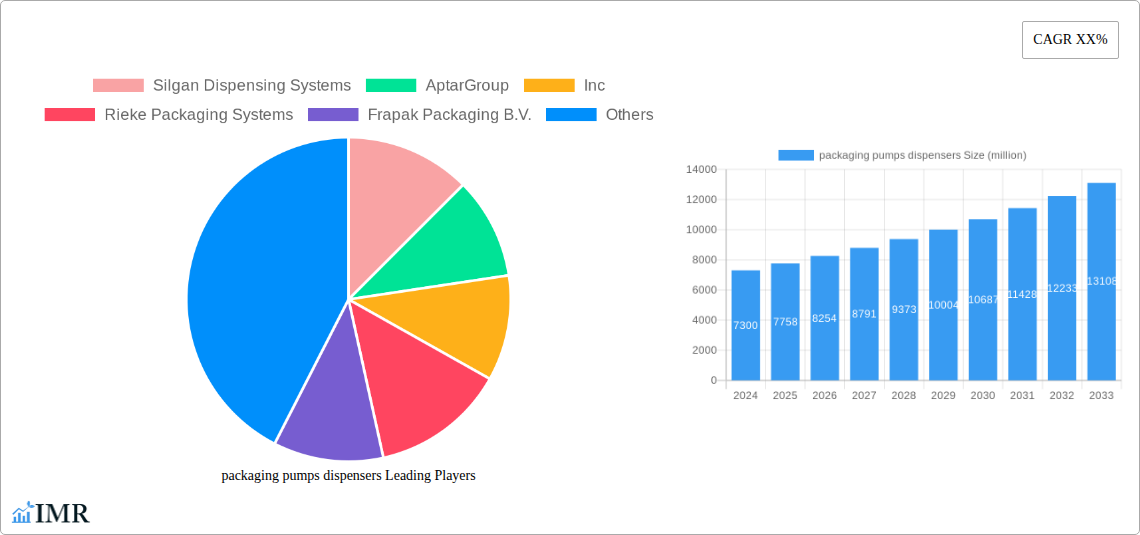
packaging pumps dispensers Market Size (In Billion)
The market is experiencing a strong trend towards eco-friendly and recyclable dispensing solutions, reflecting growing environmental consciousness among consumers and regulatory pressures. This includes a surge in demand for airless pumps, foam dispensers, and trigger sprayers that minimize product waste and offer a superior user experience. However, the market faces challenges such as fluctuating raw material costs and complex supply chain dynamics, which can impact production expenses and lead times. Despite these restraints, the continuous innovation in product design, coupled with strategic partnerships and expansions by key players like Silgan Dispensing Systems and AptarGroup, Inc., are expected to sustain the market's healthy growth throughout the forecast period, reaching an estimated value of over $12 billion by 2033.
packaging pumps dispensers Company Market Share
This comprehensive report provides an in-depth analysis of the global packaging pumps dispensers market, offering critical insights for industry stakeholders. Covering a study period from 2019 to 2033, with a base year of 2025, the report dissects market dynamics, growth trajectories, regional dominance, product innovations, and the competitive landscape. We explore the intricate interplay of technological advancements, consumer behavior shifts, and regulatory influences that shape this dynamic sector.
packaging pumps dispensers Market Dynamics & Structure
The global packaging pumps dispensers market exhibits a moderately concentrated structure, characterized by the presence of established global players and a growing number of regional manufacturers. Technological innovation remains a key driver, with advancements in material science, dispensing mechanisms (e.g., airless pumps, foam dispensers), and smart dispensing solutions fueling product development. Regulatory frameworks, particularly concerning product safety, material compliance, and sustainability, exert a significant influence on market entry and product design. Competitive product substitutes, such as traditional caps and trigger sprayers, continue to pose a challenge, but the superior user experience and product protection offered by pumps and dispensers are driving their adoption. End-user demographics are shifting, with increasing demand from a growing middle class in emerging economies and a desire for convenience and premium product presentation in developed markets. Mergers and acquisitions (M&A) activity is a notable trend, as larger companies seek to consolidate market share, acquire innovative technologies, and expand their geographical reach. For instance, the historical period saw an average of 5–7 significant M&A deals annually, with deal values ranging from $50 million to $500 million, indicative of strategic consolidation. Barriers to innovation include high R&D costs, complex patent landscapes, and the need for significant capital investment in advanced manufacturing capabilities.
packaging pumps dispensers Growth Trends & Insights
The packaging pumps dispensers market is poised for substantial growth, driven by an evolving consumer preference for convenience, hygiene, and controlled dispensing. The market size, projected to reach $XX billion units in 2025, is expected to witness a Compound Annual Growth Rate (CAGR) of approximately 6.5% during the forecast period of 2025–2033. Adoption rates are accelerating across various end-use industries, including personal care, home care, pharmaceuticals, and food and beverage. Technological disruptions, such as the increasing integration of IoT capabilities for smart dispensing, the development of sustainable and recyclable materials for pump components, and the rise of novel dispensing mechanisms for enhanced product application, are significantly impacting market evolution. Consumer behavior shifts, including a heightened focus on hygiene post-pandemic, a growing demand for premium and aesthetically pleasing packaging, and an increasing awareness of product waste reduction, further fuel the demand for advanced dispensing solutions. Market penetration for advanced pump and dispenser types, such as airless pumps, is projected to increase by 15% over the next decade. The shift towards e-commerce also necessitates robust and leak-proof packaging, further benefiting the pumps and dispensers segment. Historical data from 2019–2024 shows a consistent upward trend in demand, with a CAGR of 5.8% during this period, underscoring the resilience and sustained growth potential of this market.
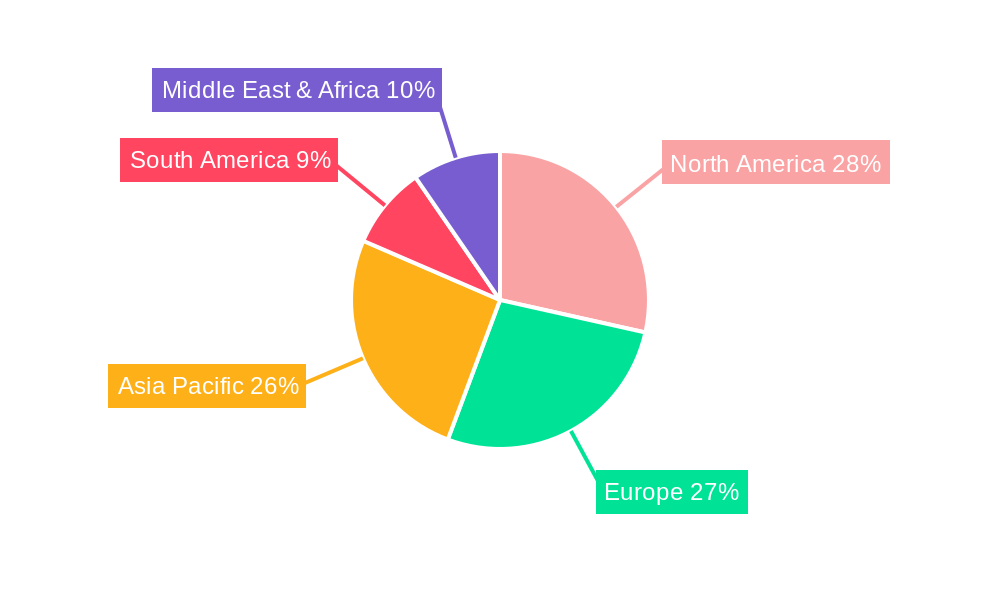
Dominant Regions, Countries, or Segments in packaging pumps dispensers
The personal care segment, particularly within the Asia Pacific region, is emerging as a dominant force driving growth in the global packaging pumps dispensers market. This dominance is attributed to a confluence of factors, including a rapidly expanding middle class with increased disposable income, a growing awareness of personal grooming and hygiene, and a burgeoning cosmetics and skincare industry. Countries like China, India, and Southeast Asian nations are witnessing unprecedented demand for products that utilize pumps and dispensers for lotions, creams, serums, and hair care products.
- Asia Pacific:
- Market Share: Projected to account for 35% of the global market by 2025.
- Key Drivers: Growing population, rising disposable incomes, increasing urbanization, and a strong preference for Western beauty and personal care products.
- Economic Policies: Favorable manufacturing policies and a robust supply chain infrastructure are attracting significant investment.
- Consumer Behavior: A rising demand for premium packaging that reflects product quality and efficacy.
Within the Types segment, lotion pumps continue to hold a significant market share due to their widespread application in skincare and personal care products. However, foam pumps are exhibiting the fastest growth trajectory, driven by their association with gentler product formulations, reduced product wastage, and a perceived higher level of hygiene, particularly in hand soaps and facial cleansers.
- Lotion Pumps:
- Dominance Factors: Established use in creams, lotions, and sanitizers.
- Growth Potential: Steady growth driven by established markets and staple product categories.
- Foam Pumps:
- Growth Drivers: Increasing consumer preference for eco-friendly and gentle formulations, innovation in dispenser design.
- Market Penetration: Rapidly gaining traction in hand wash, facial cleansing, and shave foam applications.
The Application of personal care products, encompassing skincare, haircare, and cosmetics, represents the largest and fastest-growing application area. This is directly linked to the expanding consumer base and their evolving preferences for sophisticated and convenient dispensing solutions. The increasing demand for sunscreens, serums, and specialized treatments further bolsters the need for precise and controlled dispensing mechanisms.
packaging pumps dispensers Product Landscape
Innovation in the packaging pumps dispensers market is characterized by the development of advanced dispensing technologies, enhanced material sustainability, and improved user experience. Key product innovations include the proliferation of airless pump systems that prevent oxidation and contamination, extend shelf life, and ensure complete product evacuation. The integration of smart features, such as dosage control and child-resistant mechanisms, is also gaining traction. Furthermore, manufacturers are increasingly focusing on the use of recycled plastics and biodegradable materials to meet growing environmental concerns. Unique selling propositions often lie in the ergonomic design, precise dispensing accuracy, and aesthetic appeal of the dispensers, catering to premium product positioning.
Key Drivers, Barriers & Challenges in packaging pumps dispensers
The packaging pumps dispensers market is primarily propelled by the escalating demand for convenience and hygiene across diverse consumer segments. Technological advancements in dispensing mechanisms, coupled with the growing emphasis on product preservation and controlled application, act as significant growth accelerators. The expanding e-commerce sector also necessitates robust packaging, further boosting demand.
- Key Drivers:
- Rising consumer demand for convenient and hygienic product packaging.
- Technological innovations in airless pumps, foam dispensers, and precision dispensing.
- Growth of the personal care, home care, and pharmaceutical industries.
- Increasing e-commerce penetration driving the need for secure packaging.
Key challenges and restraints include the volatile raw material costs, particularly for plastics, which can impact manufacturing profitability. Stringent regulatory requirements concerning material safety and recyclability can also pose compliance hurdles and increase development costs. Intense competition from established players and the threat of lower-cost alternatives from emerging markets present ongoing competitive pressures. Supply chain disruptions, as witnessed in recent global events, can lead to production delays and increased lead times.
- Key Challenges & Restraints:
- Fluctuations in raw material prices (e.g., plastics).
- Stringent environmental regulations and the push for sustainable materials.
- Intensified competition and price sensitivity.
- Supply chain vulnerabilities and logistical complexities.
Emerging Opportunities in packaging pumps dispensers
Emerging opportunities in the packaging pumps dispensers industry lie in the development of sustainable and biodegradable dispensing solutions that align with growing consumer environmental consciousness. The untapped potential in emerging economies, particularly in Africa and Latin America, presents significant growth avenues as disposable incomes rise and consumer preferences for sophisticated packaging evolve. Innovations in smart dispensing technology, offering features like dosage tracking and personalized application, represent a niche yet rapidly expanding opportunity. Furthermore, the increasing use of pumps and dispensers in the pharmaceutical and nutraceutical sectors for accurate dosage delivery of liquid medications and supplements is a significant growth area.
Growth Accelerators in the packaging pumps dispensers Industry
Long-term growth in the packaging pumps dispensers industry will be significantly accelerated by continued technological breakthroughs, particularly in the realm of sustainable materials and smart dispensing functionalities. Strategic partnerships between packaging manufacturers and consumer goods companies will foster innovation and accelerate product development cycles. Market expansion strategies, focusing on penetrating underserved geographical regions and catering to evolving consumer needs for health and wellness products, will also be critical growth catalysts. The increasing adoption of refillable packaging systems, integrated with advanced dispenser technologies, will further contribute to sustainable growth.
Key Players Shaping the packaging pumps dispensers Market
- Silgan Dispensing Systems
- AptarGroup,Inc
- Rieke Packaging Systems
- Frapak Packaging B.V.
- Guala Dispensing S.p.A.
- Mitani Valve Co. Ltd.
- Raepak Ltd.
- Taplast Srl
- Zhejiang Sun-Rain Industrial Co.,Ltd
- Wuxi Sunmart Science and Technology Co.,Ltd.
Notable Milestones in packaging pumps dispensers Sector
- 2020: Increased focus on hygiene-related product launches and innovations due to the global pandemic.
- 2021: Significant investment in R&D for sustainable and recyclable dispenser materials.
- 2022: Emergence of smart dispensing solutions with dosage tracking capabilities.
- 2023: Consolidation of market players through strategic acquisitions to expand product portfolios.
- 2024: Growing adoption of foam pumps in consumer goods for enhanced user experience and product efficiency.
- 2025 (Estimated): Launch of new bio-based plastic dispensers by key manufacturers.
In-Depth packaging pumps dispensers Market Outlook
The future outlook for the packaging pumps dispensers market is exceptionally positive, driven by a confluence of sustained demand from core sectors and emerging opportunities. Growth accelerators such as the relentless pursuit of sustainable packaging solutions, the integration of intelligent dispensing technologies, and the expanding reach into developing economies will propel the market forward. Strategic collaborations and a proactive approach to regulatory changes will be crucial for market players to capitalize on the projected growth. The industry is set to witness a paradigm shift towards more eco-conscious and technologically advanced dispensing solutions, ensuring continued innovation and market expansion in the years to come.
packaging pumps dispensers Segmentation
- 1. Application
- 2. Types
packaging pumps dispensers Segmentation By Geography
-
1. North America
- 1.1. United States
- 1.2. Canada
- 1.3. Mexico
-
2. South America
- 2.1. Brazil
- 2.2. Argentina
- 2.3. Rest of South America
-
3. Europe
- 3.1. United Kingdom
- 3.2. Germany
- 3.3. France
- 3.4. Italy
- 3.5. Spain
- 3.6. Russia
- 3.7. Benelux
- 3.8. Nordics
- 3.9. Rest of Europe
-
4. Middle East & Africa
- 4.1. Turkey
- 4.2. Israel
- 4.3. GCC
- 4.4. North Africa
- 4.5. South Africa
- 4.6. Rest of Middle East & Africa
-
5. Asia Pacific
- 5.1. China
- 5.2. India
- 5.3. Japan
- 5.4. South Korea
- 5.5. ASEAN
- 5.6. Oceania
- 5.7. Rest of Asia Pacific
packaging pumps dispensers Regional Market Share
Geographic Coverage of packaging pumps dispensers
packaging pumps dispensers REPORT HIGHLIGHTS
| Aspects | Details |
|---|---|
| Study Period | 2020-2034 |
| Base Year | 2025 |
| Estimated Year | 2026 |
| Forecast Period | 2026-2034 |
| Historical Period | 2020-2025 |
| Growth Rate | CAGR of 6.23% from 2020-2034 |
| Segmentation |
|
Table of Contents
- 1. Introduction
- 1.1. Research Scope
- 1.2. Market Segmentation
- 1.3. Research Methodology
- 1.4. Definitions and Assumptions
- 2. Executive Summary
- 2.1. Introduction
- 3. Market Dynamics
- 3.1. Introduction
- 3.2. Market Drivers
- 3.3. Market Restrains
- 3.4. Market Trends
- 4. Market Factor Analysis
- 4.1. Porters Five Forces
- 4.2. Supply/Value Chain
- 4.3. PESTEL analysis
- 4.4. Market Entropy
- 4.5. Patent/Trademark Analysis
- 5. Global packaging pumps dispensers Analysis, Insights and Forecast, 2020-2032
- 5.1. Market Analysis, Insights and Forecast - by Application
- 5.2. Market Analysis, Insights and Forecast - by Types
- 5.3. Market Analysis, Insights and Forecast - by Region
- 5.3.1. North America
- 5.3.2. South America
- 5.3.3. Europe
- 5.3.4. Middle East & Africa
- 5.3.5. Asia Pacific
- 5.1. Market Analysis, Insights and Forecast - by Application
- 6. North America packaging pumps dispensers Analysis, Insights and Forecast, 2020-2032
- 6.1. Market Analysis, Insights and Forecast - by Application
- 6.2. Market Analysis, Insights and Forecast - by Types
- 6.1. Market Analysis, Insights and Forecast - by Application
- 7. South America packaging pumps dispensers Analysis, Insights and Forecast, 2020-2032
- 7.1. Market Analysis, Insights and Forecast - by Application
- 7.2. Market Analysis, Insights and Forecast - by Types
- 7.1. Market Analysis, Insights and Forecast - by Application
- 8. Europe packaging pumps dispensers Analysis, Insights and Forecast, 2020-2032
- 8.1. Market Analysis, Insights and Forecast - by Application
- 8.2. Market Analysis, Insights and Forecast - by Types
- 8.1. Market Analysis, Insights and Forecast - by Application
- 9. Middle East & Africa packaging pumps dispensers Analysis, Insights and Forecast, 2020-2032
- 9.1. Market Analysis, Insights and Forecast - by Application
- 9.2. Market Analysis, Insights and Forecast - by Types
- 9.1. Market Analysis, Insights and Forecast - by Application
- 10. Asia Pacific packaging pumps dispensers Analysis, Insights and Forecast, 2020-2032
- 10.1. Market Analysis, Insights and Forecast - by Application
- 10.2. Market Analysis, Insights and Forecast - by Types
- 10.1. Market Analysis, Insights and Forecast - by Application
- 11. Competitive Analysis
- 11.1. Global Market Share Analysis 2025
- 11.2. Company Profiles
- 11.2.1 Silgan Dispensing Systems
- 11.2.1.1. Overview
- 11.2.1.2. Products
- 11.2.1.3. SWOT Analysis
- 11.2.1.4. Recent Developments
- 11.2.1.5. Financials (Based on Availability)
- 11.2.2 AptarGroup
- 11.2.2.1. Overview
- 11.2.2.2. Products
- 11.2.2.3. SWOT Analysis
- 11.2.2.4. Recent Developments
- 11.2.2.5. Financials (Based on Availability)
- 11.2.3 Inc
- 11.2.3.1. Overview
- 11.2.3.2. Products
- 11.2.3.3. SWOT Analysis
- 11.2.3.4. Recent Developments
- 11.2.3.5. Financials (Based on Availability)
- 11.2.4 Rieke Packaging Systems
- 11.2.4.1. Overview
- 11.2.4.2. Products
- 11.2.4.3. SWOT Analysis
- 11.2.4.4. Recent Developments
- 11.2.4.5. Financials (Based on Availability)
- 11.2.5 Frapak Packaging B.V.
- 11.2.5.1. Overview
- 11.2.5.2. Products
- 11.2.5.3. SWOT Analysis
- 11.2.5.4. Recent Developments
- 11.2.5.5. Financials (Based on Availability)
- 11.2.6 Guala Dispensing S.p.A.
- 11.2.6.1. Overview
- 11.2.6.2. Products
- 11.2.6.3. SWOT Analysis
- 11.2.6.4. Recent Developments
- 11.2.6.5. Financials (Based on Availability)
- 11.2.7 Mitani Valve Co. Ltd.
- 11.2.7.1. Overview
- 11.2.7.2. Products
- 11.2.7.3. SWOT Analysis
- 11.2.7.4. Recent Developments
- 11.2.7.5. Financials (Based on Availability)
- 11.2.8 Raepak Ltd.
- 11.2.8.1. Overview
- 11.2.8.2. Products
- 11.2.8.3. SWOT Analysis
- 11.2.8.4. Recent Developments
- 11.2.8.5. Financials (Based on Availability)
- 11.2.9 Taplast Srl
- 11.2.9.1. Overview
- 11.2.9.2. Products
- 11.2.9.3. SWOT Analysis
- 11.2.9.4. Recent Developments
- 11.2.9.5. Financials (Based on Availability)
- 11.2.10 Zhejiang Sun-Rain Industrial Co.
- 11.2.10.1. Overview
- 11.2.10.2. Products
- 11.2.10.3. SWOT Analysis
- 11.2.10.4. Recent Developments
- 11.2.10.5. Financials (Based on Availability)
- 11.2.11 Ltd
- 11.2.11.1. Overview
- 11.2.11.2. Products
- 11.2.11.3. SWOT Analysis
- 11.2.11.4. Recent Developments
- 11.2.11.5. Financials (Based on Availability)
- 11.2.12 Wuxi Sunmart Science and Technology Co.
- 11.2.12.1. Overview
- 11.2.12.2. Products
- 11.2.12.3. SWOT Analysis
- 11.2.12.4. Recent Developments
- 11.2.12.5. Financials (Based on Availability)
- 11.2.13 Ltd.
- 11.2.13.1. Overview
- 11.2.13.2. Products
- 11.2.13.3. SWOT Analysis
- 11.2.13.4. Recent Developments
- 11.2.13.5. Financials (Based on Availability)
- 11.2.1 Silgan Dispensing Systems
List of Figures
- Figure 1: Global packaging pumps dispensers Revenue Breakdown (undefined, %) by Region 2025 & 2033
- Figure 2: Global packaging pumps dispensers Volume Breakdown (K, %) by Region 2025 & 2033
- Figure 3: North America packaging pumps dispensers Revenue (undefined), by Application 2025 & 2033
- Figure 4: North America packaging pumps dispensers Volume (K), by Application 2025 & 2033
- Figure 5: North America packaging pumps dispensers Revenue Share (%), by Application 2025 & 2033
- Figure 6: North America packaging pumps dispensers Volume Share (%), by Application 2025 & 2033
- Figure 7: North America packaging pumps dispensers Revenue (undefined), by Types 2025 & 2033
- Figure 8: North America packaging pumps dispensers Volume (K), by Types 2025 & 2033
- Figure 9: North America packaging pumps dispensers Revenue Share (%), by Types 2025 & 2033
- Figure 10: North America packaging pumps dispensers Volume Share (%), by Types 2025 & 2033
- Figure 11: North America packaging pumps dispensers Revenue (undefined), by Country 2025 & 2033
- Figure 12: North America packaging pumps dispensers Volume (K), by Country 2025 & 2033
- Figure 13: North America packaging pumps dispensers Revenue Share (%), by Country 2025 & 2033
- Figure 14: North America packaging pumps dispensers Volume Share (%), by Country 2025 & 2033
- Figure 15: South America packaging pumps dispensers Revenue (undefined), by Application 2025 & 2033
- Figure 16: South America packaging pumps dispensers Volume (K), by Application 2025 & 2033
- Figure 17: South America packaging pumps dispensers Revenue Share (%), by Application 2025 & 2033
- Figure 18: South America packaging pumps dispensers Volume Share (%), by Application 2025 & 2033
- Figure 19: South America packaging pumps dispensers Revenue (undefined), by Types 2025 & 2033
- Figure 20: South America packaging pumps dispensers Volume (K), by Types 2025 & 2033
- Figure 21: South America packaging pumps dispensers Revenue Share (%), by Types 2025 & 2033
- Figure 22: South America packaging pumps dispensers Volume Share (%), by Types 2025 & 2033
- Figure 23: South America packaging pumps dispensers Revenue (undefined), by Country 2025 & 2033
- Figure 24: South America packaging pumps dispensers Volume (K), by Country 2025 & 2033
- Figure 25: South America packaging pumps dispensers Revenue Share (%), by Country 2025 & 2033
- Figure 26: South America packaging pumps dispensers Volume Share (%), by Country 2025 & 2033
- Figure 27: Europe packaging pumps dispensers Revenue (undefined), by Application 2025 & 2033
- Figure 28: Europe packaging pumps dispensers Volume (K), by Application 2025 & 2033
- Figure 29: Europe packaging pumps dispensers Revenue Share (%), by Application 2025 & 2033
- Figure 30: Europe packaging pumps dispensers Volume Share (%), by Application 2025 & 2033
- Figure 31: Europe packaging pumps dispensers Revenue (undefined), by Types 2025 & 2033
- Figure 32: Europe packaging pumps dispensers Volume (K), by Types 2025 & 2033
- Figure 33: Europe packaging pumps dispensers Revenue Share (%), by Types 2025 & 2033
- Figure 34: Europe packaging pumps dispensers Volume Share (%), by Types 2025 & 2033
- Figure 35: Europe packaging pumps dispensers Revenue (undefined), by Country 2025 & 2033
- Figure 36: Europe packaging pumps dispensers Volume (K), by Country 2025 & 2033
- Figure 37: Europe packaging pumps dispensers Revenue Share (%), by Country 2025 & 2033
- Figure 38: Europe packaging pumps dispensers Volume Share (%), by Country 2025 & 2033
- Figure 39: Middle East & Africa packaging pumps dispensers Revenue (undefined), by Application 2025 & 2033
- Figure 40: Middle East & Africa packaging pumps dispensers Volume (K), by Application 2025 & 2033
- Figure 41: Middle East & Africa packaging pumps dispensers Revenue Share (%), by Application 2025 & 2033
- Figure 42: Middle East & Africa packaging pumps dispensers Volume Share (%), by Application 2025 & 2033
- Figure 43: Middle East & Africa packaging pumps dispensers Revenue (undefined), by Types 2025 & 2033
- Figure 44: Middle East & Africa packaging pumps dispensers Volume (K), by Types 2025 & 2033
- Figure 45: Middle East & Africa packaging pumps dispensers Revenue Share (%), by Types 2025 & 2033
- Figure 46: Middle East & Africa packaging pumps dispensers Volume Share (%), by Types 2025 & 2033
- Figure 47: Middle East & Africa packaging pumps dispensers Revenue (undefined), by Country 2025 & 2033
- Figure 48: Middle East & Africa packaging pumps dispensers Volume (K), by Country 2025 & 2033
- Figure 49: Middle East & Africa packaging pumps dispensers Revenue Share (%), by Country 2025 & 2033
- Figure 50: Middle East & Africa packaging pumps dispensers Volume Share (%), by Country 2025 & 2033
- Figure 51: Asia Pacific packaging pumps dispensers Revenue (undefined), by Application 2025 & 2033
- Figure 52: Asia Pacific packaging pumps dispensers Volume (K), by Application 2025 & 2033
- Figure 53: Asia Pacific packaging pumps dispensers Revenue Share (%), by Application 2025 & 2033
- Figure 54: Asia Pacific packaging pumps dispensers Volume Share (%), by Application 2025 & 2033
- Figure 55: Asia Pacific packaging pumps dispensers Revenue (undefined), by Types 2025 & 2033
- Figure 56: Asia Pacific packaging pumps dispensers Volume (K), by Types 2025 & 2033
- Figure 57: Asia Pacific packaging pumps dispensers Revenue Share (%), by Types 2025 & 2033
- Figure 58: Asia Pacific packaging pumps dispensers Volume Share (%), by Types 2025 & 2033
- Figure 59: Asia Pacific packaging pumps dispensers Revenue (undefined), by Country 2025 & 2033
- Figure 60: Asia Pacific packaging pumps dispensers Volume (K), by Country 2025 & 2033
- Figure 61: Asia Pacific packaging pumps dispensers Revenue Share (%), by Country 2025 & 2033
- Figure 62: Asia Pacific packaging pumps dispensers Volume Share (%), by Country 2025 & 2033
List of Tables
- Table 1: Global packaging pumps dispensers Revenue undefined Forecast, by Application 2020 & 2033
- Table 2: Global packaging pumps dispensers Volume K Forecast, by Application 2020 & 2033
- Table 3: Global packaging pumps dispensers Revenue undefined Forecast, by Types 2020 & 2033
- Table 4: Global packaging pumps dispensers Volume K Forecast, by Types 2020 & 2033
- Table 5: Global packaging pumps dispensers Revenue undefined Forecast, by Region 2020 & 2033
- Table 6: Global packaging pumps dispensers Volume K Forecast, by Region 2020 & 2033
- Table 7: Global packaging pumps dispensers Revenue undefined Forecast, by Application 2020 & 2033
- Table 8: Global packaging pumps dispensers Volume K Forecast, by Application 2020 & 2033
- Table 9: Global packaging pumps dispensers Revenue undefined Forecast, by Types 2020 & 2033
- Table 10: Global packaging pumps dispensers Volume K Forecast, by Types 2020 & 2033
- Table 11: Global packaging pumps dispensers Revenue undefined Forecast, by Country 2020 & 2033
- Table 12: Global packaging pumps dispensers Volume K Forecast, by Country 2020 & 2033
- Table 13: United States packaging pumps dispensers Revenue (undefined) Forecast, by Application 2020 & 2033
- Table 14: United States packaging pumps dispensers Volume (K) Forecast, by Application 2020 & 2033
- Table 15: Canada packaging pumps dispensers Revenue (undefined) Forecast, by Application 2020 & 2033
- Table 16: Canada packaging pumps dispensers Volume (K) Forecast, by Application 2020 & 2033
- Table 17: Mexico packaging pumps dispensers Revenue (undefined) Forecast, by Application 2020 & 2033
- Table 18: Mexico packaging pumps dispensers Volume (K) Forecast, by Application 2020 & 2033
- Table 19: Global packaging pumps dispensers Revenue undefined Forecast, by Application 2020 & 2033
- Table 20: Global packaging pumps dispensers Volume K Forecast, by Application 2020 & 2033
- Table 21: Global packaging pumps dispensers Revenue undefined Forecast, by Types 2020 & 2033
- Table 22: Global packaging pumps dispensers Volume K Forecast, by Types 2020 & 2033
- Table 23: Global packaging pumps dispensers Revenue undefined Forecast, by Country 2020 & 2033
- Table 24: Global packaging pumps dispensers Volume K Forecast, by Country 2020 & 2033
- Table 25: Brazil packaging pumps dispensers Revenue (undefined) Forecast, by Application 2020 & 2033
- Table 26: Brazil packaging pumps dispensers Volume (K) Forecast, by Application 2020 & 2033
- Table 27: Argentina packaging pumps dispensers Revenue (undefined) Forecast, by Application 2020 & 2033
- Table 28: Argentina packaging pumps dispensers Volume (K) Forecast, by Application 2020 & 2033
- Table 29: Rest of South America packaging pumps dispensers Revenue (undefined) Forecast, by Application 2020 & 2033
- Table 30: Rest of South America packaging pumps dispensers Volume (K) Forecast, by Application 2020 & 2033
- Table 31: Global packaging pumps dispensers Revenue undefined Forecast, by Application 2020 & 2033
- Table 32: Global packaging pumps dispensers Volume K Forecast, by Application 2020 & 2033
- Table 33: Global packaging pumps dispensers Revenue undefined Forecast, by Types 2020 & 2033
- Table 34: Global packaging pumps dispensers Volume K Forecast, by Types 2020 & 2033
- Table 35: Global packaging pumps dispensers Revenue undefined Forecast, by Country 2020 & 2033
- Table 36: Global packaging pumps dispensers Volume K Forecast, by Country 2020 & 2033
- Table 37: United Kingdom packaging pumps dispensers Revenue (undefined) Forecast, by Application 2020 & 2033
- Table 38: United Kingdom packaging pumps dispensers Volume (K) Forecast, by Application 2020 & 2033
- Table 39: Germany packaging pumps dispensers Revenue (undefined) Forecast, by Application 2020 & 2033
- Table 40: Germany packaging pumps dispensers Volume (K) Forecast, by Application 2020 & 2033
- Table 41: France packaging pumps dispensers Revenue (undefined) Forecast, by Application 2020 & 2033
- Table 42: France packaging pumps dispensers Volume (K) Forecast, by Application 2020 & 2033
- Table 43: Italy packaging pumps dispensers Revenue (undefined) Forecast, by Application 2020 & 2033
- Table 44: Italy packaging pumps dispensers Volume (K) Forecast, by Application 2020 & 2033
- Table 45: Spain packaging pumps dispensers Revenue (undefined) Forecast, by Application 2020 & 2033
- Table 46: Spain packaging pumps dispensers Volume (K) Forecast, by Application 2020 & 2033
- Table 47: Russia packaging pumps dispensers Revenue (undefined) Forecast, by Application 2020 & 2033
- Table 48: Russia packaging pumps dispensers Volume (K) Forecast, by Application 2020 & 2033
- Table 49: Benelux packaging pumps dispensers Revenue (undefined) Forecast, by Application 2020 & 2033
- Table 50: Benelux packaging pumps dispensers Volume (K) Forecast, by Application 2020 & 2033
- Table 51: Nordics packaging pumps dispensers Revenue (undefined) Forecast, by Application 2020 & 2033
- Table 52: Nordics packaging pumps dispensers Volume (K) Forecast, by Application 2020 & 2033
- Table 53: Rest of Europe packaging pumps dispensers Revenue (undefined) Forecast, by Application 2020 & 2033
- Table 54: Rest of Europe packaging pumps dispensers Volume (K) Forecast, by Application 2020 & 2033
- Table 55: Global packaging pumps dispensers Revenue undefined Forecast, by Application 2020 & 2033
- Table 56: Global packaging pumps dispensers Volume K Forecast, by Application 2020 & 2033
- Table 57: Global packaging pumps dispensers Revenue undefined Forecast, by Types 2020 & 2033
- Table 58: Global packaging pumps dispensers Volume K Forecast, by Types 2020 & 2033
- Table 59: Global packaging pumps dispensers Revenue undefined Forecast, by Country 2020 & 2033
- Table 60: Global packaging pumps dispensers Volume K Forecast, by Country 2020 & 2033
- Table 61: Turkey packaging pumps dispensers Revenue (undefined) Forecast, by Application 2020 & 2033
- Table 62: Turkey packaging pumps dispensers Volume (K) Forecast, by Application 2020 & 2033
- Table 63: Israel packaging pumps dispensers Revenue (undefined) Forecast, by Application 2020 & 2033
- Table 64: Israel packaging pumps dispensers Volume (K) Forecast, by Application 2020 & 2033
- Table 65: GCC packaging pumps dispensers Revenue (undefined) Forecast, by Application 2020 & 2033
- Table 66: GCC packaging pumps dispensers Volume (K) Forecast, by Application 2020 & 2033
- Table 67: North Africa packaging pumps dispensers Revenue (undefined) Forecast, by Application 2020 & 2033
- Table 68: North Africa packaging pumps dispensers Volume (K) Forecast, by Application 2020 & 2033
- Table 69: South Africa packaging pumps dispensers Revenue (undefined) Forecast, by Application 2020 & 2033
- Table 70: South Africa packaging pumps dispensers Volume (K) Forecast, by Application 2020 & 2033
- Table 71: Rest of Middle East & Africa packaging pumps dispensers Revenue (undefined) Forecast, by Application 2020 & 2033
- Table 72: Rest of Middle East & Africa packaging pumps dispensers Volume (K) Forecast, by Application 2020 & 2033
- Table 73: Global packaging pumps dispensers Revenue undefined Forecast, by Application 2020 & 2033
- Table 74: Global packaging pumps dispensers Volume K Forecast, by Application 2020 & 2033
- Table 75: Global packaging pumps dispensers Revenue undefined Forecast, by Types 2020 & 2033
- Table 76: Global packaging pumps dispensers Volume K Forecast, by Types 2020 & 2033
- Table 77: Global packaging pumps dispensers Revenue undefined Forecast, by Country 2020 & 2033
- Table 78: Global packaging pumps dispensers Volume K Forecast, by Country 2020 & 2033
- Table 79: China packaging pumps dispensers Revenue (undefined) Forecast, by Application 2020 & 2033
- Table 80: China packaging pumps dispensers Volume (K) Forecast, by Application 2020 & 2033
- Table 81: India packaging pumps dispensers Revenue (undefined) Forecast, by Application 2020 & 2033
- Table 82: India packaging pumps dispensers Volume (K) Forecast, by Application 2020 & 2033
- Table 83: Japan packaging pumps dispensers Revenue (undefined) Forecast, by Application 2020 & 2033
- Table 84: Japan packaging pumps dispensers Volume (K) Forecast, by Application 2020 & 2033
- Table 85: South Korea packaging pumps dispensers Revenue (undefined) Forecast, by Application 2020 & 2033
- Table 86: South Korea packaging pumps dispensers Volume (K) Forecast, by Application 2020 & 2033
- Table 87: ASEAN packaging pumps dispensers Revenue (undefined) Forecast, by Application 2020 & 2033
- Table 88: ASEAN packaging pumps dispensers Volume (K) Forecast, by Application 2020 & 2033
- Table 89: Oceania packaging pumps dispensers Revenue (undefined) Forecast, by Application 2020 & 2033
- Table 90: Oceania packaging pumps dispensers Volume (K) Forecast, by Application 2020 & 2033
- Table 91: Rest of Asia Pacific packaging pumps dispensers Revenue (undefined) Forecast, by Application 2020 & 2033
- Table 92: Rest of Asia Pacific packaging pumps dispensers Volume (K) Forecast, by Application 2020 & 2033
Frequently Asked Questions
1. What is the projected Compound Annual Growth Rate (CAGR) of the packaging pumps dispensers?
The projected CAGR is approximately 6.23%.
2. Which companies are prominent players in the packaging pumps dispensers?
Key companies in the market include Silgan Dispensing Systems, AptarGroup, Inc, Rieke Packaging Systems, Frapak Packaging B.V., Guala Dispensing S.p.A., Mitani Valve Co. Ltd., Raepak Ltd., Taplast Srl, Zhejiang Sun-Rain Industrial Co., Ltd, Wuxi Sunmart Science and Technology Co., Ltd..
3. What are the main segments of the packaging pumps dispensers?
The market segments include Application, Types.
4. Can you provide details about the market size?
The market size is estimated to be USD XXX N/A as of 2022.
5. What are some drivers contributing to market growth?
N/A
6. What are the notable trends driving market growth?
N/A
7. Are there any restraints impacting market growth?
N/A
8. Can you provide examples of recent developments in the market?
N/A
9. What pricing options are available for accessing the report?
Pricing options include single-user, multi-user, and enterprise licenses priced at USD 4350.00, USD 6525.00, and USD 8700.00 respectively.
10. Is the market size provided in terms of value or volume?
The market size is provided in terms of value, measured in N/A and volume, measured in K.
11. Are there any specific market keywords associated with the report?
Yes, the market keyword associated with the report is "packaging pumps dispensers," which aids in identifying and referencing the specific market segment covered.
12. How do I determine which pricing option suits my needs best?
The pricing options vary based on user requirements and access needs. Individual users may opt for single-user licenses, while businesses requiring broader access may choose multi-user or enterprise licenses for cost-effective access to the report.
13. Are there any additional resources or data provided in the packaging pumps dispensers report?
While the report offers comprehensive insights, it's advisable to review the specific contents or supplementary materials provided to ascertain if additional resources or data are available.
14. How can I stay updated on further developments or reports in the packaging pumps dispensers?
To stay informed about further developments, trends, and reports in the packaging pumps dispensers, consider subscribing to industry newsletters, following relevant companies and organizations, or regularly checking reputable industry news sources and publications.
Methodology
Step 1 - Identification of Relevant Samples Size from Population Database


Step 2 - Approaches for Defining Global Market Size (Value, Volume* & Price*)

Note*: In applicable scenarios
Step 3 - Data Sources
Primary Research
- Web Analytics
- Survey Reports
- Research Institute
- Latest Research Reports
- Opinion Leaders
Secondary Research
- Annual Reports
- White Paper
- Latest Press Release
- Industry Association
- Paid Database
- Investor Presentations

Step 4 - Data Triangulation
Involves using different sources of information in order to increase the validity of a study
These sources are likely to be stakeholders in a program - participants, other researchers, program staff, other community members, and so on.
Then we put all data in single framework & apply various statistical tools to find out the dynamic on the market.
During the analysis stage, feedback from the stakeholder groups would be compared to determine areas of agreement as well as areas of divergence