

Key Insights
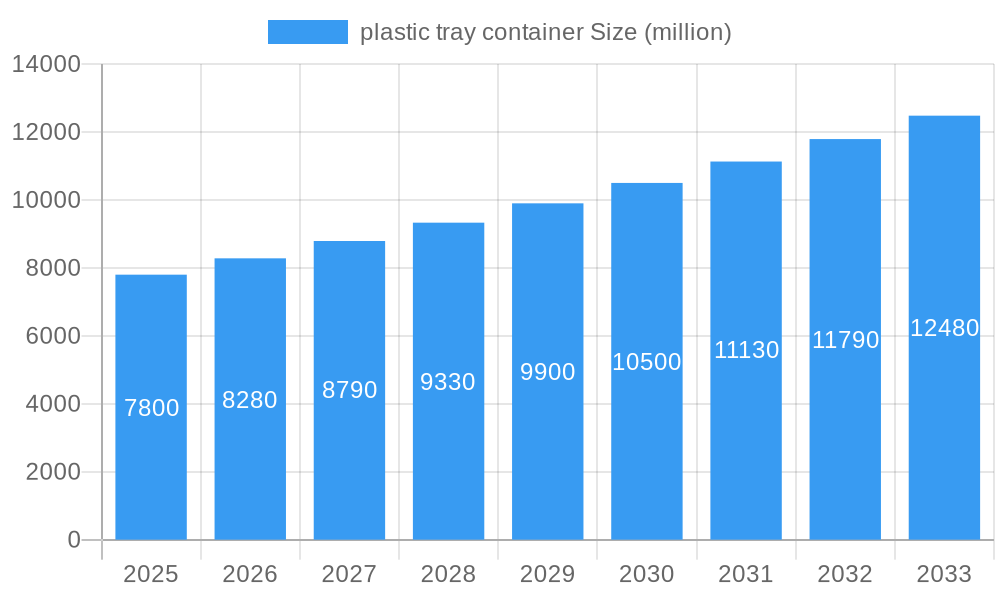
The global plastic tray container market is projected for substantial growth, expected to reach a market size of 43.64 billion by 2025, with a Compound Annual Growth Rate (CAGR) of 6.61%. This expansion is driven by increasing demand for efficient, durable, and cost-effective packaging solutions across diverse industries. Key factors include the rapid growth of e-commerce, necessitating secure and stackable shipping containers, and the continuous pursuit of supply chain optimization and enhanced product protection during transit. The food and beverage sector's ongoing need for hygienic, temperature-controlled packaging, coupled with automotive industry requirements for robust components and storage, are also significant contributors to market expansion. The inherent advantages of plastic tray containers, such as their lightweight nature, resistance to moisture and chemicals, and reusability, further solidify their market position against traditional packaging alternatives.
plastic tray container Market Size (In Billion)
The market is influenced by evolving trends, notably a strong emphasis on sustainable and recyclable plastic materials, driven by environmental regulations and consumer demand. Innovations in material science are enabling the development of lighter yet stronger plastic composites and the increased incorporation of recycled content, aligning with the growing preference for eco-friendly packaging. The integration of smart technologies, including RFID for inventory management and traceability, represents another emerging trend. However, the market also faces restraints such as fluctuating raw material prices, particularly for virgin plastics, and stringent regional regulations concerning plastic waste disposal and single-use plastics. Despite these challenges, strategic collaborations and mergers are anticipated to foster innovation and broaden market reach, ensuring sustained growth in the plastic tray container sector.
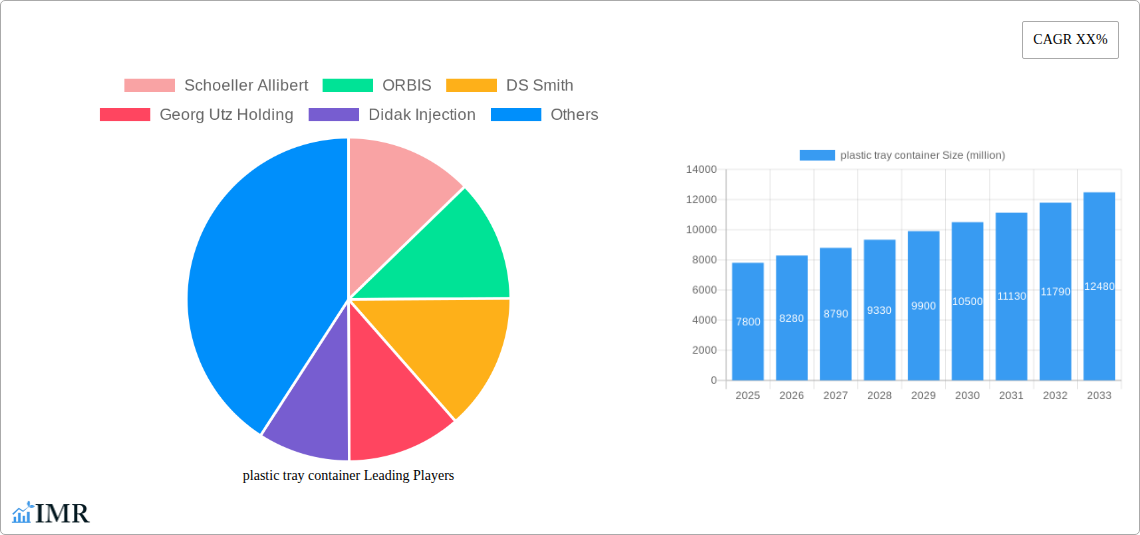
plastic tray container Company Market Share
This report offers a comprehensive analysis of the global plastic tray container market, providing essential data and strategic foresight for industry stakeholders. The analysis covers the period from 2019 to 2033, with detailed segmentation by application (e.g., food & beverage, pharmaceuticals, automotive, industrial) and type (e.g., stackable, nestable, display, returnable transport packaging). The report forecasts market growth from the base year 2025 through the forecast period, building on historical data. It examines market dynamics, including concentration levels, technological drivers, regulatory frameworks, and competitive substitutes. Key growth trends, market size evolution, adoption rates, technological disruptions, and shifts in consumer behavior are explored. The report identifies dominant regions and segments with significant market share and growth potential, alongside an analysis of the product landscape, innovations, and applications. Critical insights into key drivers, barriers, challenges, and emerging opportunities are provided. Featuring contributions from leading players such as Schoeller Allibert, ORBIS, DS Smith, and others, this report is an invaluable resource for understanding and navigating the future of the plastic tray container industry. All quantitative data is presented in billion units for clarity.
plastic tray container Market Dynamics & Structure
The global plastic tray container market is characterized by a moderately concentrated structure, with a few key global players dominating, alongside a significant number of regional and specialized manufacturers. This dynamic is influenced by substantial capital investment requirements for advanced injection molding technology and a robust supply chain network. Technological innovation is a primary driver, with ongoing advancements in material science leading to lighter, stronger, and more sustainable plastic tray solutions, including increased use of recycled and bio-based plastics. Regulatory frameworks, particularly concerning food safety, environmental impact, and waste management (e.g., Extended Producer Responsibility schemes), are increasingly shaping product design and material choices. Competitive product substitutes, such as cardboard or metal containers, exist but often fall short in terms of durability, moisture resistance, and reusability, especially in demanding sectors like logistics and fresh produce. End-user demographics are shifting towards greater demand for customized solutions, traceability features, and environmentally friendly packaging options. Mergers and acquisitions (M&A) trends are evident, as larger companies seek to expand their product portfolios, geographical reach, and technological capabilities. For instance, recent M&A activity has focused on consolidating market share in high-growth regions and acquiring innovative material technologies. Barriers to entry include high initial investment costs, established brand loyalty of incumbent players, and the complexity of navigating diverse international regulatory standards.
- Market Concentration: Moderate to high, with leading companies holding significant market share.
- Technological Innovation Drivers: Advancements in polymers (e.g., high-performance polyolefins, biodegradable plastics), automation in manufacturing, and integrated RFID/IoT for tracking.
- Regulatory Frameworks: Increasing stringency in food contact regulations, sustainability mandates, and import/export standards.
- Competitive Product Substitutes: Cardboard trays (lower cost, single-use), metal pallets (heavy, corrosion-prone), and wood crates (splintering, hygiene concerns).
- End-User Demographics: Growing demand from e-commerce, direct-to-consumer models, and the pharmaceutical sector for sterile and tamper-evident solutions.
- M&A Trends: Consolidation for economies of scale, vertical integration, and expansion into emerging markets. Deal volumes in the past three years have seen a consistent upward trend, with an estimated 15 major acquisitions and 30 smaller strategic partnerships.
plastic tray container Growth Trends & Insights
The plastic tray container market is poised for robust growth, driven by an expanding global economy, increasing industrialization, and evolving consumer demands for efficient and sustainable packaging solutions. The market size is projected to witness a Compound Annual Growth Rate (CAGR) of approximately 5.8% from 2025 to 2033, reaching an estimated market valuation of over $35,000 million units by the end of the forecast period. This growth trajectory is underpinned by the increasing adoption of plastic trays across diverse sectors, including the food and beverage industry, where their hygiene, durability, and reusability offer significant advantages over traditional packaging. The pharmaceutical sector's stringent requirements for sterile and secure packaging further fuel demand for specialized plastic trays.
Technological disruptions, such as the development of lightweight yet highly durable composite materials and advancements in manufacturing processes allowing for greater customization and intricate designs, are enhancing the performance and appeal of plastic tray containers. Furthermore, the rising emphasis on circular economy principles and sustainability is spurring innovation in recycled and recyclable plastic tray solutions, aligning with global environmental initiatives and consumer preferences for eco-friendly products. The shift towards e-commerce and a more efficient global supply chain necessitates robust, stackable, and easily transportable packaging solutions, a role that plastic tray containers are ideally suited to fulfill. This includes the growing demand for returnable transport packaging (RTP) systems, which reduce waste and operational costs. Consumer behavior is also playing a pivotal role; end-users are increasingly seeking products that are not only functional and cost-effective but also environmentally responsible. This has led to a surge in demand for plastic trays made from recycled content or designed for multiple reuse cycles. The market penetration of specialized plastic trays, particularly in emerging economies undergoing rapid industrial development and infrastructure upgrades, is also a significant growth driver. Adoption rates are accelerated by the clear economic benefits offered by these solutions, such as reduced product damage during transit and lower overall logistics costs when compared to single-use alternatives. The ongoing evolution of end-user industries, from advancements in food processing and cold chain logistics to the rapid expansion of the healthcare and electronics sectors, continuously creates new application niches for innovative plastic tray designs.
Dominant Regions, Countries, or Segments in plastic tray container
The plastic tray container market is experiencing significant dominance from the Application segment of Food & Beverage, which represents a substantial share of the overall market. This dominance is driven by several interconnected factors including evolving dietary habits, the growth of packaged food, and the critical need for safe, hygienic, and durable storage and transportation solutions for perishable goods. The Food & Beverage application segment benefits from the inherent properties of plastic trays, such as their resistance to moisture, chemicals, and temperature fluctuations, which are essential for maintaining food quality and extending shelf life. The increasing global demand for fresh produce, ready-to-eat meals, and processed food products directly translates into a higher requirement for these specialized packaging solutions.
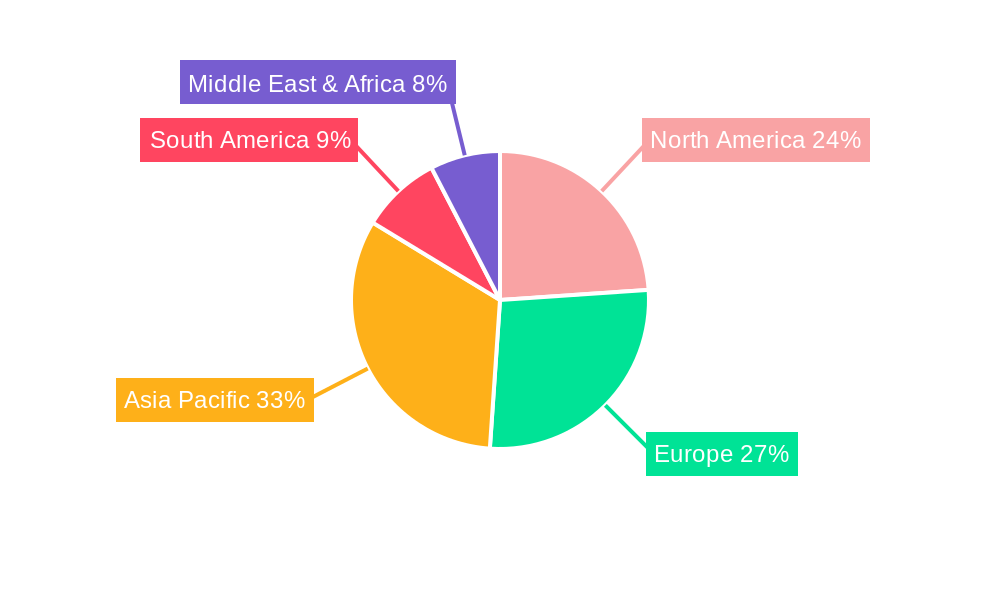
Geographically, Asia Pacific is emerging as a dominant region for the plastic tray container market. This growth is propelled by rapid industrialization, a burgeoning middle class with increasing purchasing power, and significant investments in manufacturing and logistics infrastructure across countries like China, India, and Southeast Asian nations. The expanding food processing industry, coupled with the growth of e-commerce and retail sectors in these regions, directly fuels the demand for various types of plastic trays. Economic policies that encourage domestic manufacturing and foreign investment also play a crucial role in bolstering market expansion.
Within the Types of plastic tray containers, stackable trays are consistently leading due to their superior space-saving capabilities, enhancing efficiency in warehousing and transportation. Their ability to be securely stacked allows for optimized storage density and reduced shipping volumes, translating into significant cost savings for businesses. The widespread adoption of stackable trays across industries like logistics, automotive, and agriculture underscores their versatility and economic advantages. The market share of stackable trays is estimated to be around 30% of the total plastic tray market.
- Dominant Application Segment: Food & Beverage, driven by stringent hygiene requirements, demand for extended shelf life, and the growth of processed and packaged foods. Market share in this segment is estimated to be over 40 million units annually.
- Dominant Region: Asia Pacific, fueled by industrial growth, a rising consumer base, and significant infrastructure development. This region is expected to contribute approximately 35% of global market revenue.
- Key Drivers in Asia Pacific: Favorable manufacturing costs, increasing disposable incomes, and government initiatives supporting the logistics and food processing sectors.
- Dominant Type of Tray: Stackable Trays, offering significant logistical efficiencies through space optimization. Their market penetration is expected to grow by 6% CAGR.
- Growth Potential in Other Applications: Pharmaceuticals (sterile and secure packaging needs) and Automotive (component handling and assembly line efficiency).
- Emerging Regional Markets: Latin America and Africa, driven by increasing industrialization and demand for improved supply chain solutions.
plastic tray container Product Landscape
The plastic tray container product landscape is characterized by continuous innovation focused on enhancing functionality, sustainability, and cost-effectiveness. Manufacturers are developing lightweight yet exceptionally durable trays using advanced polymers such as high-density polyethylene (HDPE) and polypropylene (PP), often reinforced for increased load-bearing capacity. Key product innovations include trays with integrated RFID tags for enhanced track-and-trace capabilities, crucial for supply chain visibility in sectors like pharmaceuticals and high-value goods. Furthermore, there's a strong emphasis on eco-friendly designs, with a growing array of trays made from post-consumer recycled (PCR) plastics and biodegradable materials, catering to the rising demand for sustainable packaging. Performance metrics are consistently improving, with trays designed for extreme temperature resistance, chemical inertness, and superior impact strength, ensuring product protection across diverse handling and environmental conditions. Unique selling propositions often lie in customizable designs, ergonomic features for easier handling, and compatibility with automated handling systems, such as robotic palletizers and conveyors.
Key Drivers, Barriers & Challenges in plastic tray container
Key Drivers:
- Growing E-commerce and Logistics Demands: The exponential growth of online retail necessitates efficient, durable, and stackable packaging for product shipment and warehousing. Plastic tray containers excel in these areas, offering superior protection and space optimization compared to traditional packaging.
- Food Safety and Hygiene Standards: Stringent regulations in the food and beverage industry, coupled with consumer demand for safe and hygienic products, drive the adoption of non-porous, easily cleanable plastic trays that prevent contamination.
- Sustainability Initiatives and Circular Economy: Increasing global focus on reducing waste and promoting a circular economy is fostering demand for reusable, recyclable, and recycled content plastic trays, aligning with environmental goals.
- Industrial Automation and Efficiency: The drive for greater efficiency in manufacturing and logistics operations favors standardized, robust, and easily handled plastic trays that are compatible with automated systems, leading to reduced labor costs and improved throughput.
Barriers & Challenges:
- Volatility in Raw Material Prices: The price of virgin plastic resins, largely derived from petrochemicals, is subject to fluctuations in crude oil prices, impacting the cost of production and potentially affecting market competitiveness. For instance, a 10% increase in raw material costs can lead to a 3-5% increase in finished product prices.
- Perception of Plastic Waste and Environmental Concerns: Negative public perception and increasing regulatory pressures regarding plastic waste can create a barrier for widespread adoption, especially in regions with strong environmental advocacy.
- Competition from Alternative Materials: While plastic trays offer distinct advantages, competition from cardboard, metal, and wood packaging, particularly in niche applications or where cost is the primary differentiator, remains a challenge.
- Initial Investment Costs for Reusable Systems: While reusable plastic tray systems offer long-term cost savings, the initial capital investment for acquiring a fleet of trays and implementing return logistics can be a significant barrier for smaller businesses.
Emerging Opportunities in plastic tray container
Emerging opportunities in the plastic tray container market are significantly shaped by advancements in material science and the growing demand for sustainable and smart packaging solutions. The development of advanced bio-based and biodegradable plastics presents a substantial avenue for growth, catering to the increasing consumer and regulatory preference for eco-friendly alternatives. This includes novel compostable trays for specific food applications and agricultural products. Another significant opportunity lies in the integration of smart technologies, such as embedded sensors and QR codes, into plastic trays. These "smart trays" offer enhanced traceability, real-time condition monitoring (e.g., temperature, humidity), and improved inventory management, which are becoming critical for supply chain transparency in the pharmaceutical and high-value electronics sectors. Furthermore, the expanding global e-grocery market and the rise of direct-to-consumer (DTC) models are creating demand for specialized, aesthetically pleasing, and highly protective plastic trays designed for direct consumer delivery. Untapped markets in developing regions with nascent logistics infrastructures also offer considerable growth potential as these economies modernize their supply chains.
Growth Accelerators in the plastic tray container Industry
Several key catalysts are accelerating the growth of the plastic tray container industry. Technological breakthroughs in polymer engineering are leading to the development of lighter, stronger, and more durable materials, which enhance performance and reduce transportation costs. The increasing adoption of Industry 4.0 principles, including automation and AI in manufacturing, is enabling more efficient and cost-effective production of customized plastic trays. Strategic partnerships between plastic tray manufacturers and logistics companies are crucial for developing integrated returnable transport packaging (RTP) systems, which offer significant cost savings and environmental benefits. Market expansion strategies, including targeted penetration into emerging economies and the development of specialized trays for new application segments like specialized medical supplies or advanced electronics, are also playing a vital role in driving long-term growth. The continuous focus on sustainability, leading to innovations in recycled content and end-of-life solutions, is further solidifying the industry's growth trajectory.
Key Players Shaping the plastic tray container Market
- Schoeller Allibert
- ORBIS
- DS Smith
- Georg Utz Holding
- Didak Injection
- Suzhou Dasen Plastic
- Jiangsu Yujia
- Suzhou First Plastic
- Shenzhen Xingfeng Plastic
- Supreme Industries
- Nilkamal
- Mpact Limited
- Rehrig Pacific Company
- Delbrouck
- Myers Industries
- Zhejiang Zhengji Plastic
Notable Milestones in plastic tray container Sector
- 2019: Schoeller Allibert launches a new range of sustainable plastic trays made from 100% recycled materials, responding to increasing environmental concerns.
- 2020: ORBIS acquires Polymer Logistics, expanding its European presence and product portfolio for returnable packaging solutions.
- 2021: DS Smith invests heavily in advanced injection molding technology to increase production capacity for high-performance plastic trays.
- 2022: Georg Utz Holding introduces innovative trays with integrated sensor technology for real-time supply chain monitoring.
- 2023: Suzhou Dasen Plastic expands its manufacturing facilities to meet the surging demand from the e-commerce sector in Asia.
- 2024: Nilkamal introduces lightweight yet extremely durable plastic trays designed for automated warehouse systems.
- 2024: Mpact Limited announces strategic partnerships to bolster its presence in the African returnable packaging market.
In-Depth plastic tray container Market Outlook
The future outlook for the plastic tray container market is exceptionally positive, fueled by powerful growth accelerators. Continued innovation in material science, particularly in sustainable and smart plastics, will drive product differentiation and meet evolving market demands. The ongoing digital transformation in logistics and supply chain management will further propel the adoption of advanced plastic tray solutions offering traceability and real-time data. Strategic expansions into emerging economies, coupled with the development of tailored solutions for burgeoning sectors like healthcare and advanced manufacturing, represent significant future revenue streams. The increasing emphasis on circular economy principles and regulatory support for sustainable packaging will solidify the position of reusable and recyclable plastic trays as preferred choices. Companies that invest in R&D for eco-friendly materials and smart technologies, and forge strong partnerships across the value chain, are best positioned to capitalize on the substantial growth opportunities ahead.
plastic tray container Segmentation
- 1. Application
- 2. Types
plastic tray container Segmentation By Geography
-
1. North America
- 1.1. United States
- 1.2. Canada
- 1.3. Mexico
-
2. South America
- 2.1. Brazil
- 2.2. Argentina
- 2.3. Rest of South America
-
3. Europe
- 3.1. United Kingdom
- 3.2. Germany
- 3.3. France
- 3.4. Italy
- 3.5. Spain
- 3.6. Russia
- 3.7. Benelux
- 3.8. Nordics
- 3.9. Rest of Europe
-
4. Middle East & Africa
- 4.1. Turkey
- 4.2. Israel
- 4.3. GCC
- 4.4. North Africa
- 4.5. South Africa
- 4.6. Rest of Middle East & Africa
-
5. Asia Pacific
- 5.1. China
- 5.2. India
- 5.3. Japan
- 5.4. South Korea
- 5.5. ASEAN
- 5.6. Oceania
- 5.7. Rest of Asia Pacific
plastic tray container Regional Market Share
Geographic Coverage of plastic tray container
plastic tray container REPORT HIGHLIGHTS
| Aspects | Details |
|---|---|
| Study Period | 2020-2034 |
| Base Year | 2025 |
| Estimated Year | 2026 |
| Forecast Period | 2026-2034 |
| Historical Period | 2020-2025 |
| Growth Rate | CAGR of 6.61% from 2020-2034 |
| Segmentation |
|
Table of Contents
- 1. Introduction
- 1.1. Research Scope
- 1.2. Market Segmentation
- 1.3. Research Methodology
- 1.4. Definitions and Assumptions
- 2. Executive Summary
- 2.1. Introduction
- 3. Market Dynamics
- 3.1. Introduction
- 3.2. Market Drivers
- 3.3. Market Restrains
- 3.4. Market Trends
- 4. Market Factor Analysis
- 4.1. Porters Five Forces
- 4.2. Supply/Value Chain
- 4.3. PESTEL analysis
- 4.4. Market Entropy
- 4.5. Patent/Trademark Analysis
- 5. Global plastic tray container Analysis, Insights and Forecast, 2020-2032
- 5.1. Market Analysis, Insights and Forecast - by Application
- 5.2. Market Analysis, Insights and Forecast - by Types
- 5.3. Market Analysis, Insights and Forecast - by Region
- 5.3.1. North America
- 5.3.2. South America
- 5.3.3. Europe
- 5.3.4. Middle East & Africa
- 5.3.5. Asia Pacific
- 5.1. Market Analysis, Insights and Forecast - by Application
- 6. North America plastic tray container Analysis, Insights and Forecast, 2020-2032
- 6.1. Market Analysis, Insights and Forecast - by Application
- 6.2. Market Analysis, Insights and Forecast - by Types
- 6.1. Market Analysis, Insights and Forecast - by Application
- 7. South America plastic tray container Analysis, Insights and Forecast, 2020-2032
- 7.1. Market Analysis, Insights and Forecast - by Application
- 7.2. Market Analysis, Insights and Forecast - by Types
- 7.1. Market Analysis, Insights and Forecast - by Application
- 8. Europe plastic tray container Analysis, Insights and Forecast, 2020-2032
- 8.1. Market Analysis, Insights and Forecast - by Application
- 8.2. Market Analysis, Insights and Forecast - by Types
- 8.1. Market Analysis, Insights and Forecast - by Application
- 9. Middle East & Africa plastic tray container Analysis, Insights and Forecast, 2020-2032
- 9.1. Market Analysis, Insights and Forecast - by Application
- 9.2. Market Analysis, Insights and Forecast - by Types
- 9.1. Market Analysis, Insights and Forecast - by Application
- 10. Asia Pacific plastic tray container Analysis, Insights and Forecast, 2020-2032
- 10.1. Market Analysis, Insights and Forecast - by Application
- 10.2. Market Analysis, Insights and Forecast - by Types
- 10.1. Market Analysis, Insights and Forecast - by Application
- 11. Competitive Analysis
- 11.1. Global Market Share Analysis 2025
- 11.2. Company Profiles
- 11.2.1 Schoeller Allibert
- 11.2.1.1. Overview
- 11.2.1.2. Products
- 11.2.1.3. SWOT Analysis
- 11.2.1.4. Recent Developments
- 11.2.1.5. Financials (Based on Availability)
- 11.2.2 ORBIS
- 11.2.2.1. Overview
- 11.2.2.2. Products
- 11.2.2.3. SWOT Analysis
- 11.2.2.4. Recent Developments
- 11.2.2.5. Financials (Based on Availability)
- 11.2.3 DS Smith
- 11.2.3.1. Overview
- 11.2.3.2. Products
- 11.2.3.3. SWOT Analysis
- 11.2.3.4. Recent Developments
- 11.2.3.5. Financials (Based on Availability)
- 11.2.4 Georg Utz Holding
- 11.2.4.1. Overview
- 11.2.4.2. Products
- 11.2.4.3. SWOT Analysis
- 11.2.4.4. Recent Developments
- 11.2.4.5. Financials (Based on Availability)
- 11.2.5 Didak Injection
- 11.2.5.1. Overview
- 11.2.5.2. Products
- 11.2.5.3. SWOT Analysis
- 11.2.5.4. Recent Developments
- 11.2.5.5. Financials (Based on Availability)
- 11.2.6 Suzhou Dasen Plastic
- 11.2.6.1. Overview
- 11.2.6.2. Products
- 11.2.6.3. SWOT Analysis
- 11.2.6.4. Recent Developments
- 11.2.6.5. Financials (Based on Availability)
- 11.2.7 Jiangsu Yujia
- 11.2.7.1. Overview
- 11.2.7.2. Products
- 11.2.7.3. SWOT Analysis
- 11.2.7.4. Recent Developments
- 11.2.7.5. Financials (Based on Availability)
- 11.2.8 Suzhou First Plastic
- 11.2.8.1. Overview
- 11.2.8.2. Products
- 11.2.8.3. SWOT Analysis
- 11.2.8.4. Recent Developments
- 11.2.8.5. Financials (Based on Availability)
- 11.2.9 Shenzhen Xingfeng Plastic
- 11.2.9.1. Overview
- 11.2.9.2. Products
- 11.2.9.3. SWOT Analysis
- 11.2.9.4. Recent Developments
- 11.2.9.5. Financials (Based on Availability)
- 11.2.10 Supreme Industries
- 11.2.10.1. Overview
- 11.2.10.2. Products
- 11.2.10.3. SWOT Analysis
- 11.2.10.4. Recent Developments
- 11.2.10.5. Financials (Based on Availability)
- 11.2.11 Nilkamal
- 11.2.11.1. Overview
- 11.2.11.2. Products
- 11.2.11.3. SWOT Analysis
- 11.2.11.4. Recent Developments
- 11.2.11.5. Financials (Based on Availability)
- 11.2.12 Mpact Limited
- 11.2.12.1. Overview
- 11.2.12.2. Products
- 11.2.12.3. SWOT Analysis
- 11.2.12.4. Recent Developments
- 11.2.12.5. Financials (Based on Availability)
- 11.2.13 Rehrig Pacific Company
- 11.2.13.1. Overview
- 11.2.13.2. Products
- 11.2.13.3. SWOT Analysis
- 11.2.13.4. Recent Developments
- 11.2.13.5. Financials (Based on Availability)
- 11.2.14 Delbrouck
- 11.2.14.1. Overview
- 11.2.14.2. Products
- 11.2.14.3. SWOT Analysis
- 11.2.14.4. Recent Developments
- 11.2.14.5. Financials (Based on Availability)
- 11.2.15 Myers Industries
- 11.2.15.1. Overview
- 11.2.15.2. Products
- 11.2.15.3. SWOT Analysis
- 11.2.15.4. Recent Developments
- 11.2.15.5. Financials (Based on Availability)
- 11.2.16 Zhejiang Zhengji Plastic
- 11.2.16.1. Overview
- 11.2.16.2. Products
- 11.2.16.3. SWOT Analysis
- 11.2.16.4. Recent Developments
- 11.2.16.5. Financials (Based on Availability)
- 11.2.1 Schoeller Allibert
List of Figures
- Figure 1: Global plastic tray container Revenue Breakdown (billion, %) by Region 2025 & 2033
- Figure 2: Global plastic tray container Volume Breakdown (K, %) by Region 2025 & 2033
- Figure 3: North America plastic tray container Revenue (billion), by Application 2025 & 2033
- Figure 4: North America plastic tray container Volume (K), by Application 2025 & 2033
- Figure 5: North America plastic tray container Revenue Share (%), by Application 2025 & 2033
- Figure 6: North America plastic tray container Volume Share (%), by Application 2025 & 2033
- Figure 7: North America plastic tray container Revenue (billion), by Types 2025 & 2033
- Figure 8: North America plastic tray container Volume (K), by Types 2025 & 2033
- Figure 9: North America plastic tray container Revenue Share (%), by Types 2025 & 2033
- Figure 10: North America plastic tray container Volume Share (%), by Types 2025 & 2033
- Figure 11: North America plastic tray container Revenue (billion), by Country 2025 & 2033
- Figure 12: North America plastic tray container Volume (K), by Country 2025 & 2033
- Figure 13: North America plastic tray container Revenue Share (%), by Country 2025 & 2033
- Figure 14: North America plastic tray container Volume Share (%), by Country 2025 & 2033
- Figure 15: South America plastic tray container Revenue (billion), by Application 2025 & 2033
- Figure 16: South America plastic tray container Volume (K), by Application 2025 & 2033
- Figure 17: South America plastic tray container Revenue Share (%), by Application 2025 & 2033
- Figure 18: South America plastic tray container Volume Share (%), by Application 2025 & 2033
- Figure 19: South America plastic tray container Revenue (billion), by Types 2025 & 2033
- Figure 20: South America plastic tray container Volume (K), by Types 2025 & 2033
- Figure 21: South America plastic tray container Revenue Share (%), by Types 2025 & 2033
- Figure 22: South America plastic tray container Volume Share (%), by Types 2025 & 2033
- Figure 23: South America plastic tray container Revenue (billion), by Country 2025 & 2033
- Figure 24: South America plastic tray container Volume (K), by Country 2025 & 2033
- Figure 25: South America plastic tray container Revenue Share (%), by Country 2025 & 2033
- Figure 26: South America plastic tray container Volume Share (%), by Country 2025 & 2033
- Figure 27: Europe plastic tray container Revenue (billion), by Application 2025 & 2033
- Figure 28: Europe plastic tray container Volume (K), by Application 2025 & 2033
- Figure 29: Europe plastic tray container Revenue Share (%), by Application 2025 & 2033
- Figure 30: Europe plastic tray container Volume Share (%), by Application 2025 & 2033
- Figure 31: Europe plastic tray container Revenue (billion), by Types 2025 & 2033
- Figure 32: Europe plastic tray container Volume (K), by Types 2025 & 2033
- Figure 33: Europe plastic tray container Revenue Share (%), by Types 2025 & 2033
- Figure 34: Europe plastic tray container Volume Share (%), by Types 2025 & 2033
- Figure 35: Europe plastic tray container Revenue (billion), by Country 2025 & 2033
- Figure 36: Europe plastic tray container Volume (K), by Country 2025 & 2033
- Figure 37: Europe plastic tray container Revenue Share (%), by Country 2025 & 2033
- Figure 38: Europe plastic tray container Volume Share (%), by Country 2025 & 2033
- Figure 39: Middle East & Africa plastic tray container Revenue (billion), by Application 2025 & 2033
- Figure 40: Middle East & Africa plastic tray container Volume (K), by Application 2025 & 2033
- Figure 41: Middle East & Africa plastic tray container Revenue Share (%), by Application 2025 & 2033
- Figure 42: Middle East & Africa plastic tray container Volume Share (%), by Application 2025 & 2033
- Figure 43: Middle East & Africa plastic tray container Revenue (billion), by Types 2025 & 2033
- Figure 44: Middle East & Africa plastic tray container Volume (K), by Types 2025 & 2033
- Figure 45: Middle East & Africa plastic tray container Revenue Share (%), by Types 2025 & 2033
- Figure 46: Middle East & Africa plastic tray container Volume Share (%), by Types 2025 & 2033
- Figure 47: Middle East & Africa plastic tray container Revenue (billion), by Country 2025 & 2033
- Figure 48: Middle East & Africa plastic tray container Volume (K), by Country 2025 & 2033
- Figure 49: Middle East & Africa plastic tray container Revenue Share (%), by Country 2025 & 2033
- Figure 50: Middle East & Africa plastic tray container Volume Share (%), by Country 2025 & 2033
- Figure 51: Asia Pacific plastic tray container Revenue (billion), by Application 2025 & 2033
- Figure 52: Asia Pacific plastic tray container Volume (K), by Application 2025 & 2033
- Figure 53: Asia Pacific plastic tray container Revenue Share (%), by Application 2025 & 2033
- Figure 54: Asia Pacific plastic tray container Volume Share (%), by Application 2025 & 2033
- Figure 55: Asia Pacific plastic tray container Revenue (billion), by Types 2025 & 2033
- Figure 56: Asia Pacific plastic tray container Volume (K), by Types 2025 & 2033
- Figure 57: Asia Pacific plastic tray container Revenue Share (%), by Types 2025 & 2033
- Figure 58: Asia Pacific plastic tray container Volume Share (%), by Types 2025 & 2033
- Figure 59: Asia Pacific plastic tray container Revenue (billion), by Country 2025 & 2033
- Figure 60: Asia Pacific plastic tray container Volume (K), by Country 2025 & 2033
- Figure 61: Asia Pacific plastic tray container Revenue Share (%), by Country 2025 & 2033
- Figure 62: Asia Pacific plastic tray container Volume Share (%), by Country 2025 & 2033
List of Tables
- Table 1: Global plastic tray container Revenue billion Forecast, by Application 2020 & 2033
- Table 2: Global plastic tray container Volume K Forecast, by Application 2020 & 2033
- Table 3: Global plastic tray container Revenue billion Forecast, by Types 2020 & 2033
- Table 4: Global plastic tray container Volume K Forecast, by Types 2020 & 2033
- Table 5: Global plastic tray container Revenue billion Forecast, by Region 2020 & 2033
- Table 6: Global plastic tray container Volume K Forecast, by Region 2020 & 2033
- Table 7: Global plastic tray container Revenue billion Forecast, by Application 2020 & 2033
- Table 8: Global plastic tray container Volume K Forecast, by Application 2020 & 2033
- Table 9: Global plastic tray container Revenue billion Forecast, by Types 2020 & 2033
- Table 10: Global plastic tray container Volume K Forecast, by Types 2020 & 2033
- Table 11: Global plastic tray container Revenue billion Forecast, by Country 2020 & 2033
- Table 12: Global plastic tray container Volume K Forecast, by Country 2020 & 2033
- Table 13: United States plastic tray container Revenue (billion) Forecast, by Application 2020 & 2033
- Table 14: United States plastic tray container Volume (K) Forecast, by Application 2020 & 2033
- Table 15: Canada plastic tray container Revenue (billion) Forecast, by Application 2020 & 2033
- Table 16: Canada plastic tray container Volume (K) Forecast, by Application 2020 & 2033
- Table 17: Mexico plastic tray container Revenue (billion) Forecast, by Application 2020 & 2033
- Table 18: Mexico plastic tray container Volume (K) Forecast, by Application 2020 & 2033
- Table 19: Global plastic tray container Revenue billion Forecast, by Application 2020 & 2033
- Table 20: Global plastic tray container Volume K Forecast, by Application 2020 & 2033
- Table 21: Global plastic tray container Revenue billion Forecast, by Types 2020 & 2033
- Table 22: Global plastic tray container Volume K Forecast, by Types 2020 & 2033
- Table 23: Global plastic tray container Revenue billion Forecast, by Country 2020 & 2033
- Table 24: Global plastic tray container Volume K Forecast, by Country 2020 & 2033
- Table 25: Brazil plastic tray container Revenue (billion) Forecast, by Application 2020 & 2033
- Table 26: Brazil plastic tray container Volume (K) Forecast, by Application 2020 & 2033
- Table 27: Argentina plastic tray container Revenue (billion) Forecast, by Application 2020 & 2033
- Table 28: Argentina plastic tray container Volume (K) Forecast, by Application 2020 & 2033
- Table 29: Rest of South America plastic tray container Revenue (billion) Forecast, by Application 2020 & 2033
- Table 30: Rest of South America plastic tray container Volume (K) Forecast, by Application 2020 & 2033
- Table 31: Global plastic tray container Revenue billion Forecast, by Application 2020 & 2033
- Table 32: Global plastic tray container Volume K Forecast, by Application 2020 & 2033
- Table 33: Global plastic tray container Revenue billion Forecast, by Types 2020 & 2033
- Table 34: Global plastic tray container Volume K Forecast, by Types 2020 & 2033
- Table 35: Global plastic tray container Revenue billion Forecast, by Country 2020 & 2033
- Table 36: Global plastic tray container Volume K Forecast, by Country 2020 & 2033
- Table 37: United Kingdom plastic tray container Revenue (billion) Forecast, by Application 2020 & 2033
- Table 38: United Kingdom plastic tray container Volume (K) Forecast, by Application 2020 & 2033
- Table 39: Germany plastic tray container Revenue (billion) Forecast, by Application 2020 & 2033
- Table 40: Germany plastic tray container Volume (K) Forecast, by Application 2020 & 2033
- Table 41: France plastic tray container Revenue (billion) Forecast, by Application 2020 & 2033
- Table 42: France plastic tray container Volume (K) Forecast, by Application 2020 & 2033
- Table 43: Italy plastic tray container Revenue (billion) Forecast, by Application 2020 & 2033
- Table 44: Italy plastic tray container Volume (K) Forecast, by Application 2020 & 2033
- Table 45: Spain plastic tray container Revenue (billion) Forecast, by Application 2020 & 2033
- Table 46: Spain plastic tray container Volume (K) Forecast, by Application 2020 & 2033
- Table 47: Russia plastic tray container Revenue (billion) Forecast, by Application 2020 & 2033
- Table 48: Russia plastic tray container Volume (K) Forecast, by Application 2020 & 2033
- Table 49: Benelux plastic tray container Revenue (billion) Forecast, by Application 2020 & 2033
- Table 50: Benelux plastic tray container Volume (K) Forecast, by Application 2020 & 2033
- Table 51: Nordics plastic tray container Revenue (billion) Forecast, by Application 2020 & 2033
- Table 52: Nordics plastic tray container Volume (K) Forecast, by Application 2020 & 2033
- Table 53: Rest of Europe plastic tray container Revenue (billion) Forecast, by Application 2020 & 2033
- Table 54: Rest of Europe plastic tray container Volume (K) Forecast, by Application 2020 & 2033
- Table 55: Global plastic tray container Revenue billion Forecast, by Application 2020 & 2033
- Table 56: Global plastic tray container Volume K Forecast, by Application 2020 & 2033
- Table 57: Global plastic tray container Revenue billion Forecast, by Types 2020 & 2033
- Table 58: Global plastic tray container Volume K Forecast, by Types 2020 & 2033
- Table 59: Global plastic tray container Revenue billion Forecast, by Country 2020 & 2033
- Table 60: Global plastic tray container Volume K Forecast, by Country 2020 & 2033
- Table 61: Turkey plastic tray container Revenue (billion) Forecast, by Application 2020 & 2033
- Table 62: Turkey plastic tray container Volume (K) Forecast, by Application 2020 & 2033
- Table 63: Israel plastic tray container Revenue (billion) Forecast, by Application 2020 & 2033
- Table 64: Israel plastic tray container Volume (K) Forecast, by Application 2020 & 2033
- Table 65: GCC plastic tray container Revenue (billion) Forecast, by Application 2020 & 2033
- Table 66: GCC plastic tray container Volume (K) Forecast, by Application 2020 & 2033
- Table 67: North Africa plastic tray container Revenue (billion) Forecast, by Application 2020 & 2033
- Table 68: North Africa plastic tray container Volume (K) Forecast, by Application 2020 & 2033
- Table 69: South Africa plastic tray container Revenue (billion) Forecast, by Application 2020 & 2033
- Table 70: South Africa plastic tray container Volume (K) Forecast, by Application 2020 & 2033
- Table 71: Rest of Middle East & Africa plastic tray container Revenue (billion) Forecast, by Application 2020 & 2033
- Table 72: Rest of Middle East & Africa plastic tray container Volume (K) Forecast, by Application 2020 & 2033
- Table 73: Global plastic tray container Revenue billion Forecast, by Application 2020 & 2033
- Table 74: Global plastic tray container Volume K Forecast, by Application 2020 & 2033
- Table 75: Global plastic tray container Revenue billion Forecast, by Types 2020 & 2033
- Table 76: Global plastic tray container Volume K Forecast, by Types 2020 & 2033
- Table 77: Global plastic tray container Revenue billion Forecast, by Country 2020 & 2033
- Table 78: Global plastic tray container Volume K Forecast, by Country 2020 & 2033
- Table 79: China plastic tray container Revenue (billion) Forecast, by Application 2020 & 2033
- Table 80: China plastic tray container Volume (K) Forecast, by Application 2020 & 2033
- Table 81: India plastic tray container Revenue (billion) Forecast, by Application 2020 & 2033
- Table 82: India plastic tray container Volume (K) Forecast, by Application 2020 & 2033
- Table 83: Japan plastic tray container Revenue (billion) Forecast, by Application 2020 & 2033
- Table 84: Japan plastic tray container Volume (K) Forecast, by Application 2020 & 2033
- Table 85: South Korea plastic tray container Revenue (billion) Forecast, by Application 2020 & 2033
- Table 86: South Korea plastic tray container Volume (K) Forecast, by Application 2020 & 2033
- Table 87: ASEAN plastic tray container Revenue (billion) Forecast, by Application 2020 & 2033
- Table 88: ASEAN plastic tray container Volume (K) Forecast, by Application 2020 & 2033
- Table 89: Oceania plastic tray container Revenue (billion) Forecast, by Application 2020 & 2033
- Table 90: Oceania plastic tray container Volume (K) Forecast, by Application 2020 & 2033
- Table 91: Rest of Asia Pacific plastic tray container Revenue (billion) Forecast, by Application 2020 & 2033
- Table 92: Rest of Asia Pacific plastic tray container Volume (K) Forecast, by Application 2020 & 2033
Frequently Asked Questions
1. What is the projected Compound Annual Growth Rate (CAGR) of the plastic tray container?
The projected CAGR is approximately 6.61%.
2. Which companies are prominent players in the plastic tray container?
Key companies in the market include Schoeller Allibert, ORBIS, DS Smith, Georg Utz Holding, Didak Injection, Suzhou Dasen Plastic, Jiangsu Yujia, Suzhou First Plastic, Shenzhen Xingfeng Plastic, Supreme Industries, Nilkamal, Mpact Limited, Rehrig Pacific Company, Delbrouck, Myers Industries, Zhejiang Zhengji Plastic.
3. What are the main segments of the plastic tray container?
The market segments include Application, Types.
4. Can you provide details about the market size?
The market size is estimated to be USD 43.64 billion as of 2022.
5. What are some drivers contributing to market growth?
N/A
6. What are the notable trends driving market growth?
N/A
7. Are there any restraints impacting market growth?
N/A
8. Can you provide examples of recent developments in the market?
N/A
9. What pricing options are available for accessing the report?
Pricing options include single-user, multi-user, and enterprise licenses priced at USD 4350.00, USD 6525.00, and USD 8700.00 respectively.
10. Is the market size provided in terms of value or volume?
The market size is provided in terms of value, measured in billion and volume, measured in K.
11. Are there any specific market keywords associated with the report?
Yes, the market keyword associated with the report is "plastic tray container," which aids in identifying and referencing the specific market segment covered.
12. How do I determine which pricing option suits my needs best?
The pricing options vary based on user requirements and access needs. Individual users may opt for single-user licenses, while businesses requiring broader access may choose multi-user or enterprise licenses for cost-effective access to the report.
13. Are there any additional resources or data provided in the plastic tray container report?
While the report offers comprehensive insights, it's advisable to review the specific contents or supplementary materials provided to ascertain if additional resources or data are available.
14. How can I stay updated on further developments or reports in the plastic tray container?
To stay informed about further developments, trends, and reports in the plastic tray container, consider subscribing to industry newsletters, following relevant companies and organizations, or regularly checking reputable industry news sources and publications.
Methodology
Step 1 - Identification of Relevant Samples Size from Population Database


Step 2 - Approaches for Defining Global Market Size (Value, Volume* & Price*)

Note*: In applicable scenarios
Step 3 - Data Sources
Primary Research
- Web Analytics
- Survey Reports
- Research Institute
- Latest Research Reports
- Opinion Leaders
Secondary Research
- Annual Reports
- White Paper
- Latest Press Release
- Industry Association
- Paid Database
- Investor Presentations

Step 4 - Data Triangulation
Involves using different sources of information in order to increase the validity of a study
These sources are likely to be stakeholders in a program - participants, other researchers, program staff, other community members, and so on.
Then we put all data in single framework & apply various statistical tools to find out the dynamic on the market.
During the analysis stage, feedback from the stakeholder groups would be compared to determine areas of agreement as well as areas of divergence