

Key Insights
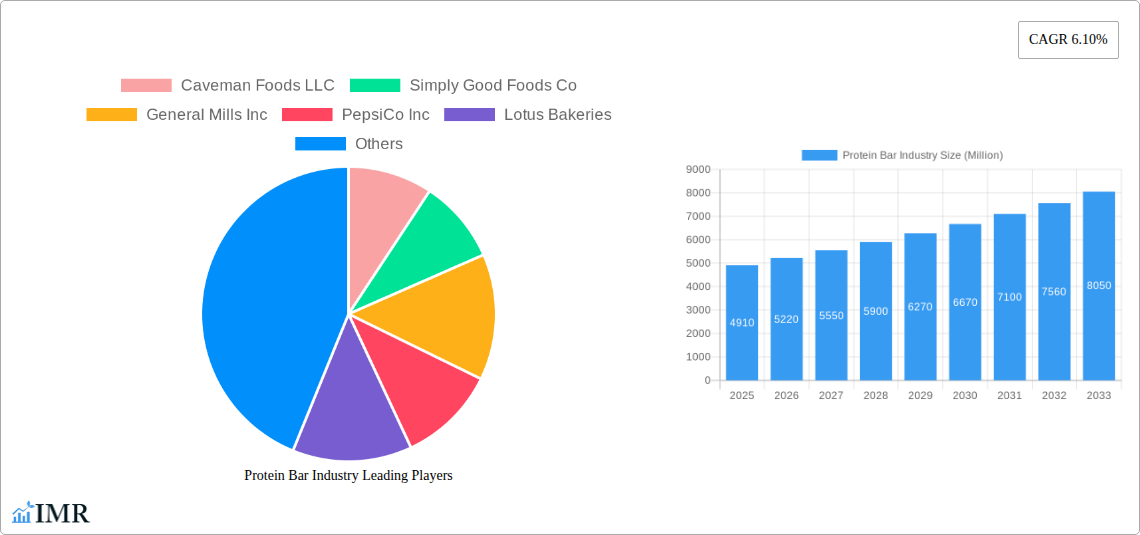
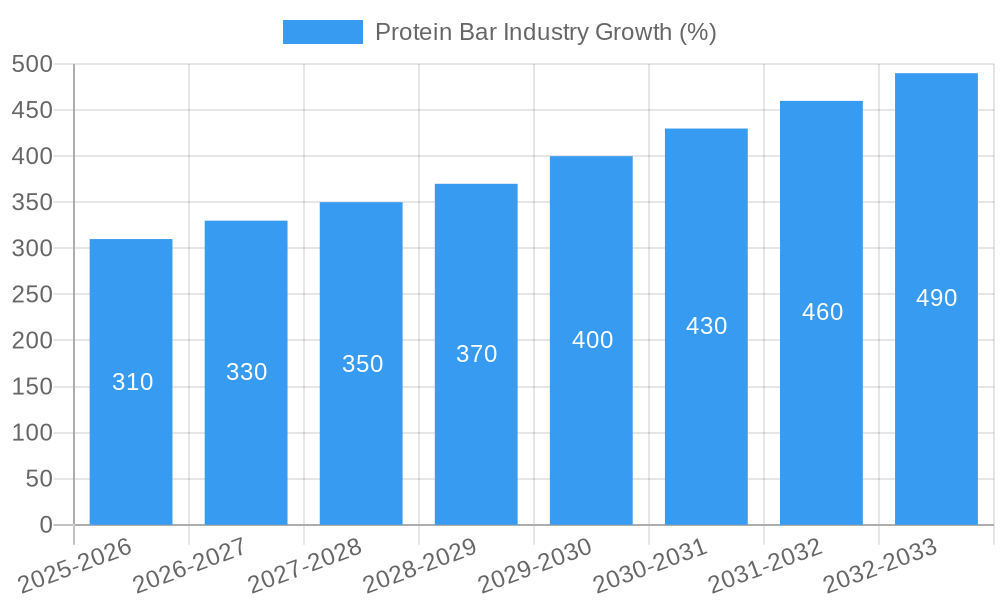
The global protein bar market, valued at $4.91 billion in 2025, is projected to experience robust growth, exhibiting a Compound Annual Growth Rate (CAGR) of 6.10% from 2025 to 2033. This expansion is fueled by several key drivers. The rising prevalence of health-conscious consumers seeking convenient and nutritious protein sources is a significant factor. The increasing popularity of fitness and wellness lifestyles, coupled with busy schedules demanding quick meal replacements, further propels market growth. Expanding distribution channels, particularly through online retail and convenience stores, enhances accessibility and contributes to market penetration. Furthermore, continuous product innovation, encompassing the development of bars with enhanced flavor profiles, textures, and functional ingredients like added vitamins and fiber, caters to evolving consumer preferences and drives demand. While pricing pressures and potential ingredient supply chain fluctuations represent potential restraints, the overall market outlook remains positive.
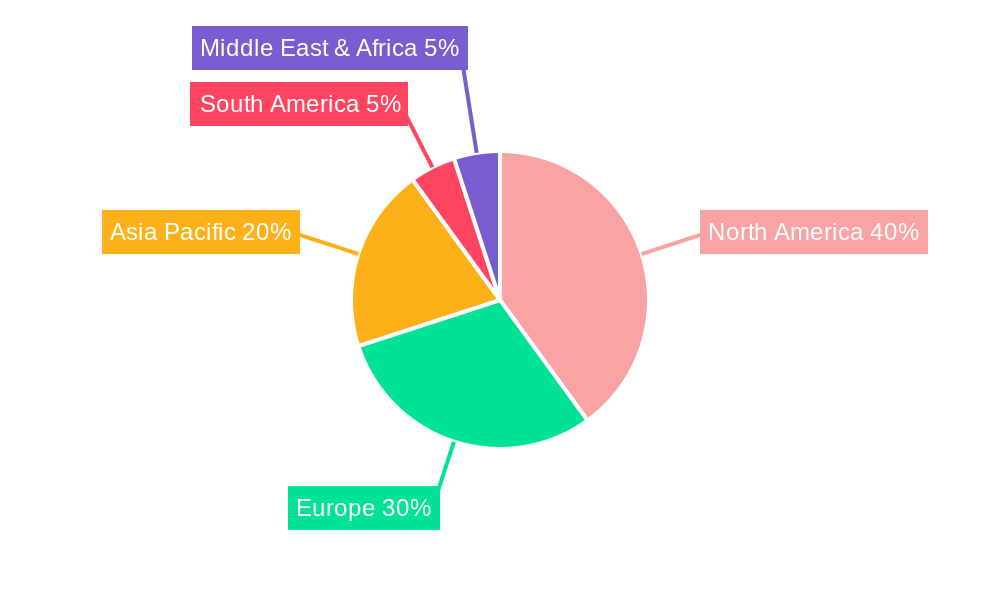
Significant regional variations exist within the protein bar market. North America, with its established health and wellness culture and high disposable income, currently commands a substantial market share. However, Asia-Pacific is poised for rapid growth due to rising health awareness and a burgeoning middle class. Europe also contributes significantly, driven by strong demand in key markets like Germany and the UK. The competitive landscape is characterized by a mix of established multinational food companies like General Mills and PepsiCo, alongside smaller niche players focusing on specialized formulations or specific dietary needs. The market's future trajectory suggests continued expansion, driven by consistent innovation, broadening distribution, and the sustained appeal of convenient, protein-rich snacking options catering to a health-conscious and time-constrained population.
Protein Bar Industry Market Report: 2019-2033
This comprehensive report provides a detailed analysis of the global protein bar market, encompassing market dynamics, growth trends, regional segmentation, product landscape, key players, and future outlook. The study period covers 2019-2033, with 2025 as the base year and a forecast period of 2025-2033. The report is invaluable for industry professionals, investors, and anyone seeking in-depth knowledge of this rapidly expanding market. The total market size in 2025 is estimated at XX Million units.
Protein Bar Industry Market Dynamics & Structure
The protein bar market is characterized by moderate concentration, with key players like General Mills Inc. and PepsiCo Inc. holding significant market share. However, smaller players and new entrants continuously challenge the status quo through product innovation and niche market targeting. Technological advancements, particularly in formulation and processing, drive product diversification and improved nutritional profiles. Regulatory frameworks concerning labeling and health claims significantly influence product development and marketing strategies. Competitive substitutes, such as energy bars and nutritional shakes, create an environment of continuous improvement and innovation. The end-user demographic is broad, encompassing fitness enthusiasts, health-conscious individuals, and busy professionals seeking convenient nutrition. The market witnesses a moderate rate of M&A activity, reflecting consolidation and expansion strategies.
- Market Concentration: Moderately concentrated, with top 5 players holding approximately xx% market share in 2025.
- Technological Innovation: Focus on improved taste, texture, and nutritional value; expansion into functional bars targeting specific health needs.
- Regulatory Framework: Stringent labeling requirements and health claims regulations impacting product development.
- Competitive Substitutes: Energy bars, nutritional shakes, and other convenient food options pose competitive pressure.
- End-User Demographics: Fitness enthusiasts, health-conscious consumers, busy professionals are key market segments.
- M&A Trends: Moderate level of mergers and acquisitions, primarily for expansion and market share consolidation (xx deals in 2019-2024).
Protein Bar Industry Growth Trends & Insights
The global protein bar market exhibited robust growth during the historical period (2019-2024), with a CAGR of xx%. This growth is attributed to rising health consciousness, increasing demand for convenient nutrition, and the proliferation of online retail channels. Technological innovations, such as the development of plant-based protein bars and functional bars enriched with vitamins and minerals, further fueled market expansion. Changing consumer preferences towards healthier lifestyles, coupled with increased disposable incomes in many regions, have significantly boosted adoption rates. The market penetration rate is estimated at xx% in 2025, with significant growth potential in untapped markets. Technological disruptions, particularly in the area of sustainable packaging and alternative protein sources, are shaping future market trends.
Dominant Regions, Countries, or Segments in Protein Bar Industry
The North American region currently dominates the protein bar market, driven by high health consciousness, a large consumer base, and well-established distribution networks. However, Asia-Pacific is expected to witness the fastest growth in the forecast period due to rising disposable incomes, increasing health awareness, and expanding fitness culture.
Within distribution channels, Supermarket/Hypermarkets hold the largest market share in 2025 (xx%), followed by Convenience Stores (xx%) and Online Retail Stores (xx%). The growth of online retail channels is a key trend driving market expansion globally.
- North America: High per capita consumption, established market infrastructure, and strong consumer demand.
- Asia-Pacific: Rapid growth driven by increasing health awareness, rising disposable incomes, and expanding distribution networks.
- Supermarket/Hypermarket: Largest market share due to broad reach and established consumer shopping habits.
- Online Retail: Rapid growth driven by convenience, wider product selection, and targeted marketing.
Protein Bar Industry Product Landscape
The protein bar market offers a wide range of products, from traditional whey protein bars to innovative formulations using plant-based proteins, such as soy, pea, and brown rice. Recent innovations focus on improving taste and texture, incorporating functional ingredients, and offering unique flavors and formats. Performance metrics focus on protein content, macro-nutrient balance, and overall nutritional value. Unique selling propositions include specific health benefits (e.g., muscle growth, weight management) and appealing taste profiles. Advances in processing technology enable the creation of healthier and more appealing products.
Key Drivers, Barriers & Challenges in Protein Bar Industry
Key Drivers: Rising health and wellness trends; increasing demand for convenient and nutritious snacks; growing popularity of fitness and sports activities; technological innovations leading to improved product quality; expanding retail channels.
Challenges & Restraints: Intense competition, fluctuating raw material prices, stringent regulatory requirements, and maintaining high product quality and consistency. Supply chain disruptions and difficulties sourcing sustainable ingredients also pose significant challenges.
Emerging Opportunities in Protein Bar Industry
Emerging opportunities lie in the development of specialized protein bars targeting specific consumer segments (e.g., vegan, ketogenic diets), the expansion into untapped markets, and the utilization of novel protein sources and sustainable packaging materials. The development of personalized nutrition bars based on individual dietary needs and genetic profiles also holds significant potential.
Growth Accelerators in the Protein Bar Industry
Technological advancements, strategic partnerships between protein manufacturers and food retailers, and expansion into new geographic markets are key growth accelerators. The development of innovative product formats, improved taste and texture, and enhanced nutritional profiles all contribute to long-term market growth.
Key Players Shaping the Protein Bar Industry Market
- Caveman Foods LLC
- Simply Good Foods Co
- General Mills Inc.
- PepsiCo Inc.
- Lotus Bakeries
- GNC Holdings LLC
- Naturell India Pvt Ltd
- Mars Incorporated
- Fitshit Health Solutions Pvt Ltd
- The Hershey Company
- Associated British Foods PLC
- Stayfit Enterprize Private Limited
- Glanbia Plc
- Kellogg Company
Notable Milestones in Protein Bar Industry Sector
- January 2023: The Hershey Company launched caffeinated protein bars in vanilla latte and caramel macchiato flavors.
- April 2023: The Hershey Company launched ONE Brands Peanut Butter & Jelly Flavored Protein Bar with 20g protein and 1g sugar.
- May 2023: General Mills Inc. announced the expansion of its Nature Valley brand with savory nut crunch bars.
In-Depth Protein Bar Industry Market Outlook
The protein bar market is poised for continued growth driven by sustained consumer demand for convenient and healthy snacking options. Strategic investments in research and development, expansion into new markets, and the adoption of innovative manufacturing processes will further propel market growth. Opportunities for market expansion exist in emerging economies and through the development of tailored products for niche consumer segments.
Protein Bar Industry Segmentation
-
1. Distribution Channel
- 1.1. Convenience Store
- 1.2. Online Retail Store
- 1.3. Supermarket/Hypermarket
- 1.4. Others
Protein Bar Industry Segmentation By Geography
-
1. North America
- 1.1. United States
- 1.2. Canada
- 1.3. Mexico
-
2. South America
- 2.1. Brazil
- 2.2. Argentina
- 2.3. Rest of South America
-
3. Europe
- 3.1. United Kingdom
- 3.2. Germany
- 3.3. France
- 3.4. Italy
- 3.5. Spain
- 3.6. Russia
- 3.7. Benelux
- 3.8. Nordics
- 3.9. Rest of Europe
-
4. Middle East & Africa
- 4.1. Turkey
- 4.2. Israel
- 4.3. GCC
- 4.4. North Africa
- 4.5. South Africa
- 4.6. Rest of Middle East & Africa
-
5. Asia Pacific
- 5.1. China
- 5.2. India
- 5.3. Japan
- 5.4. South Korea
- 5.5. ASEAN
- 5.6. Oceania
- 5.7. Rest of Asia Pacific
Protein Bar Industry REPORT HIGHLIGHTS
| Aspects | Details |
|---|---|
| Study Period | 2019-2033 |
| Base Year | 2024 |
| Estimated Year | 2025 |
| Forecast Period | 2025-2033 |
| Historical Period | 2019-2024 |
| Growth Rate | CAGR of 6.10% from 2019-2033 |
| Segmentation |
|
Table of Contents
- 1. Introduction
- 1.1. Research Scope
- 1.2. Market Segmentation
- 1.3. Research Methodology
- 1.4. Definitions and Assumptions
- 2. Executive Summary
- 2.1. Introduction
- 3. Market Dynamics
- 3.1. Introduction
- 3.2. Market Drivers
- 3.2.1. Increasing Demand for Low-Fat and Fat-Free Food Products; Expanding Cosmetic and Personal Care Industries Utilize Gelatin for Various Purposes
- 3.3. Market Restrains
- 3.3.1. Fluctuations in Raw Material Proces Affecting Production Costs
- 3.4. Market Trends
- 3.4.1. OTHER KEY INDUSTRY TRENDS COVERED IN THE REPORT
- 4. Market Factor Analysis
- 4.1. Porters Five Forces
- 4.2. Supply/Value Chain
- 4.3. PESTEL analysis
- 4.4. Market Entropy
- 4.5. Patent/Trademark Analysis
- 5. Global Protein Bar Industry Analysis, Insights and Forecast, 2019-2031
- 5.1. Market Analysis, Insights and Forecast - by Distribution Channel
- 5.1.1. Convenience Store
- 5.1.2. Online Retail Store
- 5.1.3. Supermarket/Hypermarket
- 5.1.4. Others
- 5.2. Market Analysis, Insights and Forecast - by Region
- 5.2.1. North America
- 5.2.2. South America
- 5.2.3. Europe
- 5.2.4. Middle East & Africa
- 5.2.5. Asia Pacific
- 5.1. Market Analysis, Insights and Forecast - by Distribution Channel
- 6. North America Protein Bar Industry Analysis, Insights and Forecast, 2019-2031
- 6.1. Market Analysis, Insights and Forecast - by Distribution Channel
- 6.1.1. Convenience Store
- 6.1.2. Online Retail Store
- 6.1.3. Supermarket/Hypermarket
- 6.1.4. Others
- 6.1. Market Analysis, Insights and Forecast - by Distribution Channel
- 7. South America Protein Bar Industry Analysis, Insights and Forecast, 2019-2031
- 7.1. Market Analysis, Insights and Forecast - by Distribution Channel
- 7.1.1. Convenience Store
- 7.1.2. Online Retail Store
- 7.1.3. Supermarket/Hypermarket
- 7.1.4. Others
- 7.1. Market Analysis, Insights and Forecast - by Distribution Channel
- 8. Europe Protein Bar Industry Analysis, Insights and Forecast, 2019-2031
- 8.1. Market Analysis, Insights and Forecast - by Distribution Channel
- 8.1.1. Convenience Store
- 8.1.2. Online Retail Store
- 8.1.3. Supermarket/Hypermarket
- 8.1.4. Others
- 8.1. Market Analysis, Insights and Forecast - by Distribution Channel
- 9. Middle East & Africa Protein Bar Industry Analysis, Insights and Forecast, 2019-2031
- 9.1. Market Analysis, Insights and Forecast - by Distribution Channel
- 9.1.1. Convenience Store
- 9.1.2. Online Retail Store
- 9.1.3. Supermarket/Hypermarket
- 9.1.4. Others
- 9.1. Market Analysis, Insights and Forecast - by Distribution Channel
- 10. Asia Pacific Protein Bar Industry Analysis, Insights and Forecast, 2019-2031
- 10.1. Market Analysis, Insights and Forecast - by Distribution Channel
- 10.1.1. Convenience Store
- 10.1.2. Online Retail Store
- 10.1.3. Supermarket/Hypermarket
- 10.1.4. Others
- 10.1. Market Analysis, Insights and Forecast - by Distribution Channel
- 11. North America Protein Bar Industry Analysis, Insights and Forecast, 2019-2031
- 11.1. Market Analysis, Insights and Forecast - By Country/Sub-region
- 11.1.1 United States
- 11.1.2 Canada
- 11.1.3 Mexico
- 11.1.4 Rest of North America
- 12. Europe Protein Bar Industry Analysis, Insights and Forecast, 2019-2031
- 12.1. Market Analysis, Insights and Forecast - By Country/Sub-region
- 12.1.1 Germany
- 12.1.2 France
- 12.1.3 Italy
- 12.1.4 United Kingdom
- 12.1.5 Netherlands
- 12.1.6 Sweden
- 12.1.7 Rest of Europe
- 13. Asia Pacific Protein Bar Industry Analysis, Insights and Forecast, 2019-2031
- 13.1. Market Analysis, Insights and Forecast - By Country/Sub-region
- 13.1.1 China
- 13.1.2 India
- 13.1.3 Japan
- 13.1.4 South Korea
- 13.1.5 Rest of Asia Pacific
- 14. South America Protein Bar Industry Analysis, Insights and Forecast, 2019-2031
- 14.1. Market Analysis, Insights and Forecast - By Country/Sub-region
- 14.1.1 Brazil
- 14.1.2 Argentina
- 14.1.3 Rest of South America
- 15. Middle East Protein Bar Industry Analysis, Insights and Forecast, 2019-2031
- 15.1. Market Analysis, Insights and Forecast - By Country/Sub-region
- 15.1.1 Middle East
- 15.1.2 Africa
- 16. Competitive Analysis
- 16.1. Global Market Share Analysis 2024
- 16.2. Company Profiles
- 16.2.1 Caveman Foods LLC
- 16.2.1.1. Overview
- 16.2.1.2. Products
- 16.2.1.3. SWOT Analysis
- 16.2.1.4. Recent Developments
- 16.2.1.5. Financials (Based on Availability)
- 16.2.2 Simply Good Foods Co
- 16.2.2.1. Overview
- 16.2.2.2. Products
- 16.2.2.3. SWOT Analysis
- 16.2.2.4. Recent Developments
- 16.2.2.5. Financials (Based on Availability)
- 16.2.3 General Mills Inc
- 16.2.3.1. Overview
- 16.2.3.2. Products
- 16.2.3.3. SWOT Analysis
- 16.2.3.4. Recent Developments
- 16.2.3.5. Financials (Based on Availability)
- 16.2.4 PepsiCo Inc
- 16.2.4.1. Overview
- 16.2.4.2. Products
- 16.2.4.3. SWOT Analysis
- 16.2.4.4. Recent Developments
- 16.2.4.5. Financials (Based on Availability)
- 16.2.5 Lotus Bakeries
- 16.2.5.1. Overview
- 16.2.5.2. Products
- 16.2.5.3. SWOT Analysis
- 16.2.5.4. Recent Developments
- 16.2.5.5. Financials (Based on Availability)
- 16.2.6 GNC Holdings LLC
- 16.2.6.1. Overview
- 16.2.6.2. Products
- 16.2.6.3. SWOT Analysis
- 16.2.6.4. Recent Developments
- 16.2.6.5. Financials (Based on Availability)
- 16.2.7 Naturell India Pvt Ltd
- 16.2.7.1. Overview
- 16.2.7.2. Products
- 16.2.7.3. SWOT Analysis
- 16.2.7.4. Recent Developments
- 16.2.7.5. Financials (Based on Availability)
- 16.2.8 Mars Incorporated
- 16.2.8.1. Overview
- 16.2.8.2. Products
- 16.2.8.3. SWOT Analysis
- 16.2.8.4. Recent Developments
- 16.2.8.5. Financials (Based on Availability)
- 16.2.9 Fitshit Health Solutions Pvt Ltd
- 16.2.9.1. Overview
- 16.2.9.2. Products
- 16.2.9.3. SWOT Analysis
- 16.2.9.4. Recent Developments
- 16.2.9.5. Financials (Based on Availability)
- 16.2.10 The Hershey Compan
- 16.2.10.1. Overview
- 16.2.10.2. Products
- 16.2.10.3. SWOT Analysis
- 16.2.10.4. Recent Developments
- 16.2.10.5. Financials (Based on Availability)
- 16.2.11 Associated British Foods PLC
- 16.2.11.1. Overview
- 16.2.11.2. Products
- 16.2.11.3. SWOT Analysis
- 16.2.11.4. Recent Developments
- 16.2.11.5. Financials (Based on Availability)
- 16.2.12 Stayfit Enterprize Private Limited
- 16.2.12.1. Overview
- 16.2.12.2. Products
- 16.2.12.3. SWOT Analysis
- 16.2.12.4. Recent Developments
- 16.2.12.5. Financials (Based on Availability)
- 16.2.13 Glanbia Plc
- 16.2.13.1. Overview
- 16.2.13.2. Products
- 16.2.13.3. SWOT Analysis
- 16.2.13.4. Recent Developments
- 16.2.13.5. Financials (Based on Availability)
- 16.2.14 Kellogg Company
- 16.2.14.1. Overview
- 16.2.14.2. Products
- 16.2.14.3. SWOT Analysis
- 16.2.14.4. Recent Developments
- 16.2.14.5. Financials (Based on Availability)
- 16.2.1 Caveman Foods LLC
List of Figures
- Figure 1: Global Protein Bar Industry Revenue Breakdown (Million, %) by Region 2024 & 2032
- Figure 2: Global Protein Bar Industry Volume Breakdown (K Tons, %) by Region 2024 & 2032
- Figure 3: North America Protein Bar Industry Revenue (Million), by Country 2024 & 2032
- Figure 4: North America Protein Bar Industry Volume (K Tons), by Country 2024 & 2032
- Figure 5: North America Protein Bar Industry Revenue Share (%), by Country 2024 & 2032
- Figure 6: North America Protein Bar Industry Volume Share (%), by Country 2024 & 2032
- Figure 7: Europe Protein Bar Industry Revenue (Million), by Country 2024 & 2032
- Figure 8: Europe Protein Bar Industry Volume (K Tons), by Country 2024 & 2032
- Figure 9: Europe Protein Bar Industry Revenue Share (%), by Country 2024 & 2032
- Figure 10: Europe Protein Bar Industry Volume Share (%), by Country 2024 & 2032
- Figure 11: Asia Pacific Protein Bar Industry Revenue (Million), by Country 2024 & 2032
- Figure 12: Asia Pacific Protein Bar Industry Volume (K Tons), by Country 2024 & 2032
- Figure 13: Asia Pacific Protein Bar Industry Revenue Share (%), by Country 2024 & 2032
- Figure 14: Asia Pacific Protein Bar Industry Volume Share (%), by Country 2024 & 2032
- Figure 15: South America Protein Bar Industry Revenue (Million), by Country 2024 & 2032
- Figure 16: South America Protein Bar Industry Volume (K Tons), by Country 2024 & 2032
- Figure 17: South America Protein Bar Industry Revenue Share (%), by Country 2024 & 2032
- Figure 18: South America Protein Bar Industry Volume Share (%), by Country 2024 & 2032
- Figure 19: Middle East Protein Bar Industry Revenue (Million), by Country 2024 & 2032
- Figure 20: Middle East Protein Bar Industry Volume (K Tons), by Country 2024 & 2032
- Figure 21: Middle East Protein Bar Industry Revenue Share (%), by Country 2024 & 2032
- Figure 22: Middle East Protein Bar Industry Volume Share (%), by Country 2024 & 2032
- Figure 23: North America Protein Bar Industry Revenue (Million), by Distribution Channel 2024 & 2032
- Figure 24: North America Protein Bar Industry Volume (K Tons), by Distribution Channel 2024 & 2032
- Figure 25: North America Protein Bar Industry Revenue Share (%), by Distribution Channel 2024 & 2032
- Figure 26: North America Protein Bar Industry Volume Share (%), by Distribution Channel 2024 & 2032
- Figure 27: North America Protein Bar Industry Revenue (Million), by Country 2024 & 2032
- Figure 28: North America Protein Bar Industry Volume (K Tons), by Country 2024 & 2032
- Figure 29: North America Protein Bar Industry Revenue Share (%), by Country 2024 & 2032
- Figure 30: North America Protein Bar Industry Volume Share (%), by Country 2024 & 2032
- Figure 31: South America Protein Bar Industry Revenue (Million), by Distribution Channel 2024 & 2032
- Figure 32: South America Protein Bar Industry Volume (K Tons), by Distribution Channel 2024 & 2032
- Figure 33: South America Protein Bar Industry Revenue Share (%), by Distribution Channel 2024 & 2032
- Figure 34: South America Protein Bar Industry Volume Share (%), by Distribution Channel 2024 & 2032
- Figure 35: South America Protein Bar Industry Revenue (Million), by Country 2024 & 2032
- Figure 36: South America Protein Bar Industry Volume (K Tons), by Country 2024 & 2032
- Figure 37: South America Protein Bar Industry Revenue Share (%), by Country 2024 & 2032
- Figure 38: South America Protein Bar Industry Volume Share (%), by Country 2024 & 2032
- Figure 39: Europe Protein Bar Industry Revenue (Million), by Distribution Channel 2024 & 2032
- Figure 40: Europe Protein Bar Industry Volume (K Tons), by Distribution Channel 2024 & 2032
- Figure 41: Europe Protein Bar Industry Revenue Share (%), by Distribution Channel 2024 & 2032
- Figure 42: Europe Protein Bar Industry Volume Share (%), by Distribution Channel 2024 & 2032
- Figure 43: Europe Protein Bar Industry Revenue (Million), by Country 2024 & 2032
- Figure 44: Europe Protein Bar Industry Volume (K Tons), by Country 2024 & 2032
- Figure 45: Europe Protein Bar Industry Revenue Share (%), by Country 2024 & 2032
- Figure 46: Europe Protein Bar Industry Volume Share (%), by Country 2024 & 2032
- Figure 47: Middle East & Africa Protein Bar Industry Revenue (Million), by Distribution Channel 2024 & 2032
- Figure 48: Middle East & Africa Protein Bar Industry Volume (K Tons), by Distribution Channel 2024 & 2032
- Figure 49: Middle East & Africa Protein Bar Industry Revenue Share (%), by Distribution Channel 2024 & 2032
- Figure 50: Middle East & Africa Protein Bar Industry Volume Share (%), by Distribution Channel 2024 & 2032
- Figure 51: Middle East & Africa Protein Bar Industry Revenue (Million), by Country 2024 & 2032
- Figure 52: Middle East & Africa Protein Bar Industry Volume (K Tons), by Country 2024 & 2032
- Figure 53: Middle East & Africa Protein Bar Industry Revenue Share (%), by Country 2024 & 2032
- Figure 54: Middle East & Africa Protein Bar Industry Volume Share (%), by Country 2024 & 2032
- Figure 55: Asia Pacific Protein Bar Industry Revenue (Million), by Distribution Channel 2024 & 2032
- Figure 56: Asia Pacific Protein Bar Industry Volume (K Tons), by Distribution Channel 2024 & 2032
- Figure 57: Asia Pacific Protein Bar Industry Revenue Share (%), by Distribution Channel 2024 & 2032
- Figure 58: Asia Pacific Protein Bar Industry Volume Share (%), by Distribution Channel 2024 & 2032
- Figure 59: Asia Pacific Protein Bar Industry Revenue (Million), by Country 2024 & 2032
- Figure 60: Asia Pacific Protein Bar Industry Volume (K Tons), by Country 2024 & 2032
- Figure 61: Asia Pacific Protein Bar Industry Revenue Share (%), by Country 2024 & 2032
- Figure 62: Asia Pacific Protein Bar Industry Volume Share (%), by Country 2024 & 2032
List of Tables
- Table 1: Global Protein Bar Industry Revenue Million Forecast, by Region 2019 & 2032
- Table 2: Global Protein Bar Industry Volume K Tons Forecast, by Region 2019 & 2032
- Table 3: Global Protein Bar Industry Revenue Million Forecast, by Distribution Channel 2019 & 2032
- Table 4: Global Protein Bar Industry Volume K Tons Forecast, by Distribution Channel 2019 & 2032
- Table 5: Global Protein Bar Industry Revenue Million Forecast, by Region 2019 & 2032
- Table 6: Global Protein Bar Industry Volume K Tons Forecast, by Region 2019 & 2032
- Table 7: Global Protein Bar Industry Revenue Million Forecast, by Country 2019 & 2032
- Table 8: Global Protein Bar Industry Volume K Tons Forecast, by Country 2019 & 2032
- Table 9: United States Protein Bar Industry Revenue (Million) Forecast, by Application 2019 & 2032
- Table 10: United States Protein Bar Industry Volume (K Tons) Forecast, by Application 2019 & 2032
- Table 11: Canada Protein Bar Industry Revenue (Million) Forecast, by Application 2019 & 2032
- Table 12: Canada Protein Bar Industry Volume (K Tons) Forecast, by Application 2019 & 2032
- Table 13: Mexico Protein Bar Industry Revenue (Million) Forecast, by Application 2019 & 2032
- Table 14: Mexico Protein Bar Industry Volume (K Tons) Forecast, by Application 2019 & 2032
- Table 15: Rest of North America Protein Bar Industry Revenue (Million) Forecast, by Application 2019 & 2032
- Table 16: Rest of North America Protein Bar Industry Volume (K Tons) Forecast, by Application 2019 & 2032
- Table 17: Global Protein Bar Industry Revenue Million Forecast, by Country 2019 & 2032
- Table 18: Global Protein Bar Industry Volume K Tons Forecast, by Country 2019 & 2032
- Table 19: Germany Protein Bar Industry Revenue (Million) Forecast, by Application 2019 & 2032
- Table 20: Germany Protein Bar Industry Volume (K Tons) Forecast, by Application 2019 & 2032
- Table 21: France Protein Bar Industry Revenue (Million) Forecast, by Application 2019 & 2032
- Table 22: France Protein Bar Industry Volume (K Tons) Forecast, by Application 2019 & 2032
- Table 23: Italy Protein Bar Industry Revenue (Million) Forecast, by Application 2019 & 2032
- Table 24: Italy Protein Bar Industry Volume (K Tons) Forecast, by Application 2019 & 2032
- Table 25: United Kingdom Protein Bar Industry Revenue (Million) Forecast, by Application 2019 & 2032
- Table 26: United Kingdom Protein Bar Industry Volume (K Tons) Forecast, by Application 2019 & 2032
- Table 27: Netherlands Protein Bar Industry Revenue (Million) Forecast, by Application 2019 & 2032
- Table 28: Netherlands Protein Bar Industry Volume (K Tons) Forecast, by Application 2019 & 2032
- Table 29: Sweden Protein Bar Industry Revenue (Million) Forecast, by Application 2019 & 2032
- Table 30: Sweden Protein Bar Industry Volume (K Tons) Forecast, by Application 2019 & 2032
- Table 31: Rest of Europe Protein Bar Industry Revenue (Million) Forecast, by Application 2019 & 2032
- Table 32: Rest of Europe Protein Bar Industry Volume (K Tons) Forecast, by Application 2019 & 2032
- Table 33: Global Protein Bar Industry Revenue Million Forecast, by Country 2019 & 2032
- Table 34: Global Protein Bar Industry Volume K Tons Forecast, by Country 2019 & 2032
- Table 35: China Protein Bar Industry Revenue (Million) Forecast, by Application 2019 & 2032
- Table 36: China Protein Bar Industry Volume (K Tons) Forecast, by Application 2019 & 2032
- Table 37: India Protein Bar Industry Revenue (Million) Forecast, by Application 2019 & 2032
- Table 38: India Protein Bar Industry Volume (K Tons) Forecast, by Application 2019 & 2032
- Table 39: Japan Protein Bar Industry Revenue (Million) Forecast, by Application 2019 & 2032
- Table 40: Japan Protein Bar Industry Volume (K Tons) Forecast, by Application 2019 & 2032
- Table 41: South Korea Protein Bar Industry Revenue (Million) Forecast, by Application 2019 & 2032
- Table 42: South Korea Protein Bar Industry Volume (K Tons) Forecast, by Application 2019 & 2032
- Table 43: Rest of Asia Pacific Protein Bar Industry Revenue (Million) Forecast, by Application 2019 & 2032
- Table 44: Rest of Asia Pacific Protein Bar Industry Volume (K Tons) Forecast, by Application 2019 & 2032
- Table 45: Global Protein Bar Industry Revenue Million Forecast, by Country 2019 & 2032
- Table 46: Global Protein Bar Industry Volume K Tons Forecast, by Country 2019 & 2032
- Table 47: Brazil Protein Bar Industry Revenue (Million) Forecast, by Application 2019 & 2032
- Table 48: Brazil Protein Bar Industry Volume (K Tons) Forecast, by Application 2019 & 2032
- Table 49: Argentina Protein Bar Industry Revenue (Million) Forecast, by Application 2019 & 2032
- Table 50: Argentina Protein Bar Industry Volume (K Tons) Forecast, by Application 2019 & 2032
- Table 51: Rest of South America Protein Bar Industry Revenue (Million) Forecast, by Application 2019 & 2032
- Table 52: Rest of South America Protein Bar Industry Volume (K Tons) Forecast, by Application 2019 & 2032
- Table 53: Global Protein Bar Industry Revenue Million Forecast, by Country 2019 & 2032
- Table 54: Global Protein Bar Industry Volume K Tons Forecast, by Country 2019 & 2032
- Table 55: Middle East Protein Bar Industry Revenue (Million) Forecast, by Application 2019 & 2032
- Table 56: Middle East Protein Bar Industry Volume (K Tons) Forecast, by Application 2019 & 2032
- Table 57: Africa Protein Bar Industry Revenue (Million) Forecast, by Application 2019 & 2032
- Table 58: Africa Protein Bar Industry Volume (K Tons) Forecast, by Application 2019 & 2032
- Table 59: Global Protein Bar Industry Revenue Million Forecast, by Distribution Channel 2019 & 2032
- Table 60: Global Protein Bar Industry Volume K Tons Forecast, by Distribution Channel 2019 & 2032
- Table 61: Global Protein Bar Industry Revenue Million Forecast, by Country 2019 & 2032
- Table 62: Global Protein Bar Industry Volume K Tons Forecast, by Country 2019 & 2032
- Table 63: United States Protein Bar Industry Revenue (Million) Forecast, by Application 2019 & 2032
- Table 64: United States Protein Bar Industry Volume (K Tons) Forecast, by Application 2019 & 2032
- Table 65: Canada Protein Bar Industry Revenue (Million) Forecast, by Application 2019 & 2032
- Table 66: Canada Protein Bar Industry Volume (K Tons) Forecast, by Application 2019 & 2032
- Table 67: Mexico Protein Bar Industry Revenue (Million) Forecast, by Application 2019 & 2032
- Table 68: Mexico Protein Bar Industry Volume (K Tons) Forecast, by Application 2019 & 2032
- Table 69: Global Protein Bar Industry Revenue Million Forecast, by Distribution Channel 2019 & 2032
- Table 70: Global Protein Bar Industry Volume K Tons Forecast, by Distribution Channel 2019 & 2032
- Table 71: Global Protein Bar Industry Revenue Million Forecast, by Country 2019 & 2032
- Table 72: Global Protein Bar Industry Volume K Tons Forecast, by Country 2019 & 2032
- Table 73: Brazil Protein Bar Industry Revenue (Million) Forecast, by Application 2019 & 2032
- Table 74: Brazil Protein Bar Industry Volume (K Tons) Forecast, by Application 2019 & 2032
- Table 75: Argentina Protein Bar Industry Revenue (Million) Forecast, by Application 2019 & 2032
- Table 76: Argentina Protein Bar Industry Volume (K Tons) Forecast, by Application 2019 & 2032
- Table 77: Rest of South America Protein Bar Industry Revenue (Million) Forecast, by Application 2019 & 2032
- Table 78: Rest of South America Protein Bar Industry Volume (K Tons) Forecast, by Application 2019 & 2032
- Table 79: Global Protein Bar Industry Revenue Million Forecast, by Distribution Channel 2019 & 2032
- Table 80: Global Protein Bar Industry Volume K Tons Forecast, by Distribution Channel 2019 & 2032
- Table 81: Global Protein Bar Industry Revenue Million Forecast, by Country 2019 & 2032
- Table 82: Global Protein Bar Industry Volume K Tons Forecast, by Country 2019 & 2032
- Table 83: United Kingdom Protein Bar Industry Revenue (Million) Forecast, by Application 2019 & 2032
- Table 84: United Kingdom Protein Bar Industry Volume (K Tons) Forecast, by Application 2019 & 2032
- Table 85: Germany Protein Bar Industry Revenue (Million) Forecast, by Application 2019 & 2032
- Table 86: Germany Protein Bar Industry Volume (K Tons) Forecast, by Application 2019 & 2032
- Table 87: France Protein Bar Industry Revenue (Million) Forecast, by Application 2019 & 2032
- Table 88: France Protein Bar Industry Volume (K Tons) Forecast, by Application 2019 & 2032
- Table 89: Italy Protein Bar Industry Revenue (Million) Forecast, by Application 2019 & 2032
- Table 90: Italy Protein Bar Industry Volume (K Tons) Forecast, by Application 2019 & 2032
- Table 91: Spain Protein Bar Industry Revenue (Million) Forecast, by Application 2019 & 2032
- Table 92: Spain Protein Bar Industry Volume (K Tons) Forecast, by Application 2019 & 2032
- Table 93: Russia Protein Bar Industry Revenue (Million) Forecast, by Application 2019 & 2032
- Table 94: Russia Protein Bar Industry Volume (K Tons) Forecast, by Application 2019 & 2032
- Table 95: Benelux Protein Bar Industry Revenue (Million) Forecast, by Application 2019 & 2032
- Table 96: Benelux Protein Bar Industry Volume (K Tons) Forecast, by Application 2019 & 2032
- Table 97: Nordics Protein Bar Industry Revenue (Million) Forecast, by Application 2019 & 2032
- Table 98: Nordics Protein Bar Industry Volume (K Tons) Forecast, by Application 2019 & 2032
- Table 99: Rest of Europe Protein Bar Industry Revenue (Million) Forecast, by Application 2019 & 2032
- Table 100: Rest of Europe Protein Bar Industry Volume (K Tons) Forecast, by Application 2019 & 2032
- Table 101: Global Protein Bar Industry Revenue Million Forecast, by Distribution Channel 2019 & 2032
- Table 102: Global Protein Bar Industry Volume K Tons Forecast, by Distribution Channel 2019 & 2032
- Table 103: Global Protein Bar Industry Revenue Million Forecast, by Country 2019 & 2032
- Table 104: Global Protein Bar Industry Volume K Tons Forecast, by Country 2019 & 2032
- Table 105: Turkey Protein Bar Industry Revenue (Million) Forecast, by Application 2019 & 2032
- Table 106: Turkey Protein Bar Industry Volume (K Tons) Forecast, by Application 2019 & 2032
- Table 107: Israel Protein Bar Industry Revenue (Million) Forecast, by Application 2019 & 2032
- Table 108: Israel Protein Bar Industry Volume (K Tons) Forecast, by Application 2019 & 2032
- Table 109: GCC Protein Bar Industry Revenue (Million) Forecast, by Application 2019 & 2032
- Table 110: GCC Protein Bar Industry Volume (K Tons) Forecast, by Application 2019 & 2032
- Table 111: North Africa Protein Bar Industry Revenue (Million) Forecast, by Application 2019 & 2032
- Table 112: North Africa Protein Bar Industry Volume (K Tons) Forecast, by Application 2019 & 2032
- Table 113: South Africa Protein Bar Industry Revenue (Million) Forecast, by Application 2019 & 2032
- Table 114: South Africa Protein Bar Industry Volume (K Tons) Forecast, by Application 2019 & 2032
- Table 115: Rest of Middle East & Africa Protein Bar Industry Revenue (Million) Forecast, by Application 2019 & 2032
- Table 116: Rest of Middle East & Africa Protein Bar Industry Volume (K Tons) Forecast, by Application 2019 & 2032
- Table 117: Global Protein Bar Industry Revenue Million Forecast, by Distribution Channel 2019 & 2032
- Table 118: Global Protein Bar Industry Volume K Tons Forecast, by Distribution Channel 2019 & 2032
- Table 119: Global Protein Bar Industry Revenue Million Forecast, by Country 2019 & 2032
- Table 120: Global Protein Bar Industry Volume K Tons Forecast, by Country 2019 & 2032
- Table 121: China Protein Bar Industry Revenue (Million) Forecast, by Application 2019 & 2032
- Table 122: China Protein Bar Industry Volume (K Tons) Forecast, by Application 2019 & 2032
- Table 123: India Protein Bar Industry Revenue (Million) Forecast, by Application 2019 & 2032
- Table 124: India Protein Bar Industry Volume (K Tons) Forecast, by Application 2019 & 2032
- Table 125: Japan Protein Bar Industry Revenue (Million) Forecast, by Application 2019 & 2032
- Table 126: Japan Protein Bar Industry Volume (K Tons) Forecast, by Application 2019 & 2032
- Table 127: South Korea Protein Bar Industry Revenue (Million) Forecast, by Application 2019 & 2032
- Table 128: South Korea Protein Bar Industry Volume (K Tons) Forecast, by Application 2019 & 2032
- Table 129: ASEAN Protein Bar Industry Revenue (Million) Forecast, by Application 2019 & 2032
- Table 130: ASEAN Protein Bar Industry Volume (K Tons) Forecast, by Application 2019 & 2032
- Table 131: Oceania Protein Bar Industry Revenue (Million) Forecast, by Application 2019 & 2032
- Table 132: Oceania Protein Bar Industry Volume (K Tons) Forecast, by Application 2019 & 2032
- Table 133: Rest of Asia Pacific Protein Bar Industry Revenue (Million) Forecast, by Application 2019 & 2032
- Table 134: Rest of Asia Pacific Protein Bar Industry Volume (K Tons) Forecast, by Application 2019 & 2032
Frequently Asked Questions
1. What is the projected Compound Annual Growth Rate (CAGR) of the Protein Bar Industry?
The projected CAGR is approximately 6.10%.
2. Which companies are prominent players in the Protein Bar Industry?
Key companies in the market include Caveman Foods LLC, Simply Good Foods Co, General Mills Inc, PepsiCo Inc, Lotus Bakeries, GNC Holdings LLC, Naturell India Pvt Ltd, Mars Incorporated, Fitshit Health Solutions Pvt Ltd, The Hershey Compan, Associated British Foods PLC, Stayfit Enterprize Private Limited, Glanbia Plc, Kellogg Company.
3. What are the main segments of the Protein Bar Industry?
The market segments include Distribution Channel.
4. Can you provide details about the market size?
The market size is estimated to be USD 4910 Million as of 2022.
5. What are some drivers contributing to market growth?
Increasing Demand for Low-Fat and Fat-Free Food Products; Expanding Cosmetic and Personal Care Industries Utilize Gelatin for Various Purposes.
6. What are the notable trends driving market growth?
OTHER KEY INDUSTRY TRENDS COVERED IN THE REPORT.
7. Are there any restraints impacting market growth?
Fluctuations in Raw Material Proces Affecting Production Costs.
8. Can you provide examples of recent developments in the market?
May 2023: General Mills Inc. announced that it would be expanding its Nature Valley brand with the introduction of Nature Valley Savory Nut Crunch Bars.April 2023: Under the brand ONE Brands, The Hershey Company launched the Peanut Butter & Jelly Flavored Protein Bar. The ONE Limited Edition Peanut Butter & Jelly flavored bars are packed with 20 grams of protein, 1 gram of sugar, and the taste of peanut butter and strawberry jelly flavors.January 2023: The Hershey Company launched caffeinated protein bars. The range is available in two flavors: vanilla latte and caramel macchiato.
9. What pricing options are available for accessing the report?
Pricing options include single-user, multi-user, and enterprise licenses priced at USD 3800, USD 4500, and USD 5800 respectively.
10. Is the market size provided in terms of value or volume?
The market size is provided in terms of value, measured in Million and volume, measured in K Tons.
11. Are there any specific market keywords associated with the report?
Yes, the market keyword associated with the report is "Protein Bar Industry," which aids in identifying and referencing the specific market segment covered.
12. How do I determine which pricing option suits my needs best?
The pricing options vary based on user requirements and access needs. Individual users may opt for single-user licenses, while businesses requiring broader access may choose multi-user or enterprise licenses for cost-effective access to the report.
13. Are there any additional resources or data provided in the Protein Bar Industry report?
While the report offers comprehensive insights, it's advisable to review the specific contents or supplementary materials provided to ascertain if additional resources or data are available.
14. How can I stay updated on further developments or reports in the Protein Bar Industry?
To stay informed about further developments, trends, and reports in the Protein Bar Industry, consider subscribing to industry newsletters, following relevant companies and organizations, or regularly checking reputable industry news sources and publications.
Methodology
Step 1 - Identification of Relevant Samples Size from Population Database


Step 2 - Approaches for Defining Global Market Size (Value, Volume* & Price*)

Note*: In applicable scenarios
Step 3 - Data Sources
Primary Research
- Web Analytics
- Survey Reports
- Research Institute
- Latest Research Reports
- Opinion Leaders
Secondary Research
- Annual Reports
- White Paper
- Latest Press Release
- Industry Association
- Paid Database
- Investor Presentations

Step 4 - Data Triangulation
Involves using different sources of information in order to increase the validity of a study
These sources are likely to be stakeholders in a program - participants, other researchers, program staff, other community members, and so on.
Then we put all data in single framework & apply various statistical tools to find out the dynamic on the market.
During the analysis stage, feedback from the stakeholder groups would be compared to determine areas of agreement as well as areas of divergence
