

Key Insights
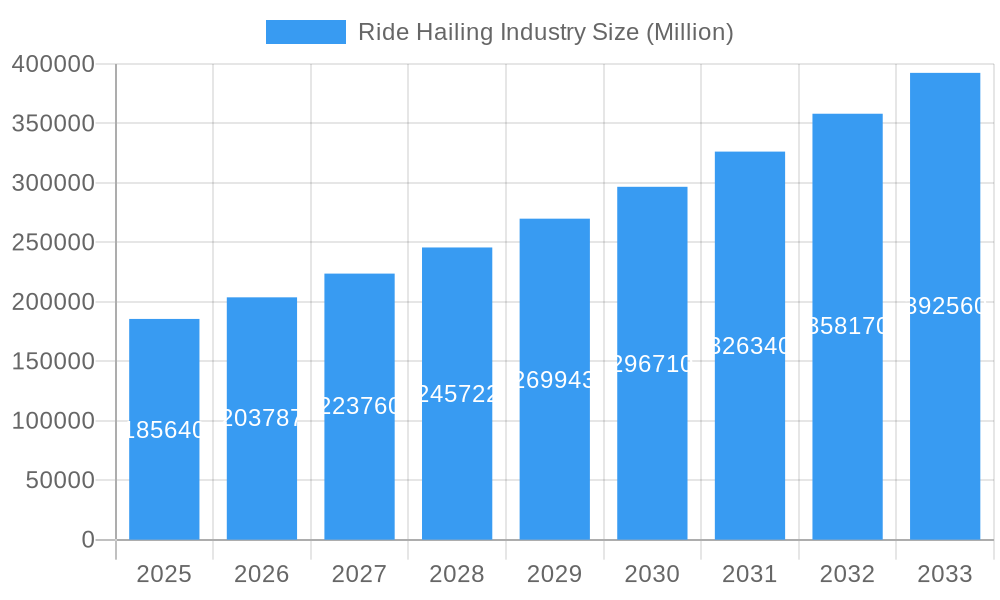
The ride-hailing industry, valued at $185.64 billion in 2025, is experiencing robust growth, projected to expand at a compound annual growth rate (CAGR) of 9.64% from 2025 to 2033. This expansion is fueled by several key drivers. Increasing urbanization and traffic congestion in major cities globally are compelling consumers to opt for convenient and efficient ride-sharing services over personal vehicle ownership. The rising adoption of smartphones and readily available mobile applications further enhances accessibility and ease of use. Furthermore, the continuous technological advancements in navigation systems, payment gateways, and driver management platforms contribute to improved user experience and operational efficiency for ride-hailing companies. The industry is also witnessing the emergence of innovative service models, including subscription-based services and integrations with other transportation modes, which cater to diverse consumer needs and preferences. However, challenges such as regulatory hurdles, driver welfare concerns, and competition from public transportation systems pose significant restraints to the industry's unhindered growth. The market segmentation reveals that the car segment dominates the vehicle type category, while the internal combustion engine (ICE) segment currently holds a larger market share than electric vehicles, although the latter is experiencing rapid growth due to environmental concerns and government incentives.
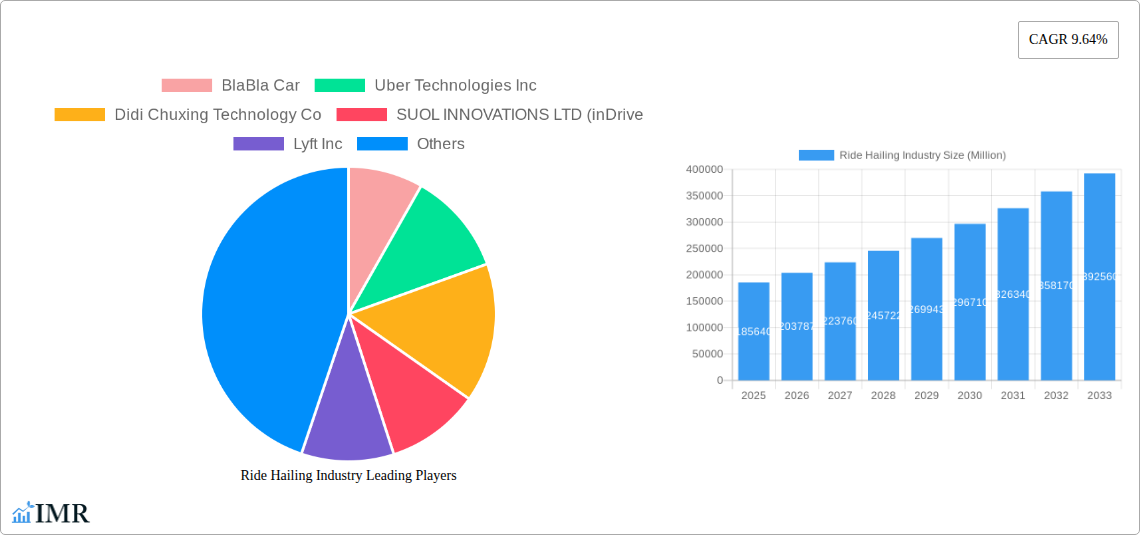
Ride Hailing Industry Market Size (In Billion)
The competitive landscape is intensely dynamic, with established players like Uber, Lyft, and Didi Chuxing dominating the market, while regional players like Ola and Grab are making significant inroads in their respective geographical territories. The expansion into new markets, particularly in developing economies with burgeoning populations and increasing disposable incomes, offers substantial growth opportunities. Strategic alliances and mergers and acquisitions are becoming increasingly common as companies strive to enhance their market position and consolidate their share. The ongoing integration of technology, such as AI-powered fare optimization and autonomous driving technology, will further reshape the industry's dynamics and competition in the coming years. The forecast period reveals a significant upward trajectory for the ride-hailing industry, underpinned by continuous innovation, technological advancements, and growing consumer demand for convenient and cost-effective transportation solutions. Geographic expansion into underserved regions, particularly within Asia-Pacific and Africa, will play a crucial role in driving future growth.
Ride Hailing Industry Company Market Share
Ride Hailing Industry Market Report: 2019-2033
This comprehensive report provides an in-depth analysis of the global ride-hailing industry, encompassing market dynamics, growth trends, regional dominance, product landscape, key players, and future outlook. The study period covers 2019-2033, with 2025 as the base and estimated year. This report is invaluable for industry professionals, investors, and strategists seeking to understand and capitalize on the opportunities within this rapidly evolving sector. The report analyzes the parent market of Transportation Services and its child market of Ride Hailing.
Ride Hailing Industry Market Dynamics & Structure
The ride-hailing market is characterized by intense competition, rapid technological advancements, and evolving regulatory landscapes. Market concentration is high, with a few major players controlling significant market share. However, the emergence of regional players and innovative startups is disrupting the established order. Technological innovations, such as autonomous driving and electric vehicle integration, are reshaping the industry, driving efficiency and sustainability. Regulatory frameworks vary significantly across regions, impacting market access and operational costs. The industry also faces competition from alternative transportation options, including public transport and personal vehicle ownership. The market is witnessing a wave of mergers and acquisitions (M&A) activity, as larger players seek to consolidate their market position and expand their geographical reach.
- Market Concentration: Top 5 players hold approximately xx% of the global market share in 2025 (Estimated).
- M&A Activity: xx billion USD in M&A deals in the historical period (2019-2024). This is projected to increase to xx billion USD during the forecast period.
- Innovation Barriers: High capital investment requirements for autonomous vehicle development, regulatory uncertainty, and cybersecurity concerns hinder innovation.
- End-User Demographics: Predominantly young adults and urban populations are driving the demand, although this demographic is expanding rapidly.
- Competitive Substitutes: Public transport, ride-sharing services, car ownership.
Ride Hailing Industry Growth Trends & Insights
The global ride-hailing market experienced significant growth during the historical period (2019-2024), fueled by increasing smartphone penetration, urbanization, and changing consumer preferences. The market size reached xx million units in 2024 and is projected to reach xx million units by 2033, exhibiting a Compound Annual Growth Rate (CAGR) of xx%. This growth is attributed to several factors, including the rising adoption of ride-hailing services, technological advancements such as the integration of AI-powered dispatch systems and the use of electric vehicles, and evolving consumer behavior toward convenience and on-demand services. Market penetration is growing, particularly in emerging economies with improving infrastructure and expanding smartphone ownership.
Dominant Regions, Countries, or Segments in Ride Hailing Industry
Asia-Pacific and North America are currently the dominant regions in the ride-hailing market, representing xx% and xx% of the global market share in 2025 (Estimated), respectively. However, strong growth is anticipated in other regions, such as Latin America and Africa, driven by increasing urbanization, young populations, and rising disposable incomes.
By Vehicle Type:
- Cars: Remains the dominant segment, accounting for xx% of the market in 2025 (Estimated).
- Motorcycles: Significant market share in densely populated Asian countries like India and Vietnam. (xx% in 2025 Estimated)
- Vans/Buses: Growth in demand for shared rides and airport transfers fuels this segment. (xx% in 2025 Estimated)
By Propulsion Type:
Internal Combustion Engine (ICE): Currently dominant, but facing gradual decline due to environmental concerns and government regulations. (xx% in 2025 Estimated)
Electric: Rapid growth is expected, driven by government incentives, technological advancements, and increasing consumer preference for eco-friendly options. (xx% in 2025 Estimated)
Key Drivers:
- Favorable government policies supporting ride-hailing services
- Improving infrastructure in developing countries
- Growing smartphone penetration and internet access
- Increased adoption of cashless transactions
Dominance Factors: High population density, strong economic growth, favorable regulatory environments, and a significant number of smartphone users contribute to regional market leadership.
Ride Hailing Industry Product Landscape
Ride-hailing services have evolved beyond basic transportation, incorporating features like ride-sharing, premium ride options, delivery services, and integrated payment systems. Technological advancements have led to improved route optimization, real-time tracking, and increased safety features. Unique selling propositions include convenience, affordability, and accessibility, often enhanced by loyalty programs and personalized experiences. The integration of electric vehicles and autonomous driving technologies presents a key area of innovation and differentiation.
Key Drivers, Barriers & Challenges in Ride Hailing Industry
Key Drivers:
- Technological advancements (AI, autonomous driving, electric vehicles)
- Rising urbanization and increased commute times
- Growing smartphone penetration and data accessibility
- Government initiatives promoting ride-hailing services in some regions.
Key Challenges:
- Intense competition and pricing pressures
- Regulatory hurdles (licensing, permits, insurance)
- Safety concerns (driver and passenger safety)
- Supply chain disruptions impacting vehicle availability. This resulted in a xx% increase in operating costs in 2024.
Emerging Opportunities in Ride Hailing Industry
- Expansion into untapped markets (rural areas, developing countries)
- Integration with public transport systems
- Development of specialized services (e.g., healthcare transportation, delivery of goods)
- Personalized services and customized ride options.
Growth Accelerators in the Ride Hailing Industry Industry
Technological advancements in autonomous driving and electric vehicles, coupled with strategic partnerships (e.g., with logistics providers and other businesses), present significant growth potential. Expanding into underserved markets and offering specialized services further accelerate market expansion. Moreover, focusing on sustainability initiatives and addressing consumer concerns related to safety and security will enhance market credibility and drive future growth.
Key Players Shaping the Ride Hailing Industry Market
Notable Milestones in Ride Hailing Industry Sector
- December 2023: TH International Limited partners with DiDi Chuxing for a brand-building campaign.
- March 2024: Waymo launches its free ride-hailing service, Waymo One, in Los Angeles.
- April 2024: The Japanese government officially implements the use of private ride-hailing services via mobile applications.
In-Depth Ride Hailing Industry Market Outlook
The ride-hailing industry is poised for continued growth, driven by technological advancements, increasing urbanization, and evolving consumer preferences. Strategic partnerships, expansion into new markets, and the development of innovative services will be key factors in shaping future market dynamics. The focus on sustainability and safety will also play a crucial role in determining long-term market success. The market shows significant promise for continued expansion in the forecast period (2025-2033).
Ride Hailing Industry Segmentation
-
1. Vehicle Type
- 1.1. Motorcycles
- 1.2. Cars
- 1.3. Vans
- 1.4. Buses
-
2. Propulsion Type
- 2.1. Internal Combustion Engine (ICE)
- 2.2. Electric
Ride Hailing Industry Segmentation By Geography
-
1. North America
- 1.1. United States
- 1.2. Canada
- 1.3. Rest of North America
-
2. Europe
- 2.1. Germany
- 2.2. United Kingdom
- 2.3. France
- 2.4. Italy
- 2.5. Rest of Europe
-
3. Asia Pacific
- 3.1. China
- 3.2. India
- 3.3. Japan
- 3.4. South Korea
- 3.5. Rest of Asia Pacific
-
4. Rest of the World
- 4.1. South America
- 4.2. Middle East and Africa
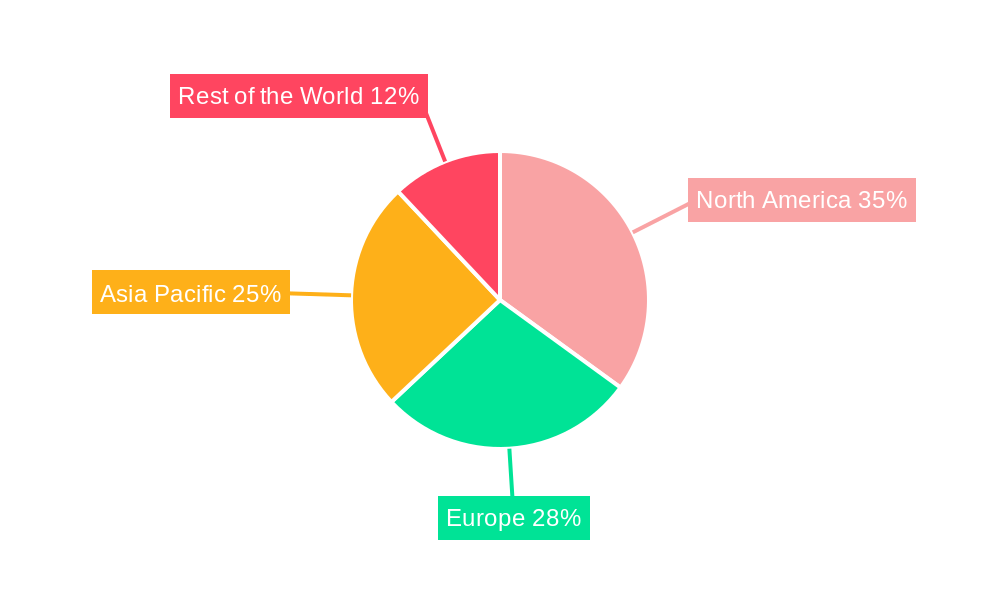
Ride Hailing Industry Regional Market Share
Geographic Coverage of Ride Hailing Industry
Ride Hailing Industry REPORT HIGHLIGHTS
| Aspects | Details |
|---|---|
| Study Period | 2020-2034 |
| Base Year | 2025 |
| Estimated Year | 2026 |
| Forecast Period | 2026-2034 |
| Historical Period | 2020-2025 |
| Growth Rate | CAGR of 9.64% from 2020-2034 |
| Segmentation |
|
Table of Contents
- 1. Introduction
- 1.1. Research Scope
- 1.2. Market Segmentation
- 1.3. Research Objective
- 1.4. Definitions and Assumptions
- 2. Executive Summary
- 2.1. Market Snapshot
- 3. Market Dynamics
- 3.1. Market Drivers
- 3.2. Market Restrains
- 3.3. Market Trends
- 3.4. Market Opportunities
- 4. Market Factor Analysis
- 4.1. Porters Five Forces
- 4.1.1. Bargaining Power of Suppliers
- 4.1.2. Bargaining Power of Buyers
- 4.1.3. Threat of New Entrants
- 4.1.4. Threat of Substitutes
- 4.1.5. Competitive Rivalry
- 4.2. PESTEL analysis
- 4.3. BCG Analysis
- 4.3.1. Stars (High Growth, High Market Share)
- 4.3.2. Cash Cows (Low Growth, High Market Share)
- 4.3.3. Question Mark (High Growth, Low Market Share)
- 4.3.4. Dogs (Low Growth, Low Market Share)
- 4.4. Ansoff Matrix Analysis
- 4.5. Supply Chain Analysis
- 4.6. Regulatory Landscape
- 4.7. Current Market Potential and Opportunity Assessment (TAM–SAM–SOM Framework)
- 4.8. IMR Analyst Note
- 4.1. Porters Five Forces
- 5. Market Analysis, Insights and Forecast 2021-2033
- 5.1. Market Analysis, Insights and Forecast - by Vehicle Type
- 5.1.1. Motorcycles
- 5.1.2. Cars
- 5.1.3. Vans
- 5.1.4. Buses
- 5.2. Market Analysis, Insights and Forecast - by Propulsion Type
- 5.2.1. Internal Combustion Engine (ICE)
- 5.2.2. Electric
- 5.3. Market Analysis, Insights and Forecast - by Region
- 5.3.1. North America
- 5.3.2. Europe
- 5.3.3. Asia Pacific
- 5.3.4. Rest of the World
- 5.1. Market Analysis, Insights and Forecast - by Vehicle Type
- 6. Global Ride Hailing Industry Analysis, Insights and Forecast, 2021-2033
- 6.1. Market Analysis, Insights and Forecast - by Vehicle Type
- 6.1.1. Motorcycles
- 6.1.2. Cars
- 6.1.3. Vans
- 6.1.4. Buses
- 6.2. Market Analysis, Insights and Forecast - by Propulsion Type
- 6.2.1. Internal Combustion Engine (ICE)
- 6.2.2. Electric
- 6.1. Market Analysis, Insights and Forecast - by Vehicle Type
- 7. North America Ride Hailing Industry Analysis, Insights and Forecast, 2020-2032
- 7.1. Market Analysis, Insights and Forecast - by Vehicle Type
- 7.1.1. Motorcycles
- 7.1.2. Cars
- 7.1.3. Vans
- 7.1.4. Buses
- 7.2. Market Analysis, Insights and Forecast - by Propulsion Type
- 7.2.1. Internal Combustion Engine (ICE)
- 7.2.2. Electric
- 7.1. Market Analysis, Insights and Forecast - by Vehicle Type
- 8. Europe Ride Hailing Industry Analysis, Insights and Forecast, 2020-2032
- 8.1. Market Analysis, Insights and Forecast - by Vehicle Type
- 8.1.1. Motorcycles
- 8.1.2. Cars
- 8.1.3. Vans
- 8.1.4. Buses
- 8.2. Market Analysis, Insights and Forecast - by Propulsion Type
- 8.2.1. Internal Combustion Engine (ICE)
- 8.2.2. Electric
- 8.1. Market Analysis, Insights and Forecast - by Vehicle Type
- 9. Asia Pacific Ride Hailing Industry Analysis, Insights and Forecast, 2020-2032
- 9.1. Market Analysis, Insights and Forecast - by Vehicle Type
- 9.1.1. Motorcycles
- 9.1.2. Cars
- 9.1.3. Vans
- 9.1.4. Buses
- 9.2. Market Analysis, Insights and Forecast - by Propulsion Type
- 9.2.1. Internal Combustion Engine (ICE)
- 9.2.2. Electric
- 9.1. Market Analysis, Insights and Forecast - by Vehicle Type
- 10. Rest of the World Ride Hailing Industry Analysis, Insights and Forecast, 2020-2032
- 10.1. Market Analysis, Insights and Forecast - by Vehicle Type
- 10.1.1. Motorcycles
- 10.1.2. Cars
- 10.1.3. Vans
- 10.1.4. Buses
- 10.2. Market Analysis, Insights and Forecast - by Propulsion Type
- 10.2.1. Internal Combustion Engine (ICE)
- 10.2.2. Electric
- 10.1. Market Analysis, Insights and Forecast - by Vehicle Type
- 11. Competitive Analysis
- 11.1. Company Profiles
- 11.1.1 BlaBla Car
- 11.1.1.1. Company Overview
- 11.1.1.2. Products
- 11.1.1.3. Company Financials
- 11.1.1.4. SWOT Analysis
- 11.1.2 Uber Technologies Inc
- 11.1.2.1. Company Overview
- 11.1.2.2. Products
- 11.1.2.3. Company Financials
- 11.1.2.4. SWOT Analysis
- 11.1.3 Didi Chuxing Technology Co
- 11.1.3.1. Company Overview
- 11.1.3.2. Products
- 11.1.3.3. Company Financials
- 11.1.3.4. SWOT Analysis
- 11.1.4 SUOL INNOVATIONS LTD (inDrive
- 11.1.4.1. Company Overview
- 11.1.4.2. Products
- 11.1.4.3. Company Financials
- 11.1.4.4. SWOT Analysis
- 11.1.5 Lyft Inc
- 11.1.5.1. Company Overview
- 11.1.5.2. Products
- 11.1.5.3. Company Financials
- 11.1.5.4. SWOT Analysis
- 11.1.6 Ani Technologies Pvt Ltd (OLA)
- 11.1.6.1. Company Overview
- 11.1.6.2. Products
- 11.1.6.3. Company Financials
- 11.1.6.4. SWOT Analysis
- 11.1.7 Gett Group
- 11.1.7.1. Company Overview
- 11.1.7.2. Products
- 11.1.7.3. Company Financials
- 11.1.7.4. SWOT Analysis
- 11.1.8 Bolt Technology OU
- 11.1.8.1. Company Overview
- 11.1.8.2. Products
- 11.1.8.3. Company Financials
- 11.1.8.4. SWOT Analysis
- 11.1.9 Maxi Mobility SL (Cabify)
- 11.1.9.1. Company Overview
- 11.1.9.2. Products
- 11.1.9.3. Company Financials
- 11.1.9.4. SWOT Analysis
- 11.1.10 GoTo Group (GoJek)
- 11.1.10.1. Company Overview
- 11.1.10.2. Products
- 11.1.10.3. Company Financials
- 11.1.10.4. SWOT Analysis
- 11.1.11 Xanh SM (GSM)
- 11.1.11.1. Company Overview
- 11.1.11.2. Products
- 11.1.11.3. Company Financials
- 11.1.11.4. SWOT Analysis
- 11.1.12 Grab Holdings Inc
- 11.1.12.1. Company Overview
- 11.1.12.2. Products
- 11.1.12.3. Company Financials
- 11.1.12.4. SWOT Analysis
- 11.1.1 BlaBla Car
- 11.2. Market Entropy
- 11.2.1 Company's Key Areas Served
- 11.2.2 Recent Developments
- 11.3. Company Market Share Analysis 2025
- 11.3.1 Top 5 Companies Market Share Analysis
- 11.3.2 Top 3 Companies Market Share Analysis
- 11.4. List of Potential Customers
- 12. Research Methodology
List of Figures
- Figure 1: Global Ride Hailing Industry Revenue Breakdown (Million, %) by Region 2025 & 2033
- Figure 2: North America Ride Hailing Industry Revenue (Million), by Vehicle Type 2025 & 2033
- Figure 3: North America Ride Hailing Industry Revenue Share (%), by Vehicle Type 2025 & 2033
- Figure 4: North America Ride Hailing Industry Revenue (Million), by Propulsion Type 2025 & 2033
- Figure 5: North America Ride Hailing Industry Revenue Share (%), by Propulsion Type 2025 & 2033
- Figure 6: North America Ride Hailing Industry Revenue (Million), by Country 2025 & 2033
- Figure 7: North America Ride Hailing Industry Revenue Share (%), by Country 2025 & 2033
- Figure 8: Europe Ride Hailing Industry Revenue (Million), by Vehicle Type 2025 & 2033
- Figure 9: Europe Ride Hailing Industry Revenue Share (%), by Vehicle Type 2025 & 2033
- Figure 10: Europe Ride Hailing Industry Revenue (Million), by Propulsion Type 2025 & 2033
- Figure 11: Europe Ride Hailing Industry Revenue Share (%), by Propulsion Type 2025 & 2033
- Figure 12: Europe Ride Hailing Industry Revenue (Million), by Country 2025 & 2033
- Figure 13: Europe Ride Hailing Industry Revenue Share (%), by Country 2025 & 2033
- Figure 14: Asia Pacific Ride Hailing Industry Revenue (Million), by Vehicle Type 2025 & 2033
- Figure 15: Asia Pacific Ride Hailing Industry Revenue Share (%), by Vehicle Type 2025 & 2033
- Figure 16: Asia Pacific Ride Hailing Industry Revenue (Million), by Propulsion Type 2025 & 2033
- Figure 17: Asia Pacific Ride Hailing Industry Revenue Share (%), by Propulsion Type 2025 & 2033
- Figure 18: Asia Pacific Ride Hailing Industry Revenue (Million), by Country 2025 & 2033
- Figure 19: Asia Pacific Ride Hailing Industry Revenue Share (%), by Country 2025 & 2033
- Figure 20: Rest of the World Ride Hailing Industry Revenue (Million), by Vehicle Type 2025 & 2033
- Figure 21: Rest of the World Ride Hailing Industry Revenue Share (%), by Vehicle Type 2025 & 2033
- Figure 22: Rest of the World Ride Hailing Industry Revenue (Million), by Propulsion Type 2025 & 2033
- Figure 23: Rest of the World Ride Hailing Industry Revenue Share (%), by Propulsion Type 2025 & 2033
- Figure 24: Rest of the World Ride Hailing Industry Revenue (Million), by Country 2025 & 2033
- Figure 25: Rest of the World Ride Hailing Industry Revenue Share (%), by Country 2025 & 2033
List of Tables
- Table 1: Global Ride Hailing Industry Revenue Million Forecast, by Vehicle Type 2020 & 2033
- Table 2: Global Ride Hailing Industry Revenue Million Forecast, by Propulsion Type 2020 & 2033
- Table 3: Global Ride Hailing Industry Revenue Million Forecast, by Region 2020 & 2033
- Table 4: Global Ride Hailing Industry Revenue Million Forecast, by Vehicle Type 2020 & 2033
- Table 5: Global Ride Hailing Industry Revenue Million Forecast, by Propulsion Type 2020 & 2033
- Table 6: Global Ride Hailing Industry Revenue Million Forecast, by Country 2020 & 2033
- Table 7: United States Ride Hailing Industry Revenue (Million) Forecast, by Application 2020 & 2033
- Table 8: Canada Ride Hailing Industry Revenue (Million) Forecast, by Application 2020 & 2033
- Table 9: Rest of North America Ride Hailing Industry Revenue (Million) Forecast, by Application 2020 & 2033
- Table 10: Global Ride Hailing Industry Revenue Million Forecast, by Vehicle Type 2020 & 2033
- Table 11: Global Ride Hailing Industry Revenue Million Forecast, by Propulsion Type 2020 & 2033
- Table 12: Global Ride Hailing Industry Revenue Million Forecast, by Country 2020 & 2033
- Table 13: Germany Ride Hailing Industry Revenue (Million) Forecast, by Application 2020 & 2033
- Table 14: United Kingdom Ride Hailing Industry Revenue (Million) Forecast, by Application 2020 & 2033
- Table 15: France Ride Hailing Industry Revenue (Million) Forecast, by Application 2020 & 2033
- Table 16: Italy Ride Hailing Industry Revenue (Million) Forecast, by Application 2020 & 2033
- Table 17: Rest of Europe Ride Hailing Industry Revenue (Million) Forecast, by Application 2020 & 2033
- Table 18: Global Ride Hailing Industry Revenue Million Forecast, by Vehicle Type 2020 & 2033
- Table 19: Global Ride Hailing Industry Revenue Million Forecast, by Propulsion Type 2020 & 2033
- Table 20: Global Ride Hailing Industry Revenue Million Forecast, by Country 2020 & 2033
- Table 21: China Ride Hailing Industry Revenue (Million) Forecast, by Application 2020 & 2033
- Table 22: India Ride Hailing Industry Revenue (Million) Forecast, by Application 2020 & 2033
- Table 23: Japan Ride Hailing Industry Revenue (Million) Forecast, by Application 2020 & 2033
- Table 24: South Korea Ride Hailing Industry Revenue (Million) Forecast, by Application 2020 & 2033
- Table 25: Rest of Asia Pacific Ride Hailing Industry Revenue (Million) Forecast, by Application 2020 & 2033
- Table 26: Global Ride Hailing Industry Revenue Million Forecast, by Vehicle Type 2020 & 2033
- Table 27: Global Ride Hailing Industry Revenue Million Forecast, by Propulsion Type 2020 & 2033
- Table 28: Global Ride Hailing Industry Revenue Million Forecast, by Country 2020 & 2033
- Table 29: South America Ride Hailing Industry Revenue (Million) Forecast, by Application 2020 & 2033
- Table 30: Middle East and Africa Ride Hailing Industry Revenue (Million) Forecast, by Application 2020 & 2033
Frequently Asked Questions
1. What is the projected Compound Annual Growth Rate (CAGR) of the Ride Hailing Industry?
The projected CAGR is approximately 9.64%.
2. Which companies are prominent players in the Ride Hailing Industry?
Key companies in the market include BlaBla Car, Uber Technologies Inc, Didi Chuxing Technology Co, SUOL INNOVATIONS LTD (inDrive, Lyft Inc, Ani Technologies Pvt Ltd (OLA), Gett Group, Bolt Technology OU, Maxi Mobility SL (Cabify), GoTo Group (GoJek), Xanh SM (GSM), Grab Holdings Inc.
3. What are the main segments of the Ride Hailing Industry?
The market segments include Vehicle Type, Propulsion Type.
4. Can you provide details about the market size?
The market size is estimated to be USD 185.64 Million as of 2022.
5. What are some drivers contributing to market growth?
Rising Traffic Congestion and Increasing Urban Population to Foster Market Growth.
6. What are the notable trends driving market growth?
The Cars Segment is Expected to Gain Traction During the Forecast Period.
7. Are there any restraints impacting market growth?
Strict Government Regulations and Policies Toward Ride-hailing Services Impact the Market Growth.
8. Can you provide examples of recent developments in the market?
April 2024: The Japanese government implemented the use of private ride-hailing services, which are accessible through mobile applications such as Uber and Go.
9. What pricing options are available for accessing the report?
Pricing options include single-user, multi-user, and enterprise licenses priced at USD 4750, USD 5250, and USD 8750 respectively.
10. Is the market size provided in terms of value or volume?
The market size is provided in terms of value, measured in Million.
11. Are there any specific market keywords associated with the report?
Yes, the market keyword associated with the report is "Ride Hailing Industry," which aids in identifying and referencing the specific market segment covered.
12. How do I determine which pricing option suits my needs best?
The pricing options vary based on user requirements and access needs. Individual users may opt for single-user licenses, while businesses requiring broader access may choose multi-user or enterprise licenses for cost-effective access to the report.
13. Are there any additional resources or data provided in the Ride Hailing Industry report?
While the report offers comprehensive insights, it's advisable to review the specific contents or supplementary materials provided to ascertain if additional resources or data are available.
14. How can I stay updated on further developments or reports in the Ride Hailing Industry?
To stay informed about further developments, trends, and reports in the Ride Hailing Industry, consider subscribing to industry newsletters, following relevant companies and organizations, or regularly checking reputable industry news sources and publications.
Methodology
Step 1 - Identification of Relevant Samples Size from Population Database


Step 2 - Approaches for Defining Global Market Size (Value, Volume* & Price*)

Note*: In applicable scenarios
Step 3 - Data Sources
Primary Research
- Web Analytics
- Survey Reports
- Research Institute
- Latest Research Reports
- Opinion Leaders
Secondary Research
- Annual Reports
- White Paper
- Latest Press Release
- Industry Association
- Paid Database
- Investor Presentations

Step 4 - Data Triangulation
Involves using different sources of information in order to increase the validity of a study
These sources are likely to be stakeholders in a program - participants, other researchers, program staff, other community members, and so on.
Then we put all data in single framework & apply various statistical tools to find out the dynamic on the market.
During the analysis stage, feedback from the stakeholder groups would be compared to determine areas of agreement as well as areas of divergence