

Key Insights
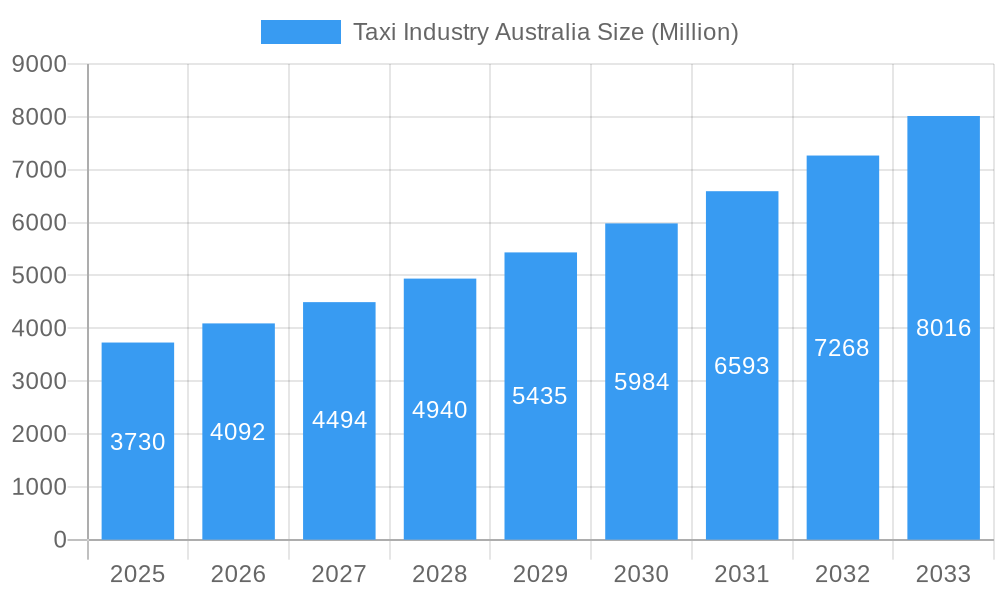
The Australian taxi industry, valued at $3.73 billion in 2025, is experiencing robust growth, projected to expand at a compound annual growth rate (CAGR) of 9.60% from 2025 to 2033. This expansion is driven by several key factors. Increased urbanization and a growing population in major cities like Sydney, Melbourne, and Brisbane fuel demand for convenient and reliable transportation. Furthermore, the rising adoption of ride-hailing apps and online booking systems is streamlining the process, attracting a wider customer base and boosting overall market penetration. Technological advancements, such as improved GPS navigation and real-time fare calculations, contribute to enhanced efficiency and customer satisfaction. While the industry faces challenges, such as regulatory hurdles and competition from other transportation modes, the overall positive growth trajectory suggests a promising future for the sector. The diverse service offerings, encompassing ride-hailing, ridesharing, and varying vehicle types (hatchbacks, sedans, SUVs/MPVs), cater to a broad spectrum of consumer needs, ensuring a stable and expansive market.
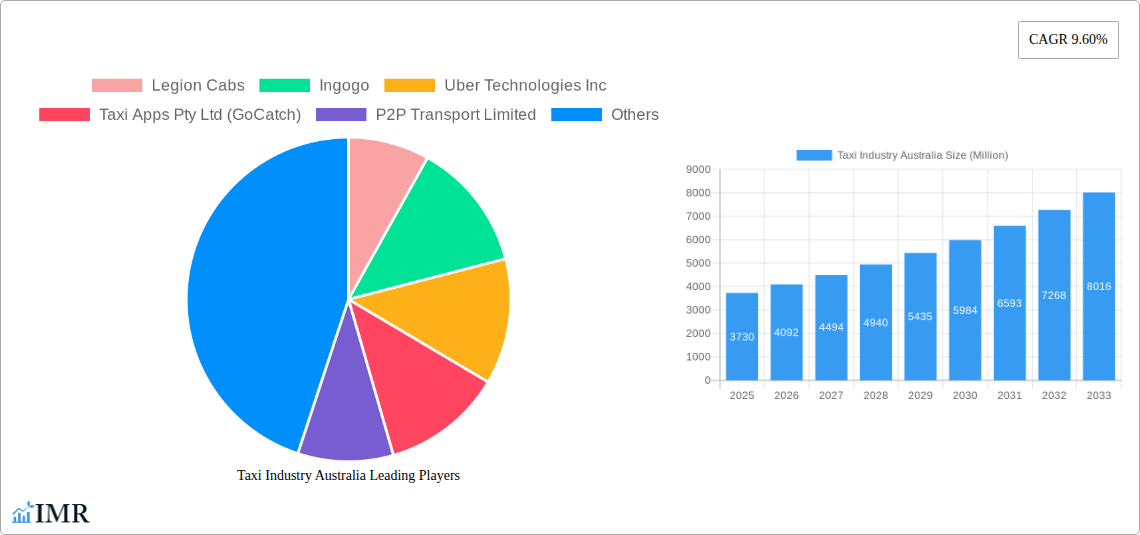
Taxi Industry Australia Market Size (In Billion)
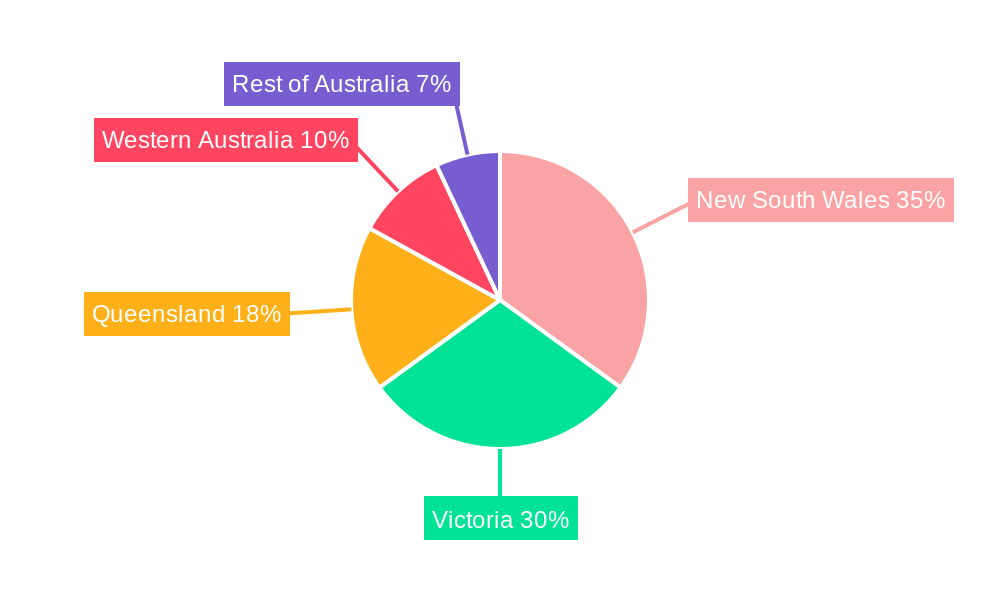
Segmentation within the Australian taxi market reveals a significant reliance on online booking platforms, indicating a strong digital transformation trend. The geographic distribution demonstrates concentrated growth in major states such as New South Wales, Victoria, and Queensland, highlighting these regions as key strategic areas for investment and expansion within the taxi industry. Competition from established players like Uber and local firms like Legion Cabs and GoCatch necessitates continuous innovation and strategic adaptation to maintain market share and profitability. Future growth will likely depend on the integration of advanced technologies, improved driver training and safety standards, and a proactive approach to addressing regulatory challenges. The industry’s ability to adapt to evolving consumer preferences and technological advancements will be critical in sustaining its projected growth trajectory over the next decade.
Taxi Industry Australia Company Market Share
Taxi Industry Australia: Market Report 2019-2033
This comprehensive report provides an in-depth analysis of the Australian taxi industry, covering market dynamics, growth trends, competitive landscape, and future outlook. The study period spans 2019-2033, with a base year of 2025 and a forecast period of 2025-2033. The report is essential for industry professionals, investors, and anyone seeking to understand the evolution and future of transportation in Australia. The report leverages extensive data and analysis to provide invaluable insights into this dynamic sector. The total market size is projected to reach xx Million in 2033.
Taxi Industry Australia Market Dynamics & Structure
The Australian taxi industry is characterized by a complex interplay of established players and disruptive newcomers, shaping a dynamic market structure. Market concentration is moderate, with a few dominant players like Uber Technologies Inc. and GM Cabs alongside numerous smaller operators. Technological innovation, particularly in ride-hailing apps and electric vehicle integration, is a key driver. Regulatory frameworks, varying across states, significantly impact operational costs and competition. Ride-sharing services present a strong competitive substitute, influencing pricing strategies and service offerings. End-user demographics are broad, encompassing diverse age groups, income levels, and transportation needs.
- Market Concentration: Moderate, with Uber and GM Cabs holding significant but not dominant shares.
- Technological Innovation: Rapid adoption of ride-hailing apps and increasing interest in electric vehicles.
- Regulatory Frameworks: Varying state-level regulations create operational complexities and inconsistencies.
- Competitive Substitutes: Ridesharing services pose a significant challenge to traditional taxi businesses.
- M&A Trends: Consolidation is expected, driven by the need for scale and technological capabilities. xx M&A deals were recorded between 2019 and 2024.
- End-User Demographics: Diverse, with significant demand from commuters, tourists, and businesses.
Taxi Industry Australia Growth Trends & Insights
The Australian taxi industry experienced significant transformation during the historical period (2019-2024), primarily driven by the rise of ride-hailing services. The market size, valued at xx Million in 2019, is projected to reach xx Million in 2025 and xx Million by 2033. This growth is underpinned by increasing smartphone penetration, changing consumer preferences, and expanding urban populations. Technological disruptions, including the integration of electric and autonomous vehicles, are reshaping the industry landscape. Consumer behavior shifts towards on-demand mobility and increased price sensitivity are further shaping market dynamics. The Compound Annual Growth Rate (CAGR) from 2025-2033 is estimated at xx%. Market penetration of online booking is projected to reach xx% by 2033.
Dominant Regions, Countries, or Segments in Taxi Industry Australia
New South Wales (NSW) and Victoria dominate the Australian taxi market due to higher population density, extensive urban infrastructure, and robust tourism sectors. Online booking holds a significant market share, reflecting the growing preference for convenient digital platforms. Ride-hailing is the most rapidly growing service type, driven by demand for efficient and affordable transportation. Sedans are the most prevalent vehicle type, though SUVs/MPVs are gaining popularity for larger groups or families.
- NSW & Victoria Dominance: Higher population density and strong tourism sectors.
- Online Booking Growth: Convenience and ease of use drive adoption.
- Ride-Hailing's Rapid Expansion: Demand for efficient and affordable transport.
- Sedan Prevalence: Most common vehicle type in the market.
- SUV/MPV Growth: Growing popularity for larger groups.
Taxi Industry Australia Product Landscape
Product innovation focuses on enhancing user experience through advanced technology integration. Ride-hailing apps offer real-time tracking, fare estimation, and cashless payment options. Electric vehicles are increasingly being integrated into taxi fleets to reduce environmental impact and operational costs. Unique selling propositions include premium service packages, loyalty programs, and corporate accounts. Technological advancements include improved navigation systems, passenger safety features, and data-driven route optimization.
Key Drivers, Barriers & Challenges in Taxi Industry Australia
Key Drivers:
- Increasing urbanization and population growth.
- Rising smartphone penetration and digital adoption.
- Growing demand for on-demand transportation services.
- Government initiatives promoting sustainable transportation options.
Key Challenges:
- Intense competition from ride-sharing services.
- Regulatory uncertainty and evolving licensing requirements.
- Fluctuating fuel prices and increasing operational costs.
- Driver shortages and recruitment challenges.
- Cybersecurity risks associated with digital platforms.
Emerging Opportunities in Taxi Industry Australia
- Expansion into regional areas with limited transportation options.
- Development of specialized services like airport transfers or medical transport.
- Integration of autonomous vehicles for improved efficiency and safety.
- Development of subscription-based models for regular commuters.
- Increased focus on sustainable transportation solutions with electric or hybrid vehicles.
Growth Accelerators in the Taxi Industry Australia Industry
Technological advancements, including autonomous driving and electric vehicle integration, are key growth accelerators. Strategic partnerships between taxi companies and technology providers can enhance operational efficiency and expand service offerings. Market expansion into underserved regions and the development of niche service offerings will further stimulate growth. Government policies supporting sustainable transportation will also play a significant role.
Key Players Shaping the Taxi Industry Australia Market
- Legion Cabs
- Ingogo
- Uber Technologies Inc
- Taxi Apps Pty Ltd (GoCatch)
- P2P Transport Limited
- GM Cabs
- Rydo Taxi
- Bolt Technology OÜ
- A2B Australia Limited
- ANI Technologies Pvt Ltd (Ola)
- (Didi Chuxing) Beijing Xiaoju Technology Co Ltd
Notable Milestones in Taxi Industry Australia Sector
- October 2022: Ingenico and Live Payments announce a strategic partnership to improve taxi payment solutions.
- October 2022: Uber announces the addition of 500 Polestar 2 electric vehicles to its Sydney rideshare fleet.
- April 2023: GM Cabs launches Taxi-Share 2023, a hybrid taxi and rideshare service.
In-Depth Taxi Industry Australia Market Outlook
The Australian taxi industry is poised for continued growth, driven by technological innovation, evolving consumer preferences, and strategic partnerships. The market presents significant opportunities for companies that can adapt to changing dynamics and capitalize on emerging trends. The focus on sustainable transportation and the integration of autonomous vehicles will reshape the industry in the coming years, presenting new challenges and growth prospects for market players. Further consolidation and strategic alliances can be expected to shape the competitive landscape.
Taxi Industry Australia Segmentation
-
1. Service Type
- 1.1. Ride Hailing
- 1.2. Ridesharing
-
2. Booking Type
- 2.1. Online Booking
- 2.2. Offline Booking
-
3. Vehicle Type
- 3.1. Hatchbacks
- 3.2. Sedans
- 3.3. SUVs/MPVs
Taxi Industry Australia Segmentation By Geography
-
1. North America
- 1.1. United States
- 1.2. Canada
- 1.3. Mexico
-
2. South America
- 2.1. Brazil
- 2.2. Argentina
- 2.3. Rest of South America
-
3. Europe
- 3.1. United Kingdom
- 3.2. Germany
- 3.3. France
- 3.4. Italy
- 3.5. Spain
- 3.6. Russia
- 3.7. Benelux
- 3.8. Nordics
- 3.9. Rest of Europe
-
4. Middle East & Africa
- 4.1. Turkey
- 4.2. Israel
- 4.3. GCC
- 4.4. North Africa
- 4.5. South Africa
- 4.6. Rest of Middle East & Africa
-
5. Asia Pacific
- 5.1. China
- 5.2. India
- 5.3. Japan
- 5.4. South Korea
- 5.5. ASEAN
- 5.6. Oceania
- 5.7. Rest of Asia Pacific
Taxi Industry Australia Regional Market Share
Geographic Coverage of Taxi Industry Australia
Taxi Industry Australia REPORT HIGHLIGHTS
| Aspects | Details |
|---|---|
| Study Period | 2020-2034 |
| Base Year | 2025 |
| Estimated Year | 2026 |
| Forecast Period | 2026-2034 |
| Historical Period | 2020-2025 |
| Growth Rate | CAGR of 9.60% from 2020-2034 |
| Segmentation |
|
Table of Contents
- 1. Introduction
- 1.1. Research Scope
- 1.2. Market Segmentation
- 1.3. Research Objective
- 1.4. Definitions and Assumptions
- 2. Executive Summary
- 2.1. Market Snapshot
- 3. Market Dynamics
- 3.1. Market Drivers
- 3.2. Market Restrains
- 3.3. Market Trends
- 3.4. Market Opportunities
- 4. Market Factor Analysis
- 4.1. Porters Five Forces
- 4.1.1. Bargaining Power of Suppliers
- 4.1.2. Bargaining Power of Buyers
- 4.1.3. Threat of New Entrants
- 4.1.4. Threat of Substitutes
- 4.1.5. Competitive Rivalry
- 4.2. PESTEL analysis
- 4.3. BCG Analysis
- 4.3.1. Stars (High Growth, High Market Share)
- 4.3.2. Cash Cows (Low Growth, High Market Share)
- 4.3.3. Question Mark (High Growth, Low Market Share)
- 4.3.4. Dogs (Low Growth, Low Market Share)
- 4.4. Ansoff Matrix Analysis
- 4.5. Supply Chain Analysis
- 4.6. Regulatory Landscape
- 4.7. Current Market Potential and Opportunity Assessment (TAM–SAM–SOM Framework)
- 4.8. IMR Analyst Note
- 4.1. Porters Five Forces
- 5. Market Analysis, Insights and Forecast 2021-2033
- 5.1. Market Analysis, Insights and Forecast - by Service Type
- 5.1.1. Ride Hailing
- 5.1.2. Ridesharing
- 5.2. Market Analysis, Insights and Forecast - by Booking Type
- 5.2.1. Online Booking
- 5.2.2. Offline Booking
- 5.3. Market Analysis, Insights and Forecast - by Vehicle Type
- 5.3.1. Hatchbacks
- 5.3.2. Sedans
- 5.3.3. SUVs/MPVs
- 5.4. Market Analysis, Insights and Forecast - by Region
- 5.4.1. North America
- 5.4.2. South America
- 5.4.3. Europe
- 5.4.4. Middle East & Africa
- 5.4.5. Asia Pacific
- 5.1. Market Analysis, Insights and Forecast - by Service Type
- 6. Global Taxi Industry Australia Analysis, Insights and Forecast, 2021-2033
- 6.1. Market Analysis, Insights and Forecast - by Service Type
- 6.1.1. Ride Hailing
- 6.1.2. Ridesharing
- 6.2. Market Analysis, Insights and Forecast - by Booking Type
- 6.2.1. Online Booking
- 6.2.2. Offline Booking
- 6.3. Market Analysis, Insights and Forecast - by Vehicle Type
- 6.3.1. Hatchbacks
- 6.3.2. Sedans
- 6.3.3. SUVs/MPVs
- 6.1. Market Analysis, Insights and Forecast - by Service Type
- 7. North America Taxi Industry Australia Analysis, Insights and Forecast, 2020-2032
- 7.1. Market Analysis, Insights and Forecast - by Service Type
- 7.1.1. Ride Hailing
- 7.1.2. Ridesharing
- 7.2. Market Analysis, Insights and Forecast - by Booking Type
- 7.2.1. Online Booking
- 7.2.2. Offline Booking
- 7.3. Market Analysis, Insights and Forecast - by Vehicle Type
- 7.3.1. Hatchbacks
- 7.3.2. Sedans
- 7.3.3. SUVs/MPVs
- 7.1. Market Analysis, Insights and Forecast - by Service Type
- 8. South America Taxi Industry Australia Analysis, Insights and Forecast, 2020-2032
- 8.1. Market Analysis, Insights and Forecast - by Service Type
- 8.1.1. Ride Hailing
- 8.1.2. Ridesharing
- 8.2. Market Analysis, Insights and Forecast - by Booking Type
- 8.2.1. Online Booking
- 8.2.2. Offline Booking
- 8.3. Market Analysis, Insights and Forecast - by Vehicle Type
- 8.3.1. Hatchbacks
- 8.3.2. Sedans
- 8.3.3. SUVs/MPVs
- 8.1. Market Analysis, Insights and Forecast - by Service Type
- 9. Europe Taxi Industry Australia Analysis, Insights and Forecast, 2020-2032
- 9.1. Market Analysis, Insights and Forecast - by Service Type
- 9.1.1. Ride Hailing
- 9.1.2. Ridesharing
- 9.2. Market Analysis, Insights and Forecast - by Booking Type
- 9.2.1. Online Booking
- 9.2.2. Offline Booking
- 9.3. Market Analysis, Insights and Forecast - by Vehicle Type
- 9.3.1. Hatchbacks
- 9.3.2. Sedans
- 9.3.3. SUVs/MPVs
- 9.1. Market Analysis, Insights and Forecast - by Service Type
- 10. Middle East & Africa Taxi Industry Australia Analysis, Insights and Forecast, 2020-2032
- 10.1. Market Analysis, Insights and Forecast - by Service Type
- 10.1.1. Ride Hailing
- 10.1.2. Ridesharing
- 10.2. Market Analysis, Insights and Forecast - by Booking Type
- 10.2.1. Online Booking
- 10.2.2. Offline Booking
- 10.3. Market Analysis, Insights and Forecast - by Vehicle Type
- 10.3.1. Hatchbacks
- 10.3.2. Sedans
- 10.3.3. SUVs/MPVs
- 10.1. Market Analysis, Insights and Forecast - by Service Type
- 11. Asia Pacific Taxi Industry Australia Analysis, Insights and Forecast, 2020-2032
- 11.1. Market Analysis, Insights and Forecast - by Service Type
- 11.1.1. Ride Hailing
- 11.1.2. Ridesharing
- 11.2. Market Analysis, Insights and Forecast - by Booking Type
- 11.2.1. Online Booking
- 11.2.2. Offline Booking
- 11.3. Market Analysis, Insights and Forecast - by Vehicle Type
- 11.3.1. Hatchbacks
- 11.3.2. Sedans
- 11.3.3. SUVs/MPVs
- 11.1. Market Analysis, Insights and Forecast - by Service Type
- 12. Competitive Analysis
- 12.1. Company Profiles
- 12.1.1 Legion Cabs
- 12.1.1.1. Company Overview
- 12.1.1.2. Products
- 12.1.1.3. Company Financials
- 12.1.1.4. SWOT Analysis
- 12.1.2 Ingogo
- 12.1.2.1. Company Overview
- 12.1.2.2. Products
- 12.1.2.3. Company Financials
- 12.1.2.4. SWOT Analysis
- 12.1.3 Uber Technologies Inc
- 12.1.3.1. Company Overview
- 12.1.3.2. Products
- 12.1.3.3. Company Financials
- 12.1.3.4. SWOT Analysis
- 12.1.4 Taxi Apps Pty Ltd (GoCatch)
- 12.1.4.1. Company Overview
- 12.1.4.2. Products
- 12.1.4.3. Company Financials
- 12.1.4.4. SWOT Analysis
- 12.1.5 P2P Transport Limited
- 12.1.5.1. Company Overview
- 12.1.5.2. Products
- 12.1.5.3. Company Financials
- 12.1.5.4. SWOT Analysis
- 12.1.6 GM Cabs
- 12.1.6.1. Company Overview
- 12.1.6.2. Products
- 12.1.6.3. Company Financials
- 12.1.6.4. SWOT Analysis
- 12.1.7 Rydo Taxi
- 12.1.7.1. Company Overview
- 12.1.7.2. Products
- 12.1.7.3. Company Financials
- 12.1.7.4. SWOT Analysis
- 12.1.8 Bolt Technology OÜ
- 12.1.8.1. Company Overview
- 12.1.8.2. Products
- 12.1.8.3. Company Financials
- 12.1.8.4. SWOT Analysis
- 12.1.9 A2B Australia Limited
- 12.1.9.1. Company Overview
- 12.1.9.2. Products
- 12.1.9.3. Company Financials
- 12.1.9.4. SWOT Analysis
- 12.1.10 ANI Technologies Pvt Ltd (Ola)
- 12.1.10.1. Company Overview
- 12.1.10.2. Products
- 12.1.10.3. Company Financials
- 12.1.10.4. SWOT Analysis
- 12.1.11 (Didi Chuxing) Beijing Xiaoju Technology Co Ltd *List Not Exhaustive
- 12.1.11.1. Company Overview
- 12.1.11.2. Products
- 12.1.11.3. Company Financials
- 12.1.11.4. SWOT Analysis
- 12.1.1 Legion Cabs
- 12.2. Market Entropy
- 12.2.1 Company's Key Areas Served
- 12.2.2 Recent Developments
- 12.3. Company Market Share Analysis 2025
- 12.3.1 Top 5 Companies Market Share Analysis
- 12.3.2 Top 3 Companies Market Share Analysis
- 12.4. List of Potential Customers
- 13. Research Methodology
List of Figures
- Figure 1: Global Taxi Industry Australia Revenue Breakdown (Million, %) by Region 2025 & 2033
- Figure 2: North America Taxi Industry Australia Revenue (Million), by Service Type 2025 & 2033
- Figure 3: North America Taxi Industry Australia Revenue Share (%), by Service Type 2025 & 2033
- Figure 4: North America Taxi Industry Australia Revenue (Million), by Booking Type 2025 & 2033
- Figure 5: North America Taxi Industry Australia Revenue Share (%), by Booking Type 2025 & 2033
- Figure 6: North America Taxi Industry Australia Revenue (Million), by Vehicle Type 2025 & 2033
- Figure 7: North America Taxi Industry Australia Revenue Share (%), by Vehicle Type 2025 & 2033
- Figure 8: North America Taxi Industry Australia Revenue (Million), by Country 2025 & 2033
- Figure 9: North America Taxi Industry Australia Revenue Share (%), by Country 2025 & 2033
- Figure 10: South America Taxi Industry Australia Revenue (Million), by Service Type 2025 & 2033
- Figure 11: South America Taxi Industry Australia Revenue Share (%), by Service Type 2025 & 2033
- Figure 12: South America Taxi Industry Australia Revenue (Million), by Booking Type 2025 & 2033
- Figure 13: South America Taxi Industry Australia Revenue Share (%), by Booking Type 2025 & 2033
- Figure 14: South America Taxi Industry Australia Revenue (Million), by Vehicle Type 2025 & 2033
- Figure 15: South America Taxi Industry Australia Revenue Share (%), by Vehicle Type 2025 & 2033
- Figure 16: South America Taxi Industry Australia Revenue (Million), by Country 2025 & 2033
- Figure 17: South America Taxi Industry Australia Revenue Share (%), by Country 2025 & 2033
- Figure 18: Europe Taxi Industry Australia Revenue (Million), by Service Type 2025 & 2033
- Figure 19: Europe Taxi Industry Australia Revenue Share (%), by Service Type 2025 & 2033
- Figure 20: Europe Taxi Industry Australia Revenue (Million), by Booking Type 2025 & 2033
- Figure 21: Europe Taxi Industry Australia Revenue Share (%), by Booking Type 2025 & 2033
- Figure 22: Europe Taxi Industry Australia Revenue (Million), by Vehicle Type 2025 & 2033
- Figure 23: Europe Taxi Industry Australia Revenue Share (%), by Vehicle Type 2025 & 2033
- Figure 24: Europe Taxi Industry Australia Revenue (Million), by Country 2025 & 2033
- Figure 25: Europe Taxi Industry Australia Revenue Share (%), by Country 2025 & 2033
- Figure 26: Middle East & Africa Taxi Industry Australia Revenue (Million), by Service Type 2025 & 2033
- Figure 27: Middle East & Africa Taxi Industry Australia Revenue Share (%), by Service Type 2025 & 2033
- Figure 28: Middle East & Africa Taxi Industry Australia Revenue (Million), by Booking Type 2025 & 2033
- Figure 29: Middle East & Africa Taxi Industry Australia Revenue Share (%), by Booking Type 2025 & 2033
- Figure 30: Middle East & Africa Taxi Industry Australia Revenue (Million), by Vehicle Type 2025 & 2033
- Figure 31: Middle East & Africa Taxi Industry Australia Revenue Share (%), by Vehicle Type 2025 & 2033
- Figure 32: Middle East & Africa Taxi Industry Australia Revenue (Million), by Country 2025 & 2033
- Figure 33: Middle East & Africa Taxi Industry Australia Revenue Share (%), by Country 2025 & 2033
- Figure 34: Asia Pacific Taxi Industry Australia Revenue (Million), by Service Type 2025 & 2033
- Figure 35: Asia Pacific Taxi Industry Australia Revenue Share (%), by Service Type 2025 & 2033
- Figure 36: Asia Pacific Taxi Industry Australia Revenue (Million), by Booking Type 2025 & 2033
- Figure 37: Asia Pacific Taxi Industry Australia Revenue Share (%), by Booking Type 2025 & 2033
- Figure 38: Asia Pacific Taxi Industry Australia Revenue (Million), by Vehicle Type 2025 & 2033
- Figure 39: Asia Pacific Taxi Industry Australia Revenue Share (%), by Vehicle Type 2025 & 2033
- Figure 40: Asia Pacific Taxi Industry Australia Revenue (Million), by Country 2025 & 2033
- Figure 41: Asia Pacific Taxi Industry Australia Revenue Share (%), by Country 2025 & 2033
List of Tables
- Table 1: Global Taxi Industry Australia Revenue Million Forecast, by Service Type 2020 & 2033
- Table 2: Global Taxi Industry Australia Revenue Million Forecast, by Booking Type 2020 & 2033
- Table 3: Global Taxi Industry Australia Revenue Million Forecast, by Vehicle Type 2020 & 2033
- Table 4: Global Taxi Industry Australia Revenue Million Forecast, by Region 2020 & 2033
- Table 5: Global Taxi Industry Australia Revenue Million Forecast, by Service Type 2020 & 2033
- Table 6: Global Taxi Industry Australia Revenue Million Forecast, by Booking Type 2020 & 2033
- Table 7: Global Taxi Industry Australia Revenue Million Forecast, by Vehicle Type 2020 & 2033
- Table 8: Global Taxi Industry Australia Revenue Million Forecast, by Country 2020 & 2033
- Table 9: United States Taxi Industry Australia Revenue (Million) Forecast, by Application 2020 & 2033
- Table 10: Canada Taxi Industry Australia Revenue (Million) Forecast, by Application 2020 & 2033
- Table 11: Mexico Taxi Industry Australia Revenue (Million) Forecast, by Application 2020 & 2033
- Table 12: Global Taxi Industry Australia Revenue Million Forecast, by Service Type 2020 & 2033
- Table 13: Global Taxi Industry Australia Revenue Million Forecast, by Booking Type 2020 & 2033
- Table 14: Global Taxi Industry Australia Revenue Million Forecast, by Vehicle Type 2020 & 2033
- Table 15: Global Taxi Industry Australia Revenue Million Forecast, by Country 2020 & 2033
- Table 16: Brazil Taxi Industry Australia Revenue (Million) Forecast, by Application 2020 & 2033
- Table 17: Argentina Taxi Industry Australia Revenue (Million) Forecast, by Application 2020 & 2033
- Table 18: Rest of South America Taxi Industry Australia Revenue (Million) Forecast, by Application 2020 & 2033
- Table 19: Global Taxi Industry Australia Revenue Million Forecast, by Service Type 2020 & 2033
- Table 20: Global Taxi Industry Australia Revenue Million Forecast, by Booking Type 2020 & 2033
- Table 21: Global Taxi Industry Australia Revenue Million Forecast, by Vehicle Type 2020 & 2033
- Table 22: Global Taxi Industry Australia Revenue Million Forecast, by Country 2020 & 2033
- Table 23: United Kingdom Taxi Industry Australia Revenue (Million) Forecast, by Application 2020 & 2033
- Table 24: Germany Taxi Industry Australia Revenue (Million) Forecast, by Application 2020 & 2033
- Table 25: France Taxi Industry Australia Revenue (Million) Forecast, by Application 2020 & 2033
- Table 26: Italy Taxi Industry Australia Revenue (Million) Forecast, by Application 2020 & 2033
- Table 27: Spain Taxi Industry Australia Revenue (Million) Forecast, by Application 2020 & 2033
- Table 28: Russia Taxi Industry Australia Revenue (Million) Forecast, by Application 2020 & 2033
- Table 29: Benelux Taxi Industry Australia Revenue (Million) Forecast, by Application 2020 & 2033
- Table 30: Nordics Taxi Industry Australia Revenue (Million) Forecast, by Application 2020 & 2033
- Table 31: Rest of Europe Taxi Industry Australia Revenue (Million) Forecast, by Application 2020 & 2033
- Table 32: Global Taxi Industry Australia Revenue Million Forecast, by Service Type 2020 & 2033
- Table 33: Global Taxi Industry Australia Revenue Million Forecast, by Booking Type 2020 & 2033
- Table 34: Global Taxi Industry Australia Revenue Million Forecast, by Vehicle Type 2020 & 2033
- Table 35: Global Taxi Industry Australia Revenue Million Forecast, by Country 2020 & 2033
- Table 36: Turkey Taxi Industry Australia Revenue (Million) Forecast, by Application 2020 & 2033
- Table 37: Israel Taxi Industry Australia Revenue (Million) Forecast, by Application 2020 & 2033
- Table 38: GCC Taxi Industry Australia Revenue (Million) Forecast, by Application 2020 & 2033
- Table 39: North Africa Taxi Industry Australia Revenue (Million) Forecast, by Application 2020 & 2033
- Table 40: South Africa Taxi Industry Australia Revenue (Million) Forecast, by Application 2020 & 2033
- Table 41: Rest of Middle East & Africa Taxi Industry Australia Revenue (Million) Forecast, by Application 2020 & 2033
- Table 42: Global Taxi Industry Australia Revenue Million Forecast, by Service Type 2020 & 2033
- Table 43: Global Taxi Industry Australia Revenue Million Forecast, by Booking Type 2020 & 2033
- Table 44: Global Taxi Industry Australia Revenue Million Forecast, by Vehicle Type 2020 & 2033
- Table 45: Global Taxi Industry Australia Revenue Million Forecast, by Country 2020 & 2033
- Table 46: China Taxi Industry Australia Revenue (Million) Forecast, by Application 2020 & 2033
- Table 47: India Taxi Industry Australia Revenue (Million) Forecast, by Application 2020 & 2033
- Table 48: Japan Taxi Industry Australia Revenue (Million) Forecast, by Application 2020 & 2033
- Table 49: South Korea Taxi Industry Australia Revenue (Million) Forecast, by Application 2020 & 2033
- Table 50: ASEAN Taxi Industry Australia Revenue (Million) Forecast, by Application 2020 & 2033
- Table 51: Oceania Taxi Industry Australia Revenue (Million) Forecast, by Application 2020 & 2033
- Table 52: Rest of Asia Pacific Taxi Industry Australia Revenue (Million) Forecast, by Application 2020 & 2033
Frequently Asked Questions
1. What is the projected Compound Annual Growth Rate (CAGR) of the Taxi Industry Australia?
The projected CAGR is approximately 9.60%.
2. Which companies are prominent players in the Taxi Industry Australia?
Key companies in the market include Legion Cabs, Ingogo, Uber Technologies Inc, Taxi Apps Pty Ltd (GoCatch), P2P Transport Limited, GM Cabs, Rydo Taxi, Bolt Technology OÜ, A2B Australia Limited, ANI Technologies Pvt Ltd (Ola), (Didi Chuxing) Beijing Xiaoju Technology Co Ltd *List Not Exhaustive.
3. What are the main segments of the Taxi Industry Australia?
The market segments include Service Type, Booking Type, Vehicle Type.
4. Can you provide details about the market size?
The market size is estimated to be USD 3.73 Million as of 2022.
5. What are some drivers contributing to market growth?
Growing Tourism Industry in Australia.
6. What are the notable trends driving market growth?
Online Booking Holds the Highest Share.
7. Are there any restraints impacting market growth?
Varying Government Regulations on Taxi Services.
8. Can you provide examples of recent developments in the market?
October 2022: Ingenico, the most trusted technological partner for payment acceptance, and Live Payments, one of Australia's leading payment service providers, announced their cooperation for long-term strategic partnerships to equip retailers and taxis with seamless and convenient payment and commerce solutions.
9. What pricing options are available for accessing the report?
Pricing options include single-user, multi-user, and enterprise licenses priced at USD 3800, USD 4500, and USD 5800 respectively.
10. Is the market size provided in terms of value or volume?
The market size is provided in terms of value, measured in Million.
11. Are there any specific market keywords associated with the report?
Yes, the market keyword associated with the report is "Taxi Industry Australia," which aids in identifying and referencing the specific market segment covered.
12. How do I determine which pricing option suits my needs best?
The pricing options vary based on user requirements and access needs. Individual users may opt for single-user licenses, while businesses requiring broader access may choose multi-user or enterprise licenses for cost-effective access to the report.
13. Are there any additional resources or data provided in the Taxi Industry Australia report?
While the report offers comprehensive insights, it's advisable to review the specific contents or supplementary materials provided to ascertain if additional resources or data are available.
14. How can I stay updated on further developments or reports in the Taxi Industry Australia?
To stay informed about further developments, trends, and reports in the Taxi Industry Australia, consider subscribing to industry newsletters, following relevant companies and organizations, or regularly checking reputable industry news sources and publications.
Methodology
Step 1 - Identification of Relevant Samples Size from Population Database


Step 2 - Approaches for Defining Global Market Size (Value, Volume* & Price*)

Note*: In applicable scenarios
Step 3 - Data Sources
Primary Research
- Web Analytics
- Survey Reports
- Research Institute
- Latest Research Reports
- Opinion Leaders
Secondary Research
- Annual Reports
- White Paper
- Latest Press Release
- Industry Association
- Paid Database
- Investor Presentations

Step 4 - Data Triangulation
Involves using different sources of information in order to increase the validity of a study
These sources are likely to be stakeholders in a program - participants, other researchers, program staff, other community members, and so on.
Then we put all data in single framework & apply various statistical tools to find out the dynamic on the market.
During the analysis stage, feedback from the stakeholder groups would be compared to determine areas of agreement as well as areas of divergence