

Key Insights
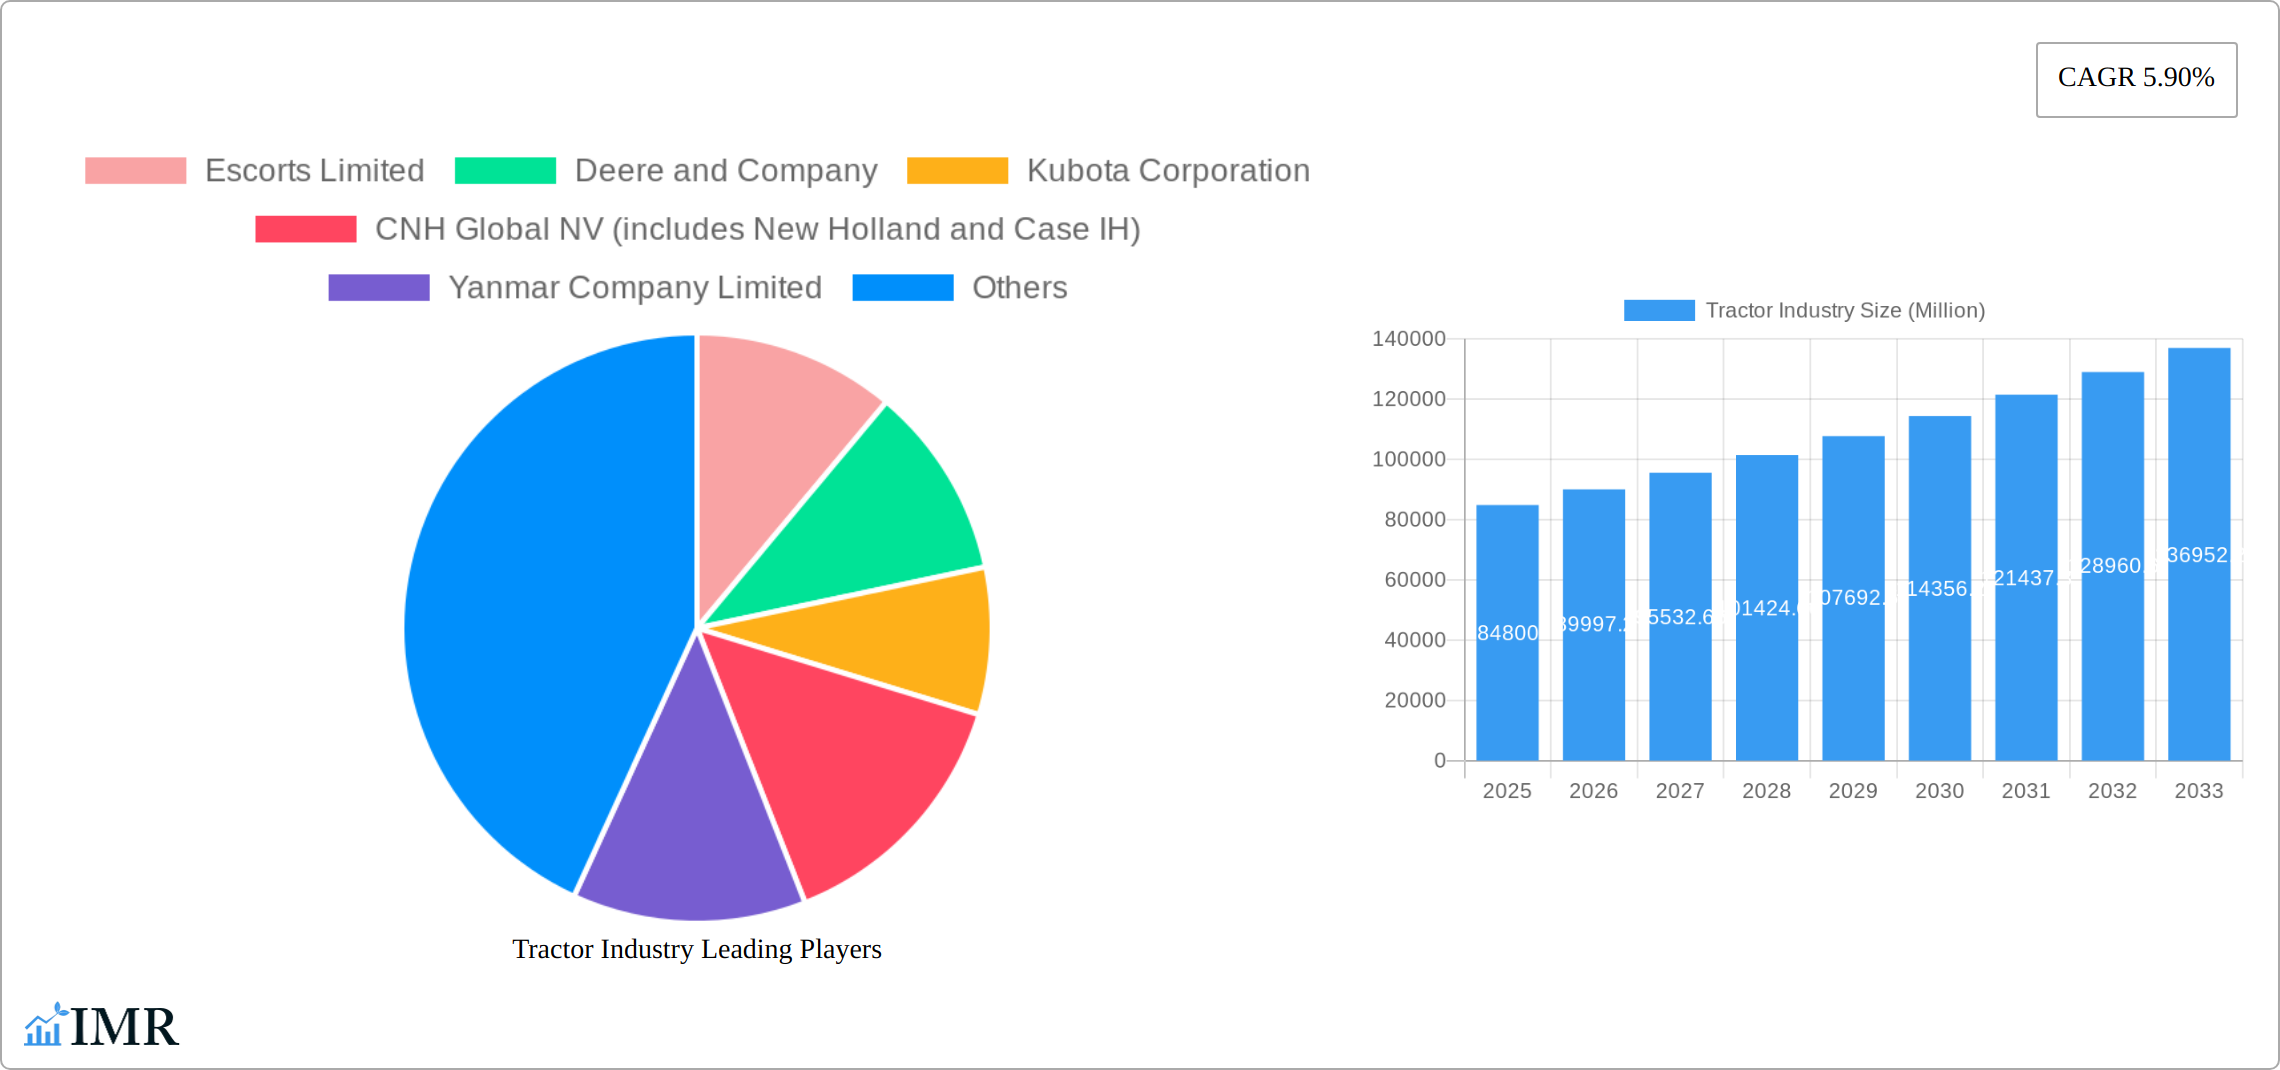
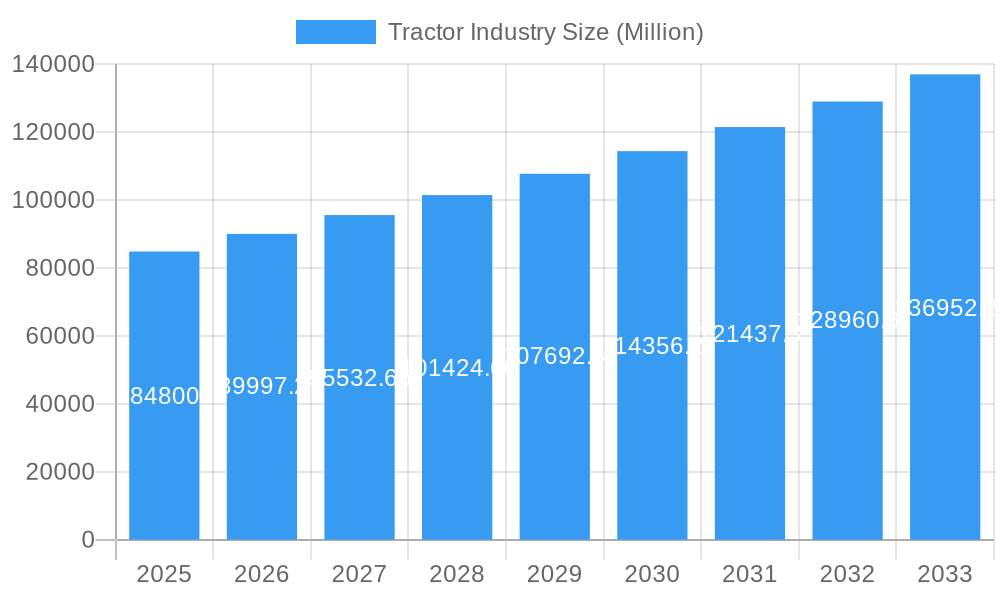
The global tractor market, valued at $84.80 billion in 2025, is projected to experience robust growth, driven by a Compound Annual Growth Rate (CAGR) of 5.90% from 2025 to 2033. This expansion is fueled by several key factors. Increasing agricultural mechanization in developing economies like India and China, coupled with rising demand for higher horsepower tractors to improve efficiency and productivity, are significant drivers. Furthermore, technological advancements such as precision farming technologies (GPS-guided tractors, automated steering, and data analytics integration) are boosting adoption rates and justifying higher investment in advanced machinery. Government initiatives promoting agricultural modernization and sustainable farming practices in various regions are also contributing to market growth. The market is segmented by horsepower (below 40 HP, 40-100 HP, above 100 HP) and drive type (two-wheel drive, four-wheel drive/all-wheel drive), reflecting diverse needs across different farming contexts and geographical areas. Major players like Deere & Company, Kubota, and Mahindra & Mahindra are shaping market dynamics through product innovation, strategic partnerships, and global expansion. However, the industry faces challenges including fluctuating raw material prices, economic uncertainties impacting farmer investments, and environmental concerns regarding emissions.
Tractor Industry Market Size (In Billion)
The regional distribution of the market shows significant potential in Asia-Pacific, particularly in India and China, due to large agricultural landholdings and a growing farmer population. North America and Europe continue to be substantial markets, driven by technological advancements and the adoption of high-horsepower tractors in large-scale farms. The competitive landscape is characterized by both established multinational corporations and regional players, leading to a dynamic mix of offerings and pricing strategies. The forecast period (2025-2033) anticipates a continued upward trend, with increasing penetration of advanced technologies and a sustained focus on improving agricultural efficiency and yield worldwide. The market is likely to witness increased consolidation through mergers and acquisitions as companies seek to expand their reach and product portfolios. Sustainable practices and stricter emission norms will also play an increasingly significant role in shaping product development and market strategies over the coming years.
Tractor Industry Company Market Share
Tractor Industry Market Report: 2019-2033
This comprehensive report provides a detailed analysis of the global tractor industry, encompassing market dynamics, growth trends, key players, and future outlook. The study period spans from 2019 to 2033, with 2025 serving as the base and estimated year. This report is invaluable for industry professionals, investors, and anyone seeking in-depth insights into this crucial sector. The report analyzes the parent market of agricultural machinery and the child market of tractors, offering a granular perspective.
Tractor Industry Market Dynamics & Structure
The global tractor market, valued at xx million units in 2024, exhibits a moderately consolidated structure, with several major players holding significant market share. Technological innovation, particularly in automation, electrification, and precision farming, is a key driver, while stringent emission regulations and fluctuating raw material prices present ongoing challenges. The market is segmented by horsepower (below 40 HP, 40-100 HP, above 100 HP) and drive type (two-wheel drive, four-wheel/all-wheel drive). Increased adoption of precision farming techniques and government incentives for mechanization are driving growth. Mergers and acquisitions (M&A) activity remains moderate, with strategic partnerships becoming increasingly prevalent for technology integration and market expansion.
- Market Concentration: Moderately consolidated, with top 10 players holding approximately xx% market share in 2024.
- Technological Innovation: Focus on automation, AI, electric tractors, and precision farming technologies.
- Regulatory Frameworks: Stringent emission norms and safety standards impacting manufacturing and sales.
- Competitive Substitutes: Alternative farming methods and equipment posing limited competition.
- End-User Demographics: Primarily farmers, agricultural businesses, and government entities.
- M&A Trends: Moderate activity with strategic partnerships gaining traction.
Tractor Industry Growth Trends & Insights
The global tractor market has experienced significant growth over the historical period (2019-2024), driven by factors such as rising agricultural output, increasing mechanization in developing economies, and government support for agricultural modernization. The market is expected to maintain a steady CAGR of xx% during the forecast period (2025-2033), reaching an estimated xx million units by 2033. Technological disruptions, including the introduction of autonomous tractors and electric models, are transforming the industry landscape, affecting adoption rates and consumer preferences. Shifting consumer behavior towards sustainable and efficient farming practices is also driving market growth.
(Note: This section requires XXX to be defined to provide a more detailed analysis with specific metrics and data.)
Dominant Regions, Countries, or Segments in Tractor Industry
The global tractor market is significantly shaped by strong regional variations. The Asia-Pacific region, particularly India and China, holds a dominant position, fueled by extensive agricultural land, a large and growing farming population, and government initiatives promoting agricultural mechanization. This dominance is further solidified by favorable economic conditions and substantial growth potential within these markets. Within this landscape, the 40 HP - 100 HP tractor segment exhibits the highest growth rate, catering to the needs of a wide range of farming operations. The increasing demand for four-wheel drive tractors reflects the need for superior traction and performance across diverse terrains and farming conditions. Beyond Asia-Pacific, North America and Europe also represent significant markets, though their growth trajectories may differ due to varying factors such as farm consolidation and technological adoption rates.
- Key Drivers in Asia-Pacific: Vast agricultural landholdings, increasing farm sizes, rising disposable incomes, government subsidies and incentives for mechanization, and a growing middle class demanding higher quality and quantity of food.
- Dominance Factors: High market share, substantial growth potential, favorable economic conditions, and a large pool of potential customers.
- Growth Potential: Expanding agricultural practices, rising disposable incomes, infrastructure development in developing nations, and increasing demand for higher efficiency and productivity in farming.
- Segment Analysis: The 40 HP - 100 HP segment demonstrates the highest growth potential due to its versatility and affordability, effectively serving a broad spectrum of farming needs. Simultaneously, four-wheel drive tractors are gaining significant traction due to their enhanced efficiency and superior performance in challenging conditions.
Tractor Industry Product Landscape
The tractor industry offers a diverse product range, catering to the varied needs of agricultural operations worldwide. This spectrum encompasses compact models ideal for small farms and larger, high-horsepower machines suited for large-scale farming and commercial applications. Technological advancements are rapidly transforming the industry, leading to the integration of sophisticated features such as GPS guidance, automated steering, precision planting capabilities, and telematics for remote monitoring and diagnostics. Key selling points frequently include enhanced fuel efficiency, improved safety features, and advanced connectivity for optimized performance and maintenance. Furthermore, the increasing adoption of electric and autonomous tractors is significantly shaping the future of the product landscape, promising enhanced sustainability and efficiency.
Key Drivers, Barriers & Challenges in Tractor Industry
Key Drivers:
- Growing global food demand and rising agricultural productivity needs.
- Increasing mechanization in developing countries.
- Technological advancements like precision agriculture and automation.
- Government subsidies and support for agricultural modernization.
Challenges:
- Fluctuations in raw material costs and supply chain disruptions (estimated xx% impact on production in 2024).
- Stringent emission regulations and compliance costs.
- Intense competition from established and emerging players.
- High initial investment costs for advanced technology tractors.
Emerging Opportunities in Tractor Industry
- Expansion into underserved markets in Africa and Latin America.
- Development of specialized tractors for specific crops and farming practices.
- Growing demand for electric and autonomous tractors to improve sustainability.
- Integration of IoT and data analytics for improved farm management.
Growth Accelerators in the Tractor Industry
Technological breakthroughs in precision farming, automation, and electrification are driving substantial growth. Strategic partnerships between tractor manufacturers and technology firms are accelerating innovation and market penetration. Expanding into new and emerging markets coupled with effective marketing and sales strategies are key growth drivers. Government policies promoting agricultural modernization in developing economies further fuel market expansion.
Key Players Shaping the Tractor Industry Market
- Escorts Limited
- Deere & Company
- Kubota Corporation
- CNH Industrial
- Yanmar Company Limited
- Kuhn Group (Subsidiary of Bucher Industries)
- Deutz-Fahr
- Mahindra & Mahindra Corporation
- CLAAS KGaA mbH
- Tractors and Farm Equipment Limited (TAFE)
- AGCO Corporation
Notable Milestones in Tractor Industry Sector
- July 2022: Ashok Leyland launched the AVTR 4220 and AVTR 4420 tractors, expanding its presence in the 4x2 segment.
- August 2022: Foxconn entered into a contract manufacturing agreement with Monarch Tractor to produce autonomous tractors, signaling a significant step towards automation in the sector.
- September 2022: KAMAZ PJSC announced its plans to expand its range of gas-powered vehicles, reflecting the industry's exploration of alternative fuel sources.
- May 2023: CNH Industrial committed a USD 50 million investment in the Indian farm machinery sector and launched a new 105HP tractor, demonstrating confidence in the market's growth potential.
- October 2023: International Tractors Limited (ITL) introduced three new Solis tractor series, including the electric SV Solis, highlighting the increasing focus on sustainable and electric technologies.
- March 2024: Hyster Company agreed to supply APM Terminals with 10 battery-powered terminal tractors, indicating a broader trend towards electrification in specialized tractor applications.
In-Depth Tractor Industry Market Outlook
The tractor industry is poised for sustained growth, driven by several key factors. Technological advancements, particularly in areas such as automation, precision farming, and alternative fuel sources, are revolutionizing the industry and enhancing efficiency. The increasing global demand for food, coupled with supportive government policies aimed at boosting agricultural productivity, creates a favorable environment for growth. Strategic partnerships, investments in research and development, and a focus on sustainable practices will be critical for manufacturers to maintain competitiveness in this evolving market. The adoption of more sustainable and technologically advanced tractors is expected to accelerate significantly, providing substantial opportunities for companies that prioritize efficiency, precision, and environmental responsibility. The market is ripe for both consolidation amongst existing players and the emergence of innovative new entrants, presenting compelling opportunities for growth and expansion.
Tractor Industry Segmentation
-
1. Horsepower
- 1.1. Below 40 HP
- 1.2. 40 HP - 100 HP
- 1.3. Above 100 HP
-
2. Drive Type
- 2.1. Two-wheel Drive
- 2.2. Four-wheel Drive/All-wheel Drive
Tractor Industry Segmentation By Geography
-
1. North America
- 1.1. United States
- 1.2. Canada
- 1.3. Rest of North America
-
2. Europe
- 2.1. Germany
- 2.2. United Kingdom
- 2.3. France
- 2.4. Spain
- 2.5. Italy
- 2.6. Rest of Europe
-
3. Asia Pacific
- 3.1. China
- 3.2. Japan
- 3.3. India
- 3.4. South Korea
- 3.5. Rest of Asia Pacific
-
4. Rest of the World
- 4.1. South America
- 4.2. Middle East and Africa
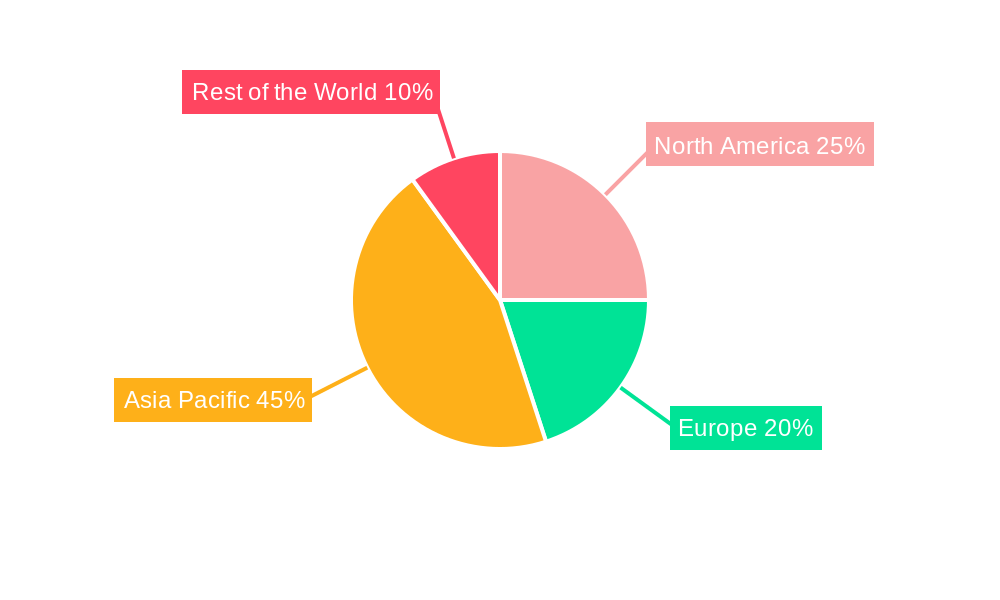
Tractor Industry Regional Market Share
Geographic Coverage of Tractor Industry
Tractor Industry REPORT HIGHLIGHTS
| Aspects | Details |
|---|---|
| Study Period | 2020-2034 |
| Base Year | 2025 |
| Estimated Year | 2026 |
| Forecast Period | 2026-2034 |
| Historical Period | 2020-2025 |
| Growth Rate | CAGR of 5.90% from 2020-2034 |
| Segmentation |
|
Table of Contents
- 1. Introduction
- 1.1. Research Scope
- 1.2. Market Segmentation
- 1.3. Research Objective
- 1.4. Definitions and Assumptions
- 2. Executive Summary
- 2.1. Market Snapshot
- 3. Market Dynamics
- 3.1. Market Drivers
- 3.2. Market Restrains
- 3.3. Market Trends
- 3.4. Market Opportunities
- 4. Market Factor Analysis
- 4.1. Porters Five Forces
- 4.1.1. Bargaining Power of Suppliers
- 4.1.2. Bargaining Power of Buyers
- 4.1.3. Threat of New Entrants
- 4.1.4. Threat of Substitutes
- 4.1.5. Competitive Rivalry
- 4.2. PESTEL analysis
- 4.3. BCG Analysis
- 4.3.1. Stars (High Growth, High Market Share)
- 4.3.2. Cash Cows (Low Growth, High Market Share)
- 4.3.3. Question Mark (High Growth, Low Market Share)
- 4.3.4. Dogs (Low Growth, Low Market Share)
- 4.4. Ansoff Matrix Analysis
- 4.5. Supply Chain Analysis
- 4.6. Regulatory Landscape
- 4.7. Current Market Potential and Opportunity Assessment (TAM–SAM–SOM Framework)
- 4.8. IMR Analyst Note
- 4.1. Porters Five Forces
- 5. Market Analysis, Insights and Forecast 2021-2033
- 5.1. Market Analysis, Insights and Forecast - by Horsepower
- 5.1.1. Below 40 HP
- 5.1.2. 40 HP - 100 HP
- 5.1.3. Above 100 HP
- 5.2. Market Analysis, Insights and Forecast - by Drive Type
- 5.2.1. Two-wheel Drive
- 5.2.2. Four-wheel Drive/All-wheel Drive
- 5.3. Market Analysis, Insights and Forecast - by Region
- 5.3.1. North America
- 5.3.2. Europe
- 5.3.3. Asia Pacific
- 5.3.4. Rest of the World
- 5.1. Market Analysis, Insights and Forecast - by Horsepower
- 6. Global Tractor Industry Analysis, Insights and Forecast, 2021-2033
- 6.1. Market Analysis, Insights and Forecast - by Horsepower
- 6.1.1. Below 40 HP
- 6.1.2. 40 HP - 100 HP
- 6.1.3. Above 100 HP
- 6.2. Market Analysis, Insights and Forecast - by Drive Type
- 6.2.1. Two-wheel Drive
- 6.2.2. Four-wheel Drive/All-wheel Drive
- 6.1. Market Analysis, Insights and Forecast - by Horsepower
- 7. North America Tractor Industry Analysis, Insights and Forecast, 2020-2032
- 7.1. Market Analysis, Insights and Forecast - by Horsepower
- 7.1.1. Below 40 HP
- 7.1.2. 40 HP - 100 HP
- 7.1.3. Above 100 HP
- 7.2. Market Analysis, Insights and Forecast - by Drive Type
- 7.2.1. Two-wheel Drive
- 7.2.2. Four-wheel Drive/All-wheel Drive
- 7.1. Market Analysis, Insights and Forecast - by Horsepower
- 8. Europe Tractor Industry Analysis, Insights and Forecast, 2020-2032
- 8.1. Market Analysis, Insights and Forecast - by Horsepower
- 8.1.1. Below 40 HP
- 8.1.2. 40 HP - 100 HP
- 8.1.3. Above 100 HP
- 8.2. Market Analysis, Insights and Forecast - by Drive Type
- 8.2.1. Two-wheel Drive
- 8.2.2. Four-wheel Drive/All-wheel Drive
- 8.1. Market Analysis, Insights and Forecast - by Horsepower
- 9. Asia Pacific Tractor Industry Analysis, Insights and Forecast, 2020-2032
- 9.1. Market Analysis, Insights and Forecast - by Horsepower
- 9.1.1. Below 40 HP
- 9.1.2. 40 HP - 100 HP
- 9.1.3. Above 100 HP
- 9.2. Market Analysis, Insights and Forecast - by Drive Type
- 9.2.1. Two-wheel Drive
- 9.2.2. Four-wheel Drive/All-wheel Drive
- 9.1. Market Analysis, Insights and Forecast - by Horsepower
- 10. Rest of the World Tractor Industry Analysis, Insights and Forecast, 2020-2032
- 10.1. Market Analysis, Insights and Forecast - by Horsepower
- 10.1.1. Below 40 HP
- 10.1.2. 40 HP - 100 HP
- 10.1.3. Above 100 HP
- 10.2. Market Analysis, Insights and Forecast - by Drive Type
- 10.2.1. Two-wheel Drive
- 10.2.2. Four-wheel Drive/All-wheel Drive
- 10.1. Market Analysis, Insights and Forecast - by Horsepower
- 11. Competitive Analysis
- 11.1. Company Profiles
- 11.1.1 Escorts Limited
- 11.1.1.1. Company Overview
- 11.1.1.2. Products
- 11.1.1.3. Company Financials
- 11.1.1.4. SWOT Analysis
- 11.1.2 Deere and Company
- 11.1.2.1. Company Overview
- 11.1.2.2. Products
- 11.1.2.3. Company Financials
- 11.1.2.4. SWOT Analysis
- 11.1.3 Kubota Corporation
- 11.1.3.1. Company Overview
- 11.1.3.2. Products
- 11.1.3.3. Company Financials
- 11.1.3.4. SWOT Analysis
- 11.1.4 CNH Global NV (includes New Holland and Case IH)
- 11.1.4.1. Company Overview
- 11.1.4.2. Products
- 11.1.4.3. Company Financials
- 11.1.4.4. SWOT Analysis
- 11.1.5 Yanmar Company Limited
- 11.1.5.1. Company Overview
- 11.1.5.2. Products
- 11.1.5.3. Company Financials
- 11.1.5.4. SWOT Analysis
- 11.1.6 Kuhn Group (Subsidiary of Bucher Industries)
- 11.1.6.1. Company Overview
- 11.1.6.2. Products
- 11.1.6.3. Company Financials
- 11.1.6.4. SWOT Analysis
- 11.1.7 Deutz-Fah
- 11.1.7.1. Company Overview
- 11.1.7.2. Products
- 11.1.7.3. Company Financials
- 11.1.7.4. SWOT Analysis
- 11.1.8 Mahindra and Mahindra Corporation
- 11.1.8.1. Company Overview
- 11.1.8.2. Products
- 11.1.8.3. Company Financials
- 11.1.8.4. SWOT Analysis
- 11.1.9 CLAAS KGaA mbH
- 11.1.9.1. Company Overview
- 11.1.9.2. Products
- 11.1.9.3. Company Financials
- 11.1.9.4. SWOT Analysis
- 11.1.10 Tractors and Farm Equipment Limited (TAFE)
- 11.1.10.1. Company Overview
- 11.1.10.2. Products
- 11.1.10.3. Company Financials
- 11.1.10.4. SWOT Analysis
- 11.1.11 AGCO Corporation (includes Massey Ferguson Valtra Fendt and Challenger)
- 11.1.11.1. Company Overview
- 11.1.11.2. Products
- 11.1.11.3. Company Financials
- 11.1.11.4. SWOT Analysis
- 11.1.1 Escorts Limited
- 11.2. Market Entropy
- 11.2.1 Company's Key Areas Served
- 11.2.2 Recent Developments
- 11.3. Company Market Share Analysis 2025
- 11.3.1 Top 5 Companies Market Share Analysis
- 11.3.2 Top 3 Companies Market Share Analysis
- 11.4. List of Potential Customers
- 12. Research Methodology
List of Figures
- Figure 1: Global Tractor Industry Revenue Breakdown (Million, %) by Region 2025 & 2033
- Figure 2: North America Tractor Industry Revenue (Million), by Horsepower 2025 & 2033
- Figure 3: North America Tractor Industry Revenue Share (%), by Horsepower 2025 & 2033
- Figure 4: North America Tractor Industry Revenue (Million), by Drive Type 2025 & 2033
- Figure 5: North America Tractor Industry Revenue Share (%), by Drive Type 2025 & 2033
- Figure 6: North America Tractor Industry Revenue (Million), by Country 2025 & 2033
- Figure 7: North America Tractor Industry Revenue Share (%), by Country 2025 & 2033
- Figure 8: Europe Tractor Industry Revenue (Million), by Horsepower 2025 & 2033
- Figure 9: Europe Tractor Industry Revenue Share (%), by Horsepower 2025 & 2033
- Figure 10: Europe Tractor Industry Revenue (Million), by Drive Type 2025 & 2033
- Figure 11: Europe Tractor Industry Revenue Share (%), by Drive Type 2025 & 2033
- Figure 12: Europe Tractor Industry Revenue (Million), by Country 2025 & 2033
- Figure 13: Europe Tractor Industry Revenue Share (%), by Country 2025 & 2033
- Figure 14: Asia Pacific Tractor Industry Revenue (Million), by Horsepower 2025 & 2033
- Figure 15: Asia Pacific Tractor Industry Revenue Share (%), by Horsepower 2025 & 2033
- Figure 16: Asia Pacific Tractor Industry Revenue (Million), by Drive Type 2025 & 2033
- Figure 17: Asia Pacific Tractor Industry Revenue Share (%), by Drive Type 2025 & 2033
- Figure 18: Asia Pacific Tractor Industry Revenue (Million), by Country 2025 & 2033
- Figure 19: Asia Pacific Tractor Industry Revenue Share (%), by Country 2025 & 2033
- Figure 20: Rest of the World Tractor Industry Revenue (Million), by Horsepower 2025 & 2033
- Figure 21: Rest of the World Tractor Industry Revenue Share (%), by Horsepower 2025 & 2033
- Figure 22: Rest of the World Tractor Industry Revenue (Million), by Drive Type 2025 & 2033
- Figure 23: Rest of the World Tractor Industry Revenue Share (%), by Drive Type 2025 & 2033
- Figure 24: Rest of the World Tractor Industry Revenue (Million), by Country 2025 & 2033
- Figure 25: Rest of the World Tractor Industry Revenue Share (%), by Country 2025 & 2033
List of Tables
- Table 1: Global Tractor Industry Revenue Million Forecast, by Horsepower 2020 & 2033
- Table 2: Global Tractor Industry Revenue Million Forecast, by Drive Type 2020 & 2033
- Table 3: Global Tractor Industry Revenue Million Forecast, by Region 2020 & 2033
- Table 4: Global Tractor Industry Revenue Million Forecast, by Horsepower 2020 & 2033
- Table 5: Global Tractor Industry Revenue Million Forecast, by Drive Type 2020 & 2033
- Table 6: Global Tractor Industry Revenue Million Forecast, by Country 2020 & 2033
- Table 7: United States Tractor Industry Revenue (Million) Forecast, by Application 2020 & 2033
- Table 8: Canada Tractor Industry Revenue (Million) Forecast, by Application 2020 & 2033
- Table 9: Rest of North America Tractor Industry Revenue (Million) Forecast, by Application 2020 & 2033
- Table 10: Global Tractor Industry Revenue Million Forecast, by Horsepower 2020 & 2033
- Table 11: Global Tractor Industry Revenue Million Forecast, by Drive Type 2020 & 2033
- Table 12: Global Tractor Industry Revenue Million Forecast, by Country 2020 & 2033
- Table 13: Germany Tractor Industry Revenue (Million) Forecast, by Application 2020 & 2033
- Table 14: United Kingdom Tractor Industry Revenue (Million) Forecast, by Application 2020 & 2033
- Table 15: France Tractor Industry Revenue (Million) Forecast, by Application 2020 & 2033
- Table 16: Spain Tractor Industry Revenue (Million) Forecast, by Application 2020 & 2033
- Table 17: Italy Tractor Industry Revenue (Million) Forecast, by Application 2020 & 2033
- Table 18: Rest of Europe Tractor Industry Revenue (Million) Forecast, by Application 2020 & 2033
- Table 19: Global Tractor Industry Revenue Million Forecast, by Horsepower 2020 & 2033
- Table 20: Global Tractor Industry Revenue Million Forecast, by Drive Type 2020 & 2033
- Table 21: Global Tractor Industry Revenue Million Forecast, by Country 2020 & 2033
- Table 22: China Tractor Industry Revenue (Million) Forecast, by Application 2020 & 2033
- Table 23: Japan Tractor Industry Revenue (Million) Forecast, by Application 2020 & 2033
- Table 24: India Tractor Industry Revenue (Million) Forecast, by Application 2020 & 2033
- Table 25: South Korea Tractor Industry Revenue (Million) Forecast, by Application 2020 & 2033
- Table 26: Rest of Asia Pacific Tractor Industry Revenue (Million) Forecast, by Application 2020 & 2033
- Table 27: Global Tractor Industry Revenue Million Forecast, by Horsepower 2020 & 2033
- Table 28: Global Tractor Industry Revenue Million Forecast, by Drive Type 2020 & 2033
- Table 29: Global Tractor Industry Revenue Million Forecast, by Country 2020 & 2033
- Table 30: South America Tractor Industry Revenue (Million) Forecast, by Application 2020 & 2033
- Table 31: Middle East and Africa Tractor Industry Revenue (Million) Forecast, by Application 2020 & 2033
Frequently Asked Questions
1. What is the projected Compound Annual Growth Rate (CAGR) of the Tractor Industry?
The projected CAGR is approximately 5.90%.
2. Which companies are prominent players in the Tractor Industry?
Key companies in the market include Escorts Limited, Deere and Company, Kubota Corporation, CNH Global NV (includes New Holland and Case IH), Yanmar Company Limited, Kuhn Group (Subsidiary of Bucher Industries), Deutz-Fah, Mahindra and Mahindra Corporation, CLAAS KGaA mbH, Tractors and Farm Equipment Limited (TAFE), AGCO Corporation (includes Massey Ferguson Valtra Fendt and Challenger).
3. What are the main segments of the Tractor Industry?
The market segments include Horsepower, Drive Type.
4. Can you provide details about the market size?
The market size is estimated to be USD 84.80 Million as of 2022.
5. What are some drivers contributing to market growth?
Rising Residential Activities in Addition to Consumer Spending to Enhance Market Demand.
6. What are the notable trends driving market growth?
The Below 40 HP Tractors Segment's Growth is Expected to be Bolstered over the Next Five Years.
7. Are there any restraints impacting market growth?
Rising Electric Vehicle Adoption to Hinder Market Growth in the Long Run.
8. Can you provide examples of recent developments in the market?
March 2024: Hyster Company announced an agreement to provide APM Terminals with 10 battery-powered terminal tractors for their location at the Port of Mobile in Alabama. The electric terminal tractors, which are scheduled to be delivered in 2024, are part of a USD 60 million investment in port equipment electrification pilots by APM Terminals.
9. What pricing options are available for accessing the report?
Pricing options include single-user, multi-user, and enterprise licenses priced at USD 4750, USD 5250, and USD 8750 respectively.
10. Is the market size provided in terms of value or volume?
The market size is provided in terms of value, measured in Million.
11. Are there any specific market keywords associated with the report?
Yes, the market keyword associated with the report is "Tractor Industry," which aids in identifying and referencing the specific market segment covered.
12. How do I determine which pricing option suits my needs best?
The pricing options vary based on user requirements and access needs. Individual users may opt for single-user licenses, while businesses requiring broader access may choose multi-user or enterprise licenses for cost-effective access to the report.
13. Are there any additional resources or data provided in the Tractor Industry report?
While the report offers comprehensive insights, it's advisable to review the specific contents or supplementary materials provided to ascertain if additional resources or data are available.
14. How can I stay updated on further developments or reports in the Tractor Industry?
To stay informed about further developments, trends, and reports in the Tractor Industry, consider subscribing to industry newsletters, following relevant companies and organizations, or regularly checking reputable industry news sources and publications.
Methodology
Step 1 - Identification of Relevant Samples Size from Population Database


Step 2 - Approaches for Defining Global Market Size (Value, Volume* & Price*)

Note*: In applicable scenarios
Step 3 - Data Sources
Primary Research
- Web Analytics
- Survey Reports
- Research Institute
- Latest Research Reports
- Opinion Leaders
Secondary Research
- Annual Reports
- White Paper
- Latest Press Release
- Industry Association
- Paid Database
- Investor Presentations

Step 4 - Data Triangulation
Involves using different sources of information in order to increase the validity of a study
These sources are likely to be stakeholders in a program - participants, other researchers, program staff, other community members, and so on.
Then we put all data in single framework & apply various statistical tools to find out the dynamic on the market.
During the analysis stage, feedback from the stakeholder groups would be compared to determine areas of agreement as well as areas of divergence