

Key Insights
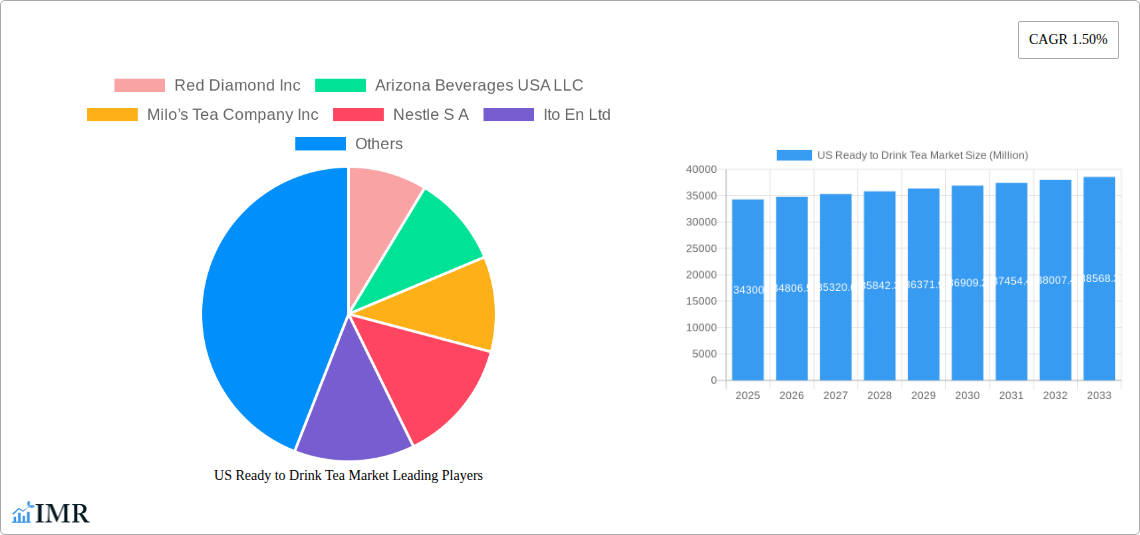
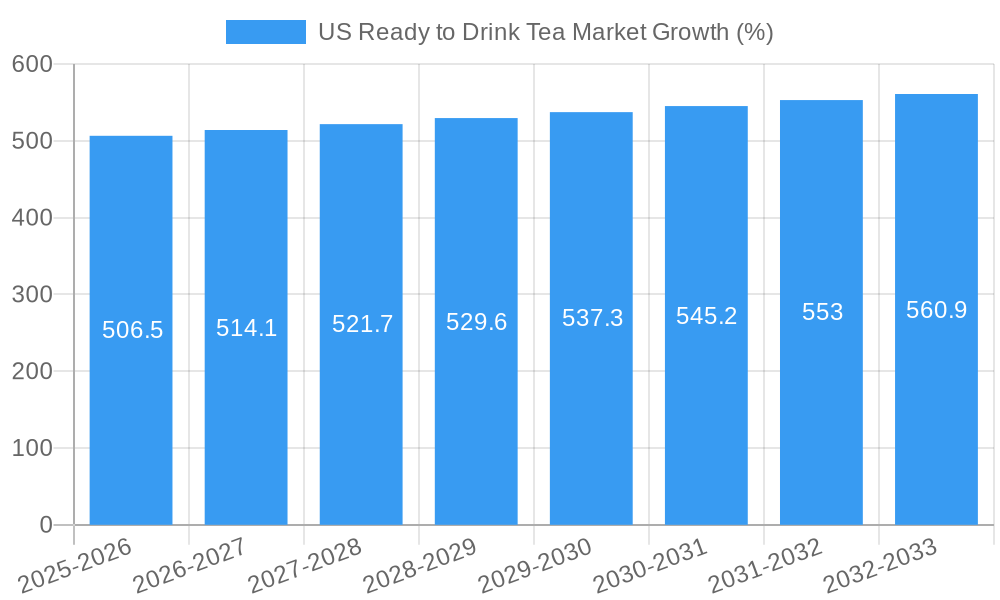
The US Ready-to-Drink (RTD) tea market, valued at $34.3 billion in 2025, is projected to experience steady growth, driven by increasing consumer demand for convenient and healthy beverage options. The market's Compound Annual Growth Rate (CAGR) of 1.5% from 2025 to 2033 reflects a consistent, albeit moderate, expansion. Key growth drivers include the rising popularity of functional beverages, a growing awareness of tea's health benefits (antioxidants, etc.), and the increasing preference for on-the-go consumption. The diverse range of flavors, including green tea, herbal tea, and iced tea, caters to evolving consumer preferences, while innovative packaging options like PET bottles and aseptic packages enhance product shelf life and portability, further fueling market growth. However, intense competition from other beverage categories, fluctuating tea prices, and concerns about sugar content in certain RTD teas pose challenges to market expansion. The segmentation by distribution channel (off-trade vs. on-trade) and packaging type highlights opportunities for targeted marketing strategies and product innovation. Major players like PepsiCo, Coca-Cola, and Nestle leverage their extensive distribution networks and brand recognition to maintain market dominance. Regional variations in consumer preferences and distribution infrastructure influence market performance across the United States, with potential for further growth in regions exhibiting higher consumer health consciousness.
Growth in the RTD tea sector is significantly influenced by evolving consumer lifestyles and preferences. The increasing prevalence of health-conscious consumers seeking functional beverages with natural ingredients, along with the readily available and convenient nature of RTD tea, fuels the consistent growth. While the 1.5% CAGR indicates a relatively stable market, strategic investments in product diversification (e.g., organic and premium tea varieties), sustainable packaging solutions, and targeted marketing campaigns to specific demographics will be crucial for companies to maintain a competitive edge and capitalize on emerging market trends. Furthermore, addressing concerns about sugar content and incorporating healthier sweetener alternatives could significantly boost market penetration and contribute to higher growth rates in the coming years.
US Ready to Drink Tea Market: A Comprehensive Report (2019-2033)
This comprehensive report provides an in-depth analysis of the US Ready to Drink (RTD) Tea market, encompassing market dynamics, growth trends, regional segmentation, product landscape, key players, and future outlook. The report covers the period from 2019 to 2033, with 2025 as the base year and a forecast period of 2025-2033. This analysis leverages extensive primary and secondary research, offering crucial insights for industry professionals, investors, and strategic decision-makers. The market is segmented by soft drink type (Green Tea, Herbal Tea, Iced Tea, Other RTD Tea), packaging type (Aseptic packages, Glass Bottles, Metal Can, PET Bottles), and distribution channel (Off-trade, On-trade).
US Ready to Drink Tea Market Dynamics & Structure
The US RTD tea market is a dynamic landscape characterized by intense competition, rapid innovation, and evolving consumer preferences. Market concentration is relatively high, with major players like PepsiCo Inc, The Coca-Cola Company, and Nestle S A holding significant market share (estimated at xx% combined in 2025). Technological innovations, particularly in packaging and flavor profiles, are key growth drivers. Regulatory frameworks concerning sugar content and labeling influence product development. Competitive substitutes include other beverages like carbonated soft drinks and juices. The end-user demographic is broad, encompassing all age groups and income levels, with significant growth observed among health-conscious consumers. M&A activity is moderate, with a predicted xx deals in the forecast period (2025-2033), mainly driven by smaller players seeking to consolidate their market position.
- Market Concentration: High, with top 5 players controlling approximately xx% of market share in 2025.
- Technological Innovation: Focus on sustainable packaging, functional ingredients, and novel flavor combinations.
- Regulatory Landscape: Stringent regulations on sugar content and labeling are shaping product reformulation.
- Competitive Substitutes: Carbonated soft drinks, fruit juices, and other functional beverages.
- End-User Demographics: Diverse, spanning across all age groups and income levels.
- M&A Activity: Moderate level of mergers and acquisitions, driven by consolidation efforts.
US Ready to Drink Tea Market Growth Trends & Insights
The US RTD tea market is experiencing robust growth, driven by increasing consumer demand for healthier and more convenient beverage options. The market size, valued at xx million units in 2025, is projected to reach xx million units by 2033, exhibiting a CAGR of xx% during the forecast period. This growth is fueled by rising health consciousness, increasing disposable incomes, and the growing popularity of ready-to-drink beverages. Technological disruptions, such as the introduction of innovative packaging materials and enhanced flavor technologies, are further accelerating market expansion. Consumer behavior is shifting towards premiumization and functional benefits, with a growing demand for organic, natural, and functional teas. Market penetration is expected to increase to xx% by 2033.
Dominant Regions, Countries, or Segments in US Ready to Drink Tea Market
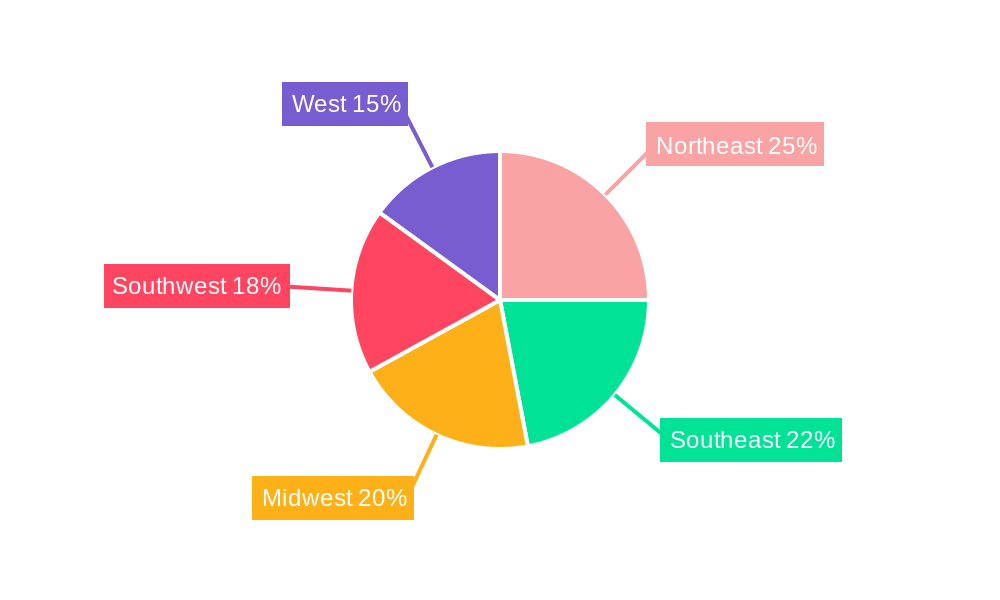
The Iced Tea segment dominates the US RTD tea market, accounting for approximately xx% of the total market volume in 2025. This segment's dominance is attributed to its widespread popularity and established consumer base. PET Bottles are the leading packaging type, driven by their convenience and cost-effectiveness. The off-trade distribution channel holds a larger market share than the on-trade channel, owing to the accessibility of supermarkets, convenience stores, and online retailers. The South and West regions of the U.S. show higher consumption rates.
- Key Drivers:
- Iced Tea Segment: High consumer preference for refreshment.
- PET Bottles: Cost-effectiveness and convenience.
- Off-trade Channel: Wide availability and accessibility.
- Dominance Factors:
- Established consumer base for Iced Tea.
- Strong retail infrastructure for off-trade distribution.
- Cost-effectiveness of PET bottle packaging.
US Ready to Drink Tea Market Product Landscape
The US RTD tea market showcases a diverse range of products, encompassing traditional iced teas, flavored teas, functional teas with added vitamins or antioxidants, and organic options. Product innovation is focused on creating unique flavor profiles, incorporating functional ingredients, and developing sustainable packaging solutions. Key performance metrics include sales volume, market share, and consumer satisfaction. Unique selling propositions focus on natural ingredients, health benefits, convenience, and innovative flavor combinations.
Key Drivers, Barriers & Challenges in US Ready to Drink Tea Market
Key Drivers: Growing health consciousness among consumers, increasing demand for convenient beverage options, and rising disposable incomes are driving the market's expansion. Technological advancements in flavor and packaging are also contributing to growth.
Key Challenges: Intense competition from established players and new entrants poses a significant challenge. Fluctuating raw material prices and supply chain disruptions can impact profitability. Stringent regulatory requirements related to labeling and sugar content add complexity to product development.
Emerging Opportunities in US Ready to Drink Tea Market
Emerging opportunities include the growing demand for organic and functional teas, the expansion into niche markets like premium and specialty teas, and the development of innovative packaging solutions. The increasing use of e-commerce platforms presents new distribution channels. Focus on sustainable sourcing and eco-friendly packaging presents another significant opportunity.
Growth Accelerators in the US Ready to Drink Tea Market Industry
Technological breakthroughs in flavor enhancement and packaging, strategic partnerships between tea companies and food retailers, and market expansion strategies into new geographical areas and demographics are key growth accelerators.
Key Players Shaping the US Ready to Drink Tea Market Market
- Red Diamond Inc
- Arizona Beverages USA LLC
- Milo’s Tea Company Inc
- Nestle S A
- Ito En Ltd
- PepsiCo Inc
- Hawaiian Sun Products Inc
- Keurig Dr Pepper Inc
- The Coca-Cola Company
- Del Monte Foods Inc
- Reily Foods Company
- Walmart Inc
Notable Milestones in US Ready to Drink Tea Market Sector
- January 2023: Milo's Tea Company announces a USD 130 million investment in a new plant and distribution center, signaling significant growth in the brand.
- January 2023: Lipton Tea partners with Full Cart to enhance access to healthy nutrition, highlighting a focus on social responsibility.
- December 2022: Pure Leaf launches a limited-edition Merry Mint Iced Tea, leveraging a tie-in with a Christmas movie for marketing purposes.
In-Depth US Ready to Drink Tea Market Market Outlook
The US RTD tea market is poised for continued growth, driven by evolving consumer preferences and technological innovations. Strategic partnerships, expansion into emerging segments like functional and organic teas, and the adoption of sustainable practices will further fuel market expansion. The focus on health and wellness will continue to shape product development and marketing strategies, presenting lucrative opportunities for both established and emerging players.
US Ready to Drink Tea Market Segmentation
-
1. Soft Drink Type
- 1.1. Green Tea
- 1.2. Herbal Tea
- 1.3. Iced Tea
- 1.4. Other RTD Tea
-
2. Packaging Type
- 2.1. Aseptic packages
- 2.2. Glass Bottles
- 2.3. Metal Can
- 2.4. PET Bottles
-
3. Distribution Channel
-
3.1. Off-trade
- 3.1.1. Convenience Stores
- 3.1.2. Online Retail
- 3.1.3. Supermarket/Hypermarket
- 3.1.4. Others
- 3.2. On-trade
-
3.1. Off-trade
US Ready to Drink Tea Market Segmentation By Geography
-
1. North America
- 1.1. United States
- 1.2. Canada
- 1.3. Mexico
-
2. South America
- 2.1. Brazil
- 2.2. Argentina
- 2.3. Rest of South America
-
3. Europe
- 3.1. United Kingdom
- 3.2. Germany
- 3.3. France
- 3.4. Italy
- 3.5. Spain
- 3.6. Russia
- 3.7. Benelux
- 3.8. Nordics
- 3.9. Rest of Europe
-
4. Middle East & Africa
- 4.1. Turkey
- 4.2. Israel
- 4.3. GCC
- 4.4. North Africa
- 4.5. South Africa
- 4.6. Rest of Middle East & Africa
-
5. Asia Pacific
- 5.1. China
- 5.2. India
- 5.3. Japan
- 5.4. South Korea
- 5.5. ASEAN
- 5.6. Oceania
- 5.7. Rest of Asia Pacific
US Ready to Drink Tea Market REPORT HIGHLIGHTS
| Aspects | Details |
|---|---|
| Study Period | 2019-2033 |
| Base Year | 2024 |
| Estimated Year | 2025 |
| Forecast Period | 2025-2033 |
| Historical Period | 2019-2024 |
| Growth Rate | CAGR of 1.50% from 2019-2033 |
| Segmentation |
|
Table of Contents
- 1. Introduction
- 1.1. Research Scope
- 1.2. Market Segmentation
- 1.3. Research Methodology
- 1.4. Definitions and Assumptions
- 2. Executive Summary
- 2.1. Introduction
- 3. Market Dynamics
- 3.1. Introduction
- 3.2. Market Drivers
- 3.2.1. Increasing demand for meat alternatives
- 3.3. Market Restrains
- 3.3.1. Presence of numerous alternatives in the plant proteins
- 3.4. Market Trends
- 3.4.1. OTHER KEY INDUSTRY TRENDS COVERED IN THE REPORT
- 4. Market Factor Analysis
- 4.1. Porters Five Forces
- 4.2. Supply/Value Chain
- 4.3. PESTEL analysis
- 4.4. Market Entropy
- 4.5. Patent/Trademark Analysis
- 5. Global US Ready to Drink Tea Market Analysis, Insights and Forecast, 2019-2031
- 5.1. Market Analysis, Insights and Forecast - by Soft Drink Type
- 5.1.1. Green Tea
- 5.1.2. Herbal Tea
- 5.1.3. Iced Tea
- 5.1.4. Other RTD Tea
- 5.2. Market Analysis, Insights and Forecast - by Packaging Type
- 5.2.1. Aseptic packages
- 5.2.2. Glass Bottles
- 5.2.3. Metal Can
- 5.2.4. PET Bottles
- 5.3. Market Analysis, Insights and Forecast - by Distribution Channel
- 5.3.1. Off-trade
- 5.3.1.1. Convenience Stores
- 5.3.1.2. Online Retail
- 5.3.1.3. Supermarket/Hypermarket
- 5.3.1.4. Others
- 5.3.2. On-trade
- 5.3.1. Off-trade
- 5.4. Market Analysis, Insights and Forecast - by Region
- 5.4.1. North America
- 5.4.2. South America
- 5.4.3. Europe
- 5.4.4. Middle East & Africa
- 5.4.5. Asia Pacific
- 5.1. Market Analysis, Insights and Forecast - by Soft Drink Type
- 6. North America US Ready to Drink Tea Market Analysis, Insights and Forecast, 2019-2031
- 6.1. Market Analysis, Insights and Forecast - by Soft Drink Type
- 6.1.1. Green Tea
- 6.1.2. Herbal Tea
- 6.1.3. Iced Tea
- 6.1.4. Other RTD Tea
- 6.2. Market Analysis, Insights and Forecast - by Packaging Type
- 6.2.1. Aseptic packages
- 6.2.2. Glass Bottles
- 6.2.3. Metal Can
- 6.2.4. PET Bottles
- 6.3. Market Analysis, Insights and Forecast - by Distribution Channel
- 6.3.1. Off-trade
- 6.3.1.1. Convenience Stores
- 6.3.1.2. Online Retail
- 6.3.1.3. Supermarket/Hypermarket
- 6.3.1.4. Others
- 6.3.2. On-trade
- 6.3.1. Off-trade
- 6.1. Market Analysis, Insights and Forecast - by Soft Drink Type
- 7. South America US Ready to Drink Tea Market Analysis, Insights and Forecast, 2019-2031
- 7.1. Market Analysis, Insights and Forecast - by Soft Drink Type
- 7.1.1. Green Tea
- 7.1.2. Herbal Tea
- 7.1.3. Iced Tea
- 7.1.4. Other RTD Tea
- 7.2. Market Analysis, Insights and Forecast - by Packaging Type
- 7.2.1. Aseptic packages
- 7.2.2. Glass Bottles
- 7.2.3. Metal Can
- 7.2.4. PET Bottles
- 7.3. Market Analysis, Insights and Forecast - by Distribution Channel
- 7.3.1. Off-trade
- 7.3.1.1. Convenience Stores
- 7.3.1.2. Online Retail
- 7.3.1.3. Supermarket/Hypermarket
- 7.3.1.4. Others
- 7.3.2. On-trade
- 7.3.1. Off-trade
- 7.1. Market Analysis, Insights and Forecast - by Soft Drink Type
- 8. Europe US Ready to Drink Tea Market Analysis, Insights and Forecast, 2019-2031
- 8.1. Market Analysis, Insights and Forecast - by Soft Drink Type
- 8.1.1. Green Tea
- 8.1.2. Herbal Tea
- 8.1.3. Iced Tea
- 8.1.4. Other RTD Tea
- 8.2. Market Analysis, Insights and Forecast - by Packaging Type
- 8.2.1. Aseptic packages
- 8.2.2. Glass Bottles
- 8.2.3. Metal Can
- 8.2.4. PET Bottles
- 8.3. Market Analysis, Insights and Forecast - by Distribution Channel
- 8.3.1. Off-trade
- 8.3.1.1. Convenience Stores
- 8.3.1.2. Online Retail
- 8.3.1.3. Supermarket/Hypermarket
- 8.3.1.4. Others
- 8.3.2. On-trade
- 8.3.1. Off-trade
- 8.1. Market Analysis, Insights and Forecast - by Soft Drink Type
- 9. Middle East & Africa US Ready to Drink Tea Market Analysis, Insights and Forecast, 2019-2031
- 9.1. Market Analysis, Insights and Forecast - by Soft Drink Type
- 9.1.1. Green Tea
- 9.1.2. Herbal Tea
- 9.1.3. Iced Tea
- 9.1.4. Other RTD Tea
- 9.2. Market Analysis, Insights and Forecast - by Packaging Type
- 9.2.1. Aseptic packages
- 9.2.2. Glass Bottles
- 9.2.3. Metal Can
- 9.2.4. PET Bottles
- 9.3. Market Analysis, Insights and Forecast - by Distribution Channel
- 9.3.1. Off-trade
- 9.3.1.1. Convenience Stores
- 9.3.1.2. Online Retail
- 9.3.1.3. Supermarket/Hypermarket
- 9.3.1.4. Others
- 9.3.2. On-trade
- 9.3.1. Off-trade
- 9.1. Market Analysis, Insights and Forecast - by Soft Drink Type
- 10. Asia Pacific US Ready to Drink Tea Market Analysis, Insights and Forecast, 2019-2031
- 10.1. Market Analysis, Insights and Forecast - by Soft Drink Type
- 10.1.1. Green Tea
- 10.1.2. Herbal Tea
- 10.1.3. Iced Tea
- 10.1.4. Other RTD Tea
- 10.2. Market Analysis, Insights and Forecast - by Packaging Type
- 10.2.1. Aseptic packages
- 10.2.2. Glass Bottles
- 10.2.3. Metal Can
- 10.2.4. PET Bottles
- 10.3. Market Analysis, Insights and Forecast - by Distribution Channel
- 10.3.1. Off-trade
- 10.3.1.1. Convenience Stores
- 10.3.1.2. Online Retail
- 10.3.1.3. Supermarket/Hypermarket
- 10.3.1.4. Others
- 10.3.2. On-trade
- 10.3.1. Off-trade
- 10.1. Market Analysis, Insights and Forecast - by Soft Drink Type
- 11. Northeast US Ready to Drink Tea Market Analysis, Insights and Forecast, 2019-2031
- 12. Southeast US Ready to Drink Tea Market Analysis, Insights and Forecast, 2019-2031
- 13. Midwest US Ready to Drink Tea Market Analysis, Insights and Forecast, 2019-2031
- 14. Southwest US Ready to Drink Tea Market Analysis, Insights and Forecast, 2019-2031
- 15. West US Ready to Drink Tea Market Analysis, Insights and Forecast, 2019-2031
- 16. Competitive Analysis
- 16.1. Global Market Share Analysis 2024
- 16.2. Company Profiles
- 16.2.1 Red Diamond Inc
- 16.2.1.1. Overview
- 16.2.1.2. Products
- 16.2.1.3. SWOT Analysis
- 16.2.1.4. Recent Developments
- 16.2.1.5. Financials (Based on Availability)
- 16.2.2 Arizona Beverages USA LLC
- 16.2.2.1. Overview
- 16.2.2.2. Products
- 16.2.2.3. SWOT Analysis
- 16.2.2.4. Recent Developments
- 16.2.2.5. Financials (Based on Availability)
- 16.2.3 Milo’s Tea Company Inc
- 16.2.3.1. Overview
- 16.2.3.2. Products
- 16.2.3.3. SWOT Analysis
- 16.2.3.4. Recent Developments
- 16.2.3.5. Financials (Based on Availability)
- 16.2.4 Nestle S A
- 16.2.4.1. Overview
- 16.2.4.2. Products
- 16.2.4.3. SWOT Analysis
- 16.2.4.4. Recent Developments
- 16.2.4.5. Financials (Based on Availability)
- 16.2.5 Ito En Ltd
- 16.2.5.1. Overview
- 16.2.5.2. Products
- 16.2.5.3. SWOT Analysis
- 16.2.5.4. Recent Developments
- 16.2.5.5. Financials (Based on Availability)
- 16.2.6 PepsiCo Inc
- 16.2.6.1. Overview
- 16.2.6.2. Products
- 16.2.6.3. SWOT Analysis
- 16.2.6.4. Recent Developments
- 16.2.6.5. Financials (Based on Availability)
- 16.2.7 Hawaiian Sun Products Inc
- 16.2.7.1. Overview
- 16.2.7.2. Products
- 16.2.7.3. SWOT Analysis
- 16.2.7.4. Recent Developments
- 16.2.7.5. Financials (Based on Availability)
- 16.2.8 Keurig Dr Pepper Inc
- 16.2.8.1. Overview
- 16.2.8.2. Products
- 16.2.8.3. SWOT Analysis
- 16.2.8.4. Recent Developments
- 16.2.8.5. Financials (Based on Availability)
- 16.2.9 The Coca-Cola Company
- 16.2.9.1. Overview
- 16.2.9.2. Products
- 16.2.9.3. SWOT Analysis
- 16.2.9.4. Recent Developments
- 16.2.9.5. Financials (Based on Availability)
- 16.2.10 Del Monte Foods Inc
- 16.2.10.1. Overview
- 16.2.10.2. Products
- 16.2.10.3. SWOT Analysis
- 16.2.10.4. Recent Developments
- 16.2.10.5. Financials (Based on Availability)
- 16.2.11 Reily Foods Company
- 16.2.11.1. Overview
- 16.2.11.2. Products
- 16.2.11.3. SWOT Analysis
- 16.2.11.4. Recent Developments
- 16.2.11.5. Financials (Based on Availability)
- 16.2.12 Walmart Inc
- 16.2.12.1. Overview
- 16.2.12.2. Products
- 16.2.12.3. SWOT Analysis
- 16.2.12.4. Recent Developments
- 16.2.12.5. Financials (Based on Availability)
- 16.2.1 Red Diamond Inc
List of Figures
- Figure 1: Global US Ready to Drink Tea Market Revenue Breakdown (Million, %) by Region 2024 & 2032
- Figure 2: Global US Ready to Drink Tea Market Volume Breakdown (K Tons, %) by Region 2024 & 2032
- Figure 3: United states US Ready to Drink Tea Market Revenue (Million), by Country 2024 & 2032
- Figure 4: United states US Ready to Drink Tea Market Volume (K Tons), by Country 2024 & 2032
- Figure 5: United states US Ready to Drink Tea Market Revenue Share (%), by Country 2024 & 2032
- Figure 6: United states US Ready to Drink Tea Market Volume Share (%), by Country 2024 & 2032
- Figure 7: North America US Ready to Drink Tea Market Revenue (Million), by Soft Drink Type 2024 & 2032
- Figure 8: North America US Ready to Drink Tea Market Volume (K Tons), by Soft Drink Type 2024 & 2032
- Figure 9: North America US Ready to Drink Tea Market Revenue Share (%), by Soft Drink Type 2024 & 2032
- Figure 10: North America US Ready to Drink Tea Market Volume Share (%), by Soft Drink Type 2024 & 2032
- Figure 11: North America US Ready to Drink Tea Market Revenue (Million), by Packaging Type 2024 & 2032
- Figure 12: North America US Ready to Drink Tea Market Volume (K Tons), by Packaging Type 2024 & 2032
- Figure 13: North America US Ready to Drink Tea Market Revenue Share (%), by Packaging Type 2024 & 2032
- Figure 14: North America US Ready to Drink Tea Market Volume Share (%), by Packaging Type 2024 & 2032
- Figure 15: North America US Ready to Drink Tea Market Revenue (Million), by Distribution Channel 2024 & 2032
- Figure 16: North America US Ready to Drink Tea Market Volume (K Tons), by Distribution Channel 2024 & 2032
- Figure 17: North America US Ready to Drink Tea Market Revenue Share (%), by Distribution Channel 2024 & 2032
- Figure 18: North America US Ready to Drink Tea Market Volume Share (%), by Distribution Channel 2024 & 2032
- Figure 19: North America US Ready to Drink Tea Market Revenue (Million), by Country 2024 & 2032
- Figure 20: North America US Ready to Drink Tea Market Volume (K Tons), by Country 2024 & 2032
- Figure 21: North America US Ready to Drink Tea Market Revenue Share (%), by Country 2024 & 2032
- Figure 22: North America US Ready to Drink Tea Market Volume Share (%), by Country 2024 & 2032
- Figure 23: South America US Ready to Drink Tea Market Revenue (Million), by Soft Drink Type 2024 & 2032
- Figure 24: South America US Ready to Drink Tea Market Volume (K Tons), by Soft Drink Type 2024 & 2032
- Figure 25: South America US Ready to Drink Tea Market Revenue Share (%), by Soft Drink Type 2024 & 2032
- Figure 26: South America US Ready to Drink Tea Market Volume Share (%), by Soft Drink Type 2024 & 2032
- Figure 27: South America US Ready to Drink Tea Market Revenue (Million), by Packaging Type 2024 & 2032
- Figure 28: South America US Ready to Drink Tea Market Volume (K Tons), by Packaging Type 2024 & 2032
- Figure 29: South America US Ready to Drink Tea Market Revenue Share (%), by Packaging Type 2024 & 2032
- Figure 30: South America US Ready to Drink Tea Market Volume Share (%), by Packaging Type 2024 & 2032
- Figure 31: South America US Ready to Drink Tea Market Revenue (Million), by Distribution Channel 2024 & 2032
- Figure 32: South America US Ready to Drink Tea Market Volume (K Tons), by Distribution Channel 2024 & 2032
- Figure 33: South America US Ready to Drink Tea Market Revenue Share (%), by Distribution Channel 2024 & 2032
- Figure 34: South America US Ready to Drink Tea Market Volume Share (%), by Distribution Channel 2024 & 2032
- Figure 35: South America US Ready to Drink Tea Market Revenue (Million), by Country 2024 & 2032
- Figure 36: South America US Ready to Drink Tea Market Volume (K Tons), by Country 2024 & 2032
- Figure 37: South America US Ready to Drink Tea Market Revenue Share (%), by Country 2024 & 2032
- Figure 38: South America US Ready to Drink Tea Market Volume Share (%), by Country 2024 & 2032
- Figure 39: Europe US Ready to Drink Tea Market Revenue (Million), by Soft Drink Type 2024 & 2032
- Figure 40: Europe US Ready to Drink Tea Market Volume (K Tons), by Soft Drink Type 2024 & 2032
- Figure 41: Europe US Ready to Drink Tea Market Revenue Share (%), by Soft Drink Type 2024 & 2032
- Figure 42: Europe US Ready to Drink Tea Market Volume Share (%), by Soft Drink Type 2024 & 2032
- Figure 43: Europe US Ready to Drink Tea Market Revenue (Million), by Packaging Type 2024 & 2032
- Figure 44: Europe US Ready to Drink Tea Market Volume (K Tons), by Packaging Type 2024 & 2032
- Figure 45: Europe US Ready to Drink Tea Market Revenue Share (%), by Packaging Type 2024 & 2032
- Figure 46: Europe US Ready to Drink Tea Market Volume Share (%), by Packaging Type 2024 & 2032
- Figure 47: Europe US Ready to Drink Tea Market Revenue (Million), by Distribution Channel 2024 & 2032
- Figure 48: Europe US Ready to Drink Tea Market Volume (K Tons), by Distribution Channel 2024 & 2032
- Figure 49: Europe US Ready to Drink Tea Market Revenue Share (%), by Distribution Channel 2024 & 2032
- Figure 50: Europe US Ready to Drink Tea Market Volume Share (%), by Distribution Channel 2024 & 2032
- Figure 51: Europe US Ready to Drink Tea Market Revenue (Million), by Country 2024 & 2032
- Figure 52: Europe US Ready to Drink Tea Market Volume (K Tons), by Country 2024 & 2032
- Figure 53: Europe US Ready to Drink Tea Market Revenue Share (%), by Country 2024 & 2032
- Figure 54: Europe US Ready to Drink Tea Market Volume Share (%), by Country 2024 & 2032
- Figure 55: Middle East & Africa US Ready to Drink Tea Market Revenue (Million), by Soft Drink Type 2024 & 2032
- Figure 56: Middle East & Africa US Ready to Drink Tea Market Volume (K Tons), by Soft Drink Type 2024 & 2032
- Figure 57: Middle East & Africa US Ready to Drink Tea Market Revenue Share (%), by Soft Drink Type 2024 & 2032
- Figure 58: Middle East & Africa US Ready to Drink Tea Market Volume Share (%), by Soft Drink Type 2024 & 2032
- Figure 59: Middle East & Africa US Ready to Drink Tea Market Revenue (Million), by Packaging Type 2024 & 2032
- Figure 60: Middle East & Africa US Ready to Drink Tea Market Volume (K Tons), by Packaging Type 2024 & 2032
- Figure 61: Middle East & Africa US Ready to Drink Tea Market Revenue Share (%), by Packaging Type 2024 & 2032
- Figure 62: Middle East & Africa US Ready to Drink Tea Market Volume Share (%), by Packaging Type 2024 & 2032
- Figure 63: Middle East & Africa US Ready to Drink Tea Market Revenue (Million), by Distribution Channel 2024 & 2032
- Figure 64: Middle East & Africa US Ready to Drink Tea Market Volume (K Tons), by Distribution Channel 2024 & 2032
- Figure 65: Middle East & Africa US Ready to Drink Tea Market Revenue Share (%), by Distribution Channel 2024 & 2032
- Figure 66: Middle East & Africa US Ready to Drink Tea Market Volume Share (%), by Distribution Channel 2024 & 2032
- Figure 67: Middle East & Africa US Ready to Drink Tea Market Revenue (Million), by Country 2024 & 2032
- Figure 68: Middle East & Africa US Ready to Drink Tea Market Volume (K Tons), by Country 2024 & 2032
- Figure 69: Middle East & Africa US Ready to Drink Tea Market Revenue Share (%), by Country 2024 & 2032
- Figure 70: Middle East & Africa US Ready to Drink Tea Market Volume Share (%), by Country 2024 & 2032
- Figure 71: Asia Pacific US Ready to Drink Tea Market Revenue (Million), by Soft Drink Type 2024 & 2032
- Figure 72: Asia Pacific US Ready to Drink Tea Market Volume (K Tons), by Soft Drink Type 2024 & 2032
- Figure 73: Asia Pacific US Ready to Drink Tea Market Revenue Share (%), by Soft Drink Type 2024 & 2032
- Figure 74: Asia Pacific US Ready to Drink Tea Market Volume Share (%), by Soft Drink Type 2024 & 2032
- Figure 75: Asia Pacific US Ready to Drink Tea Market Revenue (Million), by Packaging Type 2024 & 2032
- Figure 76: Asia Pacific US Ready to Drink Tea Market Volume (K Tons), by Packaging Type 2024 & 2032
- Figure 77: Asia Pacific US Ready to Drink Tea Market Revenue Share (%), by Packaging Type 2024 & 2032
- Figure 78: Asia Pacific US Ready to Drink Tea Market Volume Share (%), by Packaging Type 2024 & 2032
- Figure 79: Asia Pacific US Ready to Drink Tea Market Revenue (Million), by Distribution Channel 2024 & 2032
- Figure 80: Asia Pacific US Ready to Drink Tea Market Volume (K Tons), by Distribution Channel 2024 & 2032
- Figure 81: Asia Pacific US Ready to Drink Tea Market Revenue Share (%), by Distribution Channel 2024 & 2032
- Figure 82: Asia Pacific US Ready to Drink Tea Market Volume Share (%), by Distribution Channel 2024 & 2032
- Figure 83: Asia Pacific US Ready to Drink Tea Market Revenue (Million), by Country 2024 & 2032
- Figure 84: Asia Pacific US Ready to Drink Tea Market Volume (K Tons), by Country 2024 & 2032
- Figure 85: Asia Pacific US Ready to Drink Tea Market Revenue Share (%), by Country 2024 & 2032
- Figure 86: Asia Pacific US Ready to Drink Tea Market Volume Share (%), by Country 2024 & 2032
List of Tables
- Table 1: Global US Ready to Drink Tea Market Revenue Million Forecast, by Region 2019 & 2032
- Table 2: Global US Ready to Drink Tea Market Volume K Tons Forecast, by Region 2019 & 2032
- Table 3: Global US Ready to Drink Tea Market Revenue Million Forecast, by Soft Drink Type 2019 & 2032
- Table 4: Global US Ready to Drink Tea Market Volume K Tons Forecast, by Soft Drink Type 2019 & 2032
- Table 5: Global US Ready to Drink Tea Market Revenue Million Forecast, by Packaging Type 2019 & 2032
- Table 6: Global US Ready to Drink Tea Market Volume K Tons Forecast, by Packaging Type 2019 & 2032
- Table 7: Global US Ready to Drink Tea Market Revenue Million Forecast, by Distribution Channel 2019 & 2032
- Table 8: Global US Ready to Drink Tea Market Volume K Tons Forecast, by Distribution Channel 2019 & 2032
- Table 9: Global US Ready to Drink Tea Market Revenue Million Forecast, by Region 2019 & 2032
- Table 10: Global US Ready to Drink Tea Market Volume K Tons Forecast, by Region 2019 & 2032
- Table 11: Global US Ready to Drink Tea Market Revenue Million Forecast, by Country 2019 & 2032
- Table 12: Global US Ready to Drink Tea Market Volume K Tons Forecast, by Country 2019 & 2032
- Table 13: Northeast US Ready to Drink Tea Market Revenue (Million) Forecast, by Application 2019 & 2032
- Table 14: Northeast US Ready to Drink Tea Market Volume (K Tons) Forecast, by Application 2019 & 2032
- Table 15: Southeast US Ready to Drink Tea Market Revenue (Million) Forecast, by Application 2019 & 2032
- Table 16: Southeast US Ready to Drink Tea Market Volume (K Tons) Forecast, by Application 2019 & 2032
- Table 17: Midwest US Ready to Drink Tea Market Revenue (Million) Forecast, by Application 2019 & 2032
- Table 18: Midwest US Ready to Drink Tea Market Volume (K Tons) Forecast, by Application 2019 & 2032
- Table 19: Southwest US Ready to Drink Tea Market Revenue (Million) Forecast, by Application 2019 & 2032
- Table 20: Southwest US Ready to Drink Tea Market Volume (K Tons) Forecast, by Application 2019 & 2032
- Table 21: West US Ready to Drink Tea Market Revenue (Million) Forecast, by Application 2019 & 2032
- Table 22: West US Ready to Drink Tea Market Volume (K Tons) Forecast, by Application 2019 & 2032
- Table 23: Global US Ready to Drink Tea Market Revenue Million Forecast, by Soft Drink Type 2019 & 2032
- Table 24: Global US Ready to Drink Tea Market Volume K Tons Forecast, by Soft Drink Type 2019 & 2032
- Table 25: Global US Ready to Drink Tea Market Revenue Million Forecast, by Packaging Type 2019 & 2032
- Table 26: Global US Ready to Drink Tea Market Volume K Tons Forecast, by Packaging Type 2019 & 2032
- Table 27: Global US Ready to Drink Tea Market Revenue Million Forecast, by Distribution Channel 2019 & 2032
- Table 28: Global US Ready to Drink Tea Market Volume K Tons Forecast, by Distribution Channel 2019 & 2032
- Table 29: Global US Ready to Drink Tea Market Revenue Million Forecast, by Country 2019 & 2032
- Table 30: Global US Ready to Drink Tea Market Volume K Tons Forecast, by Country 2019 & 2032
- Table 31: United States US Ready to Drink Tea Market Revenue (Million) Forecast, by Application 2019 & 2032
- Table 32: United States US Ready to Drink Tea Market Volume (K Tons) Forecast, by Application 2019 & 2032
- Table 33: Canada US Ready to Drink Tea Market Revenue (Million) Forecast, by Application 2019 & 2032
- Table 34: Canada US Ready to Drink Tea Market Volume (K Tons) Forecast, by Application 2019 & 2032
- Table 35: Mexico US Ready to Drink Tea Market Revenue (Million) Forecast, by Application 2019 & 2032
- Table 36: Mexico US Ready to Drink Tea Market Volume (K Tons) Forecast, by Application 2019 & 2032
- Table 37: Global US Ready to Drink Tea Market Revenue Million Forecast, by Soft Drink Type 2019 & 2032
- Table 38: Global US Ready to Drink Tea Market Volume K Tons Forecast, by Soft Drink Type 2019 & 2032
- Table 39: Global US Ready to Drink Tea Market Revenue Million Forecast, by Packaging Type 2019 & 2032
- Table 40: Global US Ready to Drink Tea Market Volume K Tons Forecast, by Packaging Type 2019 & 2032
- Table 41: Global US Ready to Drink Tea Market Revenue Million Forecast, by Distribution Channel 2019 & 2032
- Table 42: Global US Ready to Drink Tea Market Volume K Tons Forecast, by Distribution Channel 2019 & 2032
- Table 43: Global US Ready to Drink Tea Market Revenue Million Forecast, by Country 2019 & 2032
- Table 44: Global US Ready to Drink Tea Market Volume K Tons Forecast, by Country 2019 & 2032
- Table 45: Brazil US Ready to Drink Tea Market Revenue (Million) Forecast, by Application 2019 & 2032
- Table 46: Brazil US Ready to Drink Tea Market Volume (K Tons) Forecast, by Application 2019 & 2032
- Table 47: Argentina US Ready to Drink Tea Market Revenue (Million) Forecast, by Application 2019 & 2032
- Table 48: Argentina US Ready to Drink Tea Market Volume (K Tons) Forecast, by Application 2019 & 2032
- Table 49: Rest of South America US Ready to Drink Tea Market Revenue (Million) Forecast, by Application 2019 & 2032
- Table 50: Rest of South America US Ready to Drink Tea Market Volume (K Tons) Forecast, by Application 2019 & 2032
- Table 51: Global US Ready to Drink Tea Market Revenue Million Forecast, by Soft Drink Type 2019 & 2032
- Table 52: Global US Ready to Drink Tea Market Volume K Tons Forecast, by Soft Drink Type 2019 & 2032
- Table 53: Global US Ready to Drink Tea Market Revenue Million Forecast, by Packaging Type 2019 & 2032
- Table 54: Global US Ready to Drink Tea Market Volume K Tons Forecast, by Packaging Type 2019 & 2032
- Table 55: Global US Ready to Drink Tea Market Revenue Million Forecast, by Distribution Channel 2019 & 2032
- Table 56: Global US Ready to Drink Tea Market Volume K Tons Forecast, by Distribution Channel 2019 & 2032
- Table 57: Global US Ready to Drink Tea Market Revenue Million Forecast, by Country 2019 & 2032
- Table 58: Global US Ready to Drink Tea Market Volume K Tons Forecast, by Country 2019 & 2032
- Table 59: United Kingdom US Ready to Drink Tea Market Revenue (Million) Forecast, by Application 2019 & 2032
- Table 60: United Kingdom US Ready to Drink Tea Market Volume (K Tons) Forecast, by Application 2019 & 2032
- Table 61: Germany US Ready to Drink Tea Market Revenue (Million) Forecast, by Application 2019 & 2032
- Table 62: Germany US Ready to Drink Tea Market Volume (K Tons) Forecast, by Application 2019 & 2032
- Table 63: France US Ready to Drink Tea Market Revenue (Million) Forecast, by Application 2019 & 2032
- Table 64: France US Ready to Drink Tea Market Volume (K Tons) Forecast, by Application 2019 & 2032
- Table 65: Italy US Ready to Drink Tea Market Revenue (Million) Forecast, by Application 2019 & 2032
- Table 66: Italy US Ready to Drink Tea Market Volume (K Tons) Forecast, by Application 2019 & 2032
- Table 67: Spain US Ready to Drink Tea Market Revenue (Million) Forecast, by Application 2019 & 2032
- Table 68: Spain US Ready to Drink Tea Market Volume (K Tons) Forecast, by Application 2019 & 2032
- Table 69: Russia US Ready to Drink Tea Market Revenue (Million) Forecast, by Application 2019 & 2032
- Table 70: Russia US Ready to Drink Tea Market Volume (K Tons) Forecast, by Application 2019 & 2032
- Table 71: Benelux US Ready to Drink Tea Market Revenue (Million) Forecast, by Application 2019 & 2032
- Table 72: Benelux US Ready to Drink Tea Market Volume (K Tons) Forecast, by Application 2019 & 2032
- Table 73: Nordics US Ready to Drink Tea Market Revenue (Million) Forecast, by Application 2019 & 2032
- Table 74: Nordics US Ready to Drink Tea Market Volume (K Tons) Forecast, by Application 2019 & 2032
- Table 75: Rest of Europe US Ready to Drink Tea Market Revenue (Million) Forecast, by Application 2019 & 2032
- Table 76: Rest of Europe US Ready to Drink Tea Market Volume (K Tons) Forecast, by Application 2019 & 2032
- Table 77: Global US Ready to Drink Tea Market Revenue Million Forecast, by Soft Drink Type 2019 & 2032
- Table 78: Global US Ready to Drink Tea Market Volume K Tons Forecast, by Soft Drink Type 2019 & 2032
- Table 79: Global US Ready to Drink Tea Market Revenue Million Forecast, by Packaging Type 2019 & 2032
- Table 80: Global US Ready to Drink Tea Market Volume K Tons Forecast, by Packaging Type 2019 & 2032
- Table 81: Global US Ready to Drink Tea Market Revenue Million Forecast, by Distribution Channel 2019 & 2032
- Table 82: Global US Ready to Drink Tea Market Volume K Tons Forecast, by Distribution Channel 2019 & 2032
- Table 83: Global US Ready to Drink Tea Market Revenue Million Forecast, by Country 2019 & 2032
- Table 84: Global US Ready to Drink Tea Market Volume K Tons Forecast, by Country 2019 & 2032
- Table 85: Turkey US Ready to Drink Tea Market Revenue (Million) Forecast, by Application 2019 & 2032
- Table 86: Turkey US Ready to Drink Tea Market Volume (K Tons) Forecast, by Application 2019 & 2032
- Table 87: Israel US Ready to Drink Tea Market Revenue (Million) Forecast, by Application 2019 & 2032
- Table 88: Israel US Ready to Drink Tea Market Volume (K Tons) Forecast, by Application 2019 & 2032
- Table 89: GCC US Ready to Drink Tea Market Revenue (Million) Forecast, by Application 2019 & 2032
- Table 90: GCC US Ready to Drink Tea Market Volume (K Tons) Forecast, by Application 2019 & 2032
- Table 91: North Africa US Ready to Drink Tea Market Revenue (Million) Forecast, by Application 2019 & 2032
- Table 92: North Africa US Ready to Drink Tea Market Volume (K Tons) Forecast, by Application 2019 & 2032
- Table 93: South Africa US Ready to Drink Tea Market Revenue (Million) Forecast, by Application 2019 & 2032
- Table 94: South Africa US Ready to Drink Tea Market Volume (K Tons) Forecast, by Application 2019 & 2032
- Table 95: Rest of Middle East & Africa US Ready to Drink Tea Market Revenue (Million) Forecast, by Application 2019 & 2032
- Table 96: Rest of Middle East & Africa US Ready to Drink Tea Market Volume (K Tons) Forecast, by Application 2019 & 2032
- Table 97: Global US Ready to Drink Tea Market Revenue Million Forecast, by Soft Drink Type 2019 & 2032
- Table 98: Global US Ready to Drink Tea Market Volume K Tons Forecast, by Soft Drink Type 2019 & 2032
- Table 99: Global US Ready to Drink Tea Market Revenue Million Forecast, by Packaging Type 2019 & 2032
- Table 100: Global US Ready to Drink Tea Market Volume K Tons Forecast, by Packaging Type 2019 & 2032
- Table 101: Global US Ready to Drink Tea Market Revenue Million Forecast, by Distribution Channel 2019 & 2032
- Table 102: Global US Ready to Drink Tea Market Volume K Tons Forecast, by Distribution Channel 2019 & 2032
- Table 103: Global US Ready to Drink Tea Market Revenue Million Forecast, by Country 2019 & 2032
- Table 104: Global US Ready to Drink Tea Market Volume K Tons Forecast, by Country 2019 & 2032
- Table 105: China US Ready to Drink Tea Market Revenue (Million) Forecast, by Application 2019 & 2032
- Table 106: China US Ready to Drink Tea Market Volume (K Tons) Forecast, by Application 2019 & 2032
- Table 107: India US Ready to Drink Tea Market Revenue (Million) Forecast, by Application 2019 & 2032
- Table 108: India US Ready to Drink Tea Market Volume (K Tons) Forecast, by Application 2019 & 2032
- Table 109: Japan US Ready to Drink Tea Market Revenue (Million) Forecast, by Application 2019 & 2032
- Table 110: Japan US Ready to Drink Tea Market Volume (K Tons) Forecast, by Application 2019 & 2032
- Table 111: South Korea US Ready to Drink Tea Market Revenue (Million) Forecast, by Application 2019 & 2032
- Table 112: South Korea US Ready to Drink Tea Market Volume (K Tons) Forecast, by Application 2019 & 2032
- Table 113: ASEAN US Ready to Drink Tea Market Revenue (Million) Forecast, by Application 2019 & 2032
- Table 114: ASEAN US Ready to Drink Tea Market Volume (K Tons) Forecast, by Application 2019 & 2032
- Table 115: Oceania US Ready to Drink Tea Market Revenue (Million) Forecast, by Application 2019 & 2032
- Table 116: Oceania US Ready to Drink Tea Market Volume (K Tons) Forecast, by Application 2019 & 2032
- Table 117: Rest of Asia Pacific US Ready to Drink Tea Market Revenue (Million) Forecast, by Application 2019 & 2032
- Table 118: Rest of Asia Pacific US Ready to Drink Tea Market Volume (K Tons) Forecast, by Application 2019 & 2032
Frequently Asked Questions
1. What is the projected Compound Annual Growth Rate (CAGR) of the US Ready to Drink Tea Market?
The projected CAGR is approximately 1.50%.
2. Which companies are prominent players in the US Ready to Drink Tea Market?
Key companies in the market include Red Diamond Inc, Arizona Beverages USA LLC, Milo’s Tea Company Inc, Nestle S A, Ito En Ltd, PepsiCo Inc, Hawaiian Sun Products Inc, Keurig Dr Pepper Inc, The Coca-Cola Company, Del Monte Foods Inc, Reily Foods Company, Walmart Inc.
3. What are the main segments of the US Ready to Drink Tea Market?
The market segments include Soft Drink Type, Packaging Type, Distribution Channel.
4. Can you provide details about the market size?
The market size is estimated to be USD 34300 Million as of 2022.
5. What are some drivers contributing to market growth?
Increasing demand for meat alternatives.
6. What are the notable trends driving market growth?
OTHER KEY INDUSTRY TRENDS COVERED IN THE REPORT.
7. Are there any restraints impacting market growth?
Presence of numerous alternatives in the plant proteins.
8. Can you provide examples of recent developments in the market?
January 2023: Milo's Tea Company has announced an initial investment of over USD 130 million to construct a new plant and distribution centre in Spartanburg County, South Carolina. This new investment is a direct response to the growth of Milo's brand. Milo expects to start producing its famous tea and lemonade in the fall of 2024.January 2023: Lipton Tea partnered with Full Cart, a program within the nonprofit U.S. Hunger, and a virtual food pantry, to enhance access to heart-friendly nutrition and grocery assistance.December 2022: Pure Leaf rolled out a limited-edition Merry Mint Iced Tea, coinciding with the release of the Christmas movie 'Christmas Class Reunion'. This mint-flavored iced tea was simultaneously launched through a social media giveaway, enhancing the movie-watching experience for consumers.
9. What pricing options are available for accessing the report?
Pricing options include single-user, multi-user, and enterprise licenses priced at USD 3800, USD 4500, and USD 5800 respectively.
10. Is the market size provided in terms of value or volume?
The market size is provided in terms of value, measured in Million and volume, measured in K Tons.
11. Are there any specific market keywords associated with the report?
Yes, the market keyword associated with the report is "US Ready to Drink Tea Market," which aids in identifying and referencing the specific market segment covered.
12. How do I determine which pricing option suits my needs best?
The pricing options vary based on user requirements and access needs. Individual users may opt for single-user licenses, while businesses requiring broader access may choose multi-user or enterprise licenses for cost-effective access to the report.
13. Are there any additional resources or data provided in the US Ready to Drink Tea Market report?
While the report offers comprehensive insights, it's advisable to review the specific contents or supplementary materials provided to ascertain if additional resources or data are available.
14. How can I stay updated on further developments or reports in the US Ready to Drink Tea Market?
To stay informed about further developments, trends, and reports in the US Ready to Drink Tea Market, consider subscribing to industry newsletters, following relevant companies and organizations, or regularly checking reputable industry news sources and publications.
Methodology
Step 1 - Identification of Relevant Samples Size from Population Database


Step 2 - Approaches for Defining Global Market Size (Value, Volume* & Price*)

Note*: In applicable scenarios
Step 3 - Data Sources
Primary Research
- Web Analytics
- Survey Reports
- Research Institute
- Latest Research Reports
- Opinion Leaders
Secondary Research
- Annual Reports
- White Paper
- Latest Press Release
- Industry Association
- Paid Database
- Investor Presentations

Step 4 - Data Triangulation
Involves using different sources of information in order to increase the validity of a study
These sources are likely to be stakeholders in a program - participants, other researchers, program staff, other community members, and so on.
Then we put all data in single framework & apply various statistical tools to find out the dynamic on the market.
During the analysis stage, feedback from the stakeholder groups would be compared to determine areas of agreement as well as areas of divergence
