

Key Insights
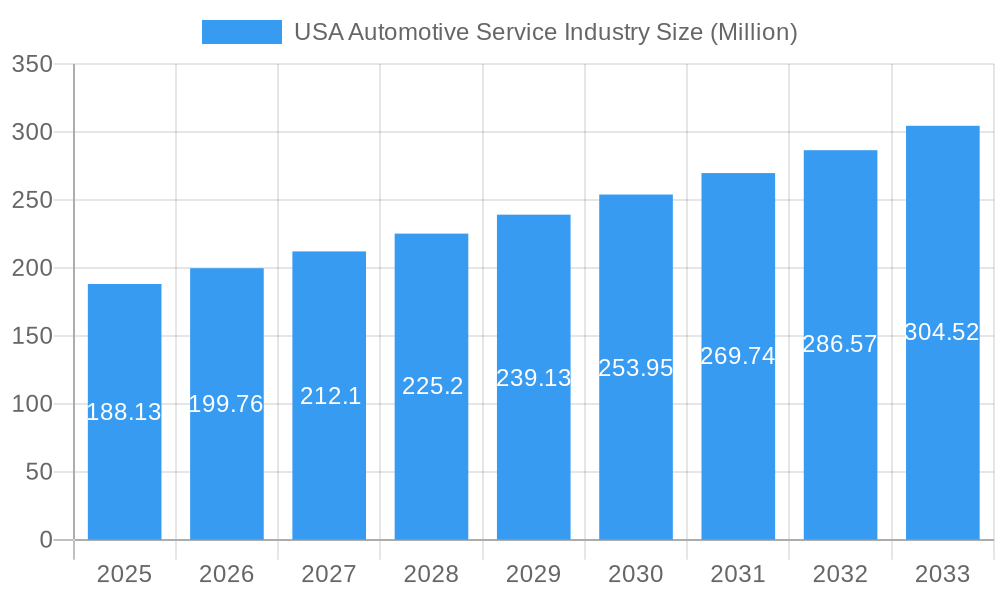
The US automotive service industry, valued at $188.13 million in 2025, is projected to experience robust growth, driven by a rising number of vehicles on the road, increasing vehicle complexity demanding specialized services, and a growing preference for preventative maintenance. The industry's Compound Annual Growth Rate (CAGR) of 5.98% from 2019 to 2025 indicates a steady upward trajectory, promising significant expansion through 2033. Key service segments include mechanical repairs, exterior and structural work, and electrical and electronics servicing, catering to diverse vehicle types such as passenger cars and commercial vehicles. Popular equipment-specific services center around tires, seats, batteries, and other vehicle components. Major players like Midas, Meineke, Pep Boys, Firestone, Safelite, Monro, Jiffy Lube, and even Walmart, highlight the industry's competitive landscape and broad accessibility. Regional variations exist, with potential for higher growth in regions experiencing faster economic expansion and higher vehicle ownership rates. Factors such as technological advancements (e.g., electric vehicle maintenance), evolving consumer preferences (e.g., subscription-based maintenance plans), and the impact of supply chain disruptions will likely influence the industry's trajectory in the coming years.
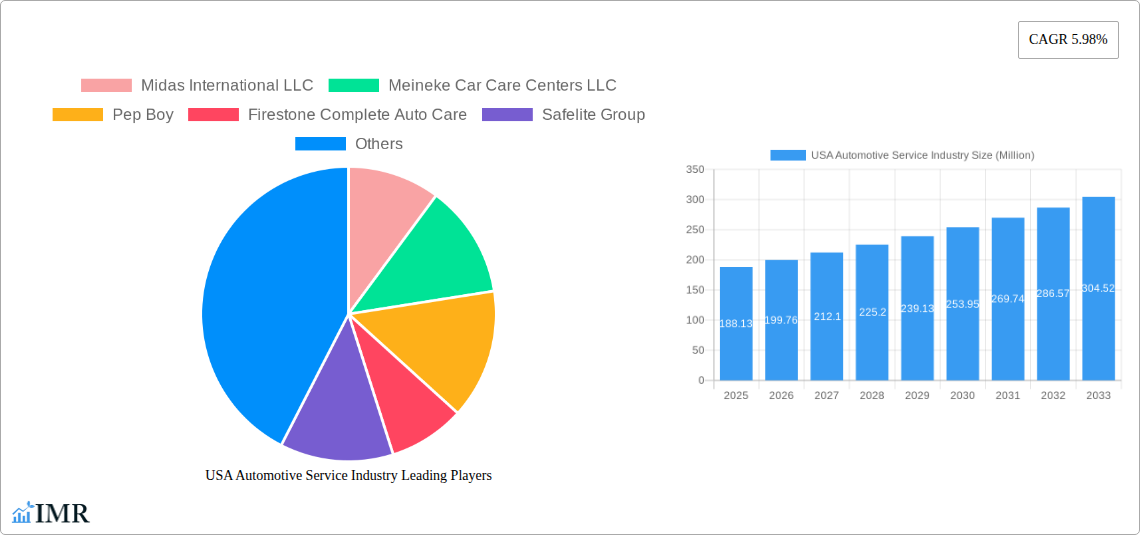
USA Automotive Service Industry Market Size (In Million)
Continued growth is anticipated through 2033, fuelled by factors such as the increasing age of the existing vehicle fleet, leading to higher maintenance needs, and the introduction of advanced driver-assistance systems (ADAS) requiring specialized repair expertise. The industry is likely to see further consolidation as larger players acquire smaller chains, enhancing their market reach and service offerings. The competitive landscape is characterized by both national chains and independent garages, each catering to different customer segments and service needs. The focus on providing efficient and cost-effective services will remain crucial for success, alongside investments in technology and skilled technicians to meet the demands of increasingly sophisticated vehicles. Furthermore, environmental concerns are driving growth in services related to electric vehicle maintenance and repair, creating new opportunities within the market.
USA Automotive Service Industry Company Market Share
USA Automotive Service Industry Market Report: 2019-2033
This comprehensive report provides a detailed analysis of the USA Automotive Service Industry, encompassing market dynamics, growth trends, competitive landscape, and future outlook. With a study period spanning 2019-2033, a base year of 2025, and a forecast period of 2025-2033, this report is an invaluable resource for industry professionals, investors, and strategic decision-makers. The report leverages extensive primary and secondary research to deliver actionable insights across key market segments, including parent markets (Automotive Repair & Maintenance) and child markets (e.g., Tire Services, Auto Electrical Repair). Market values are presented in Million USD.
USA Automotive Service Industry Market Dynamics & Structure
The US automotive service industry is a highly fragmented market, characterized by a mix of large national chains and numerous independent repair shops. Market concentration is relatively low, with the top five players holding approximately xx% market share in 2024. Technological innovation, driven by advancements in vehicle technology and diagnostic tools, is a key driver of market growth. Stringent regulatory frameworks, including emissions standards and safety regulations, impact operational costs and service offerings. Competitive product substitutes, such as DIY repair solutions and mobile repair services, are gaining traction, particularly among younger demographics. End-user demographics show a growing demand for convenient and reliable service options, with a shift towards online booking and transparent pricing. The industry has witnessed significant M&A activity in recent years, with a total of xx deals valued at xx million USD recorded between 2019 and 2024.
- Market Concentration: Top 5 players hold approximately xx% market share (2024).
- Technological Innovation: Advancements in diagnostic tools and repair techniques are key drivers.
- Regulatory Framework: Stringent emissions and safety regulations influence operational costs.
- Competitive Substitutes: DIY repairs and mobile service options are increasing in popularity.
- End-User Demographics: Demand for convenient and transparent services is growing.
- M&A Activity: xx deals totaling xx million USD (2019-2024).
USA Automotive Service Industry Growth Trends & Insights
The US automotive service market exhibited a CAGR of xx% during the historical period (2019-2024), reaching a market size of xx million USD in 2024. This growth is attributed to several factors, including the increasing age of the vehicle fleet, rising consumer disposable income, and technological advancements leading to more complex vehicle systems requiring specialized service. The adoption rate of advanced driver-assistance systems (ADAS) and electric vehicles (EVs) is also influencing service demand, creating opportunities for specialized repair and maintenance services. Changing consumer behaviors, such as increased reliance on online reviews and appointment scheduling, are reshaping the industry landscape. The forecast period (2025-2033) anticipates a CAGR of xx%, driven by the continued growth of the vehicle fleet and increasing consumer preference for professional maintenance. Market penetration for specialized services like EV repair is expected to increase significantly during this period.
Dominant Regions, Countries, or Segments in USA Automotive Service Industry
The passenger car segment dominates the market, accounting for approximately xx% of total revenue in 2024, followed by the mechanical services segment which holds approximately xx% of the market share. Growth is geographically concentrated in high-population density areas and regions with a larger proportion of older vehicles. The South and West regions are experiencing robust growth due to factors like higher vehicle ownership, warmer climates leading to increased tire and battery replacement needs, and a large population of aging vehicles.
- Key Drivers: High vehicle ownership, aging vehicle fleet, increasing disposable income, regional economic growth.
- Dominance Factors: High vehicle density, aging vehicle fleet, presence of major automotive manufacturers/dealers.
- Growth Potential: Expansion of EV infrastructure and adoption, increasing demand for specialized services.
USA Automotive Service Industry Product Landscape
The product landscape is diverse, encompassing a wide range of services and products, including routine maintenance (oil changes, tire rotations), major repairs (engine repair, transmission repair), and specialized services (EV maintenance, ADAS calibration). Innovation focuses on enhancing diagnostic capabilities, improving repair efficiency, and providing value-added services, such as mobile repair options and subscription-based maintenance programs. The unique selling propositions of service providers center around specialization, speed, convenience, and customer service. Technological advancements such as telematics, AI-powered diagnostic systems, and augmented reality for repair guidance are transforming the industry.
Key Drivers, Barriers & Challenges in USA Automotive Service Industry
Key Drivers: Increasing vehicle age, rising consumer disposable income, technological advancements in vehicle systems, and growing demand for specialized services for EVs and ADAS are driving market growth.
Challenges: Supply chain disruptions, skilled labor shortages impacting service availability and increasing costs, intense competition from both large national chains and independent shops, and regulatory compliance complexities are significant market challenges. The impact of these factors is estimated to decrease the overall market growth by approximately xx% in 2025 compared to the projected growth without these headwinds.
Emerging Opportunities in USA Automotive Service Industry
Emerging opportunities include the growing market for EV repair and maintenance, the increasing demand for mobile repair services, and the adoption of subscription-based maintenance programs. Untapped markets include specialized services for luxury vehicles and classic cars. Evolving consumer preferences towards convenient and transparent pricing models present further opportunities for innovation.
Growth Accelerators in the USA Automotive Service Industry
Technological breakthroughs in diagnostics and repair techniques, strategic partnerships between service providers and automotive manufacturers, expansion into new geographic markets, and the development of specialized service offerings for emerging vehicle technologies (e.g., EVs) are key growth catalysts for the industry.
Key Players Shaping the USA Automotive Service Industry Market
Notable Milestones in USA Automotive Service Industry Sector
- December 2022: AutoNation Inc. acquires RepairSmith, expanding mobile repair services.
- May 2022: American Tire Distributors acquires Monro Inc.'s Tires Now wholesale assets.
- March 2022: Monro Inc. acquires Mountain View Tire & Service Inc., expanding its western presence.
In-Depth USA Automotive Service Industry Market Outlook
The US automotive service market is poised for continued growth, driven by technological advancements, increasing vehicle complexity, and the growing demand for specialized services. Strategic opportunities exist for companies that can effectively leverage technology to improve efficiency, enhance customer experience, and offer specialized services for emerging vehicle technologies. The market is expected to witness further consolidation through mergers and acquisitions, leading to a more concentrated landscape in the long term. The potential for expansion into underserved markets and the development of innovative service models will further shape the future of the industry.
USA Automotive Service Industry Segmentation
-
1. Vehicle Type
- 1.1. Passenger Cars
- 1.2. Commercial Vehicles
-
2. Service Type
- 2.1. Mechanical
- 2.2. Exterior and Structural
- 2.3. Electrical and Electronics
-
3. Equipment Type
- 3.1. Tires
- 3.2. Seats
- 3.3. Batteries
- 3.4. Other Equipment Types
USA Automotive Service Industry Segmentation By Geography
-
1. North America
- 1.1. United States
- 1.2. Canada
- 1.3. Mexico
-
2. South America
- 2.1. Brazil
- 2.2. Argentina
- 2.3. Rest of South America
-
3. Europe
- 3.1. United Kingdom
- 3.2. Germany
- 3.3. France
- 3.4. Italy
- 3.5. Spain
- 3.6. Russia
- 3.7. Benelux
- 3.8. Nordics
- 3.9. Rest of Europe
-
4. Middle East & Africa
- 4.1. Turkey
- 4.2. Israel
- 4.3. GCC
- 4.4. North Africa
- 4.5. South Africa
- 4.6. Rest of Middle East & Africa
-
5. Asia Pacific
- 5.1. China
- 5.2. India
- 5.3. Japan
- 5.4. South Korea
- 5.5. ASEAN
- 5.6. Oceania
- 5.7. Rest of Asia Pacific
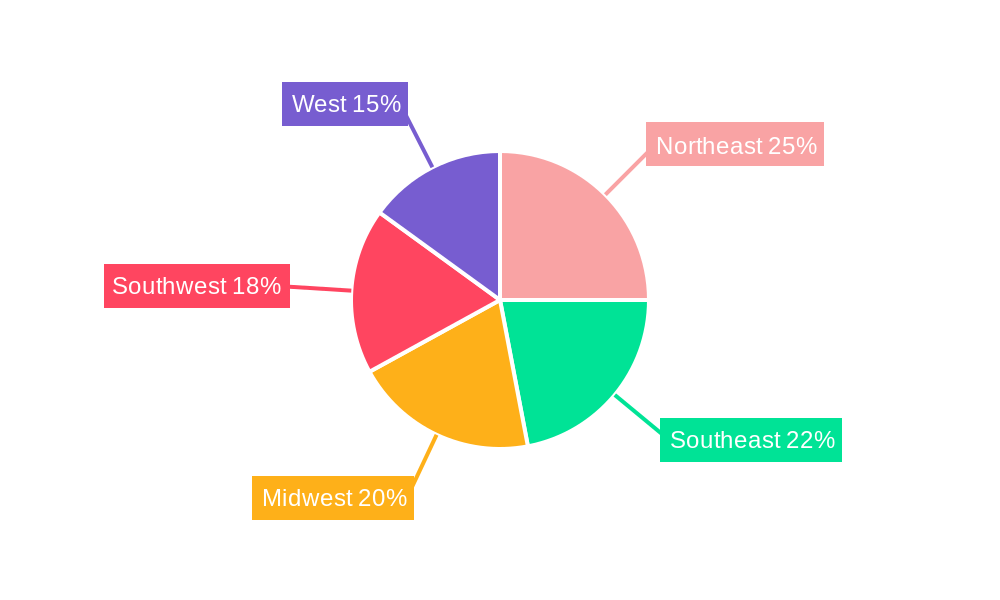
USA Automotive Service Industry Regional Market Share
Geographic Coverage of USA Automotive Service Industry
USA Automotive Service Industry REPORT HIGHLIGHTS
| Aspects | Details |
|---|---|
| Study Period | 2020-2034 |
| Base Year | 2025 |
| Estimated Year | 2026 |
| Forecast Period | 2026-2034 |
| Historical Period | 2020-2025 |
| Growth Rate | CAGR of 5.98% from 2020-2034 |
| Segmentation |
|
Table of Contents
- 1. Introduction
- 1.1. Research Scope
- 1.2. Market Segmentation
- 1.3. Research Objective
- 1.4. Definitions and Assumptions
- 2. Executive Summary
- 2.1. Market Snapshot
- 3. Market Dynamics
- 3.1. Market Drivers
- 3.2. Market Restrains
- 3.3. Market Trends
- 3.4. Market Opportunities
- 4. Market Factor Analysis
- 4.1. Porters Five Forces
- 4.1.1. Bargaining Power of Suppliers
- 4.1.2. Bargaining Power of Buyers
- 4.1.3. Threat of New Entrants
- 4.1.4. Threat of Substitutes
- 4.1.5. Competitive Rivalry
- 4.2. PESTEL analysis
- 4.3. BCG Analysis
- 4.3.1. Stars (High Growth, High Market Share)
- 4.3.2. Cash Cows (Low Growth, High Market Share)
- 4.3.3. Question Mark (High Growth, Low Market Share)
- 4.3.4. Dogs (Low Growth, Low Market Share)
- 4.4. Ansoff Matrix Analysis
- 4.5. Supply Chain Analysis
- 4.6. Regulatory Landscape
- 4.7. Current Market Potential and Opportunity Assessment (TAM–SAM–SOM Framework)
- 4.8. IMR Analyst Note
- 4.1. Porters Five Forces
- 5. Market Analysis, Insights and Forecast 2021-2033
- 5.1. Market Analysis, Insights and Forecast - by Vehicle Type
- 5.1.1. Passenger Cars
- 5.1.2. Commercial Vehicles
- 5.2. Market Analysis, Insights and Forecast - by Service Type
- 5.2.1. Mechanical
- 5.2.2. Exterior and Structural
- 5.2.3. Electrical and Electronics
- 5.3. Market Analysis, Insights and Forecast - by Equipment Type
- 5.3.1. Tires
- 5.3.2. Seats
- 5.3.3. Batteries
- 5.3.4. Other Equipment Types
- 5.4. Market Analysis, Insights and Forecast - by Region
- 5.4.1. North America
- 5.4.2. South America
- 5.4.3. Europe
- 5.4.4. Middle East & Africa
- 5.4.5. Asia Pacific
- 5.1. Market Analysis, Insights and Forecast - by Vehicle Type
- 6. Global USA Automotive Service Industry Analysis, Insights and Forecast, 2021-2033
- 6.1. Market Analysis, Insights and Forecast - by Vehicle Type
- 6.1.1. Passenger Cars
- 6.1.2. Commercial Vehicles
- 6.2. Market Analysis, Insights and Forecast - by Service Type
- 6.2.1. Mechanical
- 6.2.2. Exterior and Structural
- 6.2.3. Electrical and Electronics
- 6.3. Market Analysis, Insights and Forecast - by Equipment Type
- 6.3.1. Tires
- 6.3.2. Seats
- 6.3.3. Batteries
- 6.3.4. Other Equipment Types
- 6.1. Market Analysis, Insights and Forecast - by Vehicle Type
- 7. North America USA Automotive Service Industry Analysis, Insights and Forecast, 2020-2032
- 7.1. Market Analysis, Insights and Forecast - by Vehicle Type
- 7.1.1. Passenger Cars
- 7.1.2. Commercial Vehicles
- 7.2. Market Analysis, Insights and Forecast - by Service Type
- 7.2.1. Mechanical
- 7.2.2. Exterior and Structural
- 7.2.3. Electrical and Electronics
- 7.3. Market Analysis, Insights and Forecast - by Equipment Type
- 7.3.1. Tires
- 7.3.2. Seats
- 7.3.3. Batteries
- 7.3.4. Other Equipment Types
- 7.1. Market Analysis, Insights and Forecast - by Vehicle Type
- 8. South America USA Automotive Service Industry Analysis, Insights and Forecast, 2020-2032
- 8.1. Market Analysis, Insights and Forecast - by Vehicle Type
- 8.1.1. Passenger Cars
- 8.1.2. Commercial Vehicles
- 8.2. Market Analysis, Insights and Forecast - by Service Type
- 8.2.1. Mechanical
- 8.2.2. Exterior and Structural
- 8.2.3. Electrical and Electronics
- 8.3. Market Analysis, Insights and Forecast - by Equipment Type
- 8.3.1. Tires
- 8.3.2. Seats
- 8.3.3. Batteries
- 8.3.4. Other Equipment Types
- 8.1. Market Analysis, Insights and Forecast - by Vehicle Type
- 9. Europe USA Automotive Service Industry Analysis, Insights and Forecast, 2020-2032
- 9.1. Market Analysis, Insights and Forecast - by Vehicle Type
- 9.1.1. Passenger Cars
- 9.1.2. Commercial Vehicles
- 9.2. Market Analysis, Insights and Forecast - by Service Type
- 9.2.1. Mechanical
- 9.2.2. Exterior and Structural
- 9.2.3. Electrical and Electronics
- 9.3. Market Analysis, Insights and Forecast - by Equipment Type
- 9.3.1. Tires
- 9.3.2. Seats
- 9.3.3. Batteries
- 9.3.4. Other Equipment Types
- 9.1. Market Analysis, Insights and Forecast - by Vehicle Type
- 10. Middle East & Africa USA Automotive Service Industry Analysis, Insights and Forecast, 2020-2032
- 10.1. Market Analysis, Insights and Forecast - by Vehicle Type
- 10.1.1. Passenger Cars
- 10.1.2. Commercial Vehicles
- 10.2. Market Analysis, Insights and Forecast - by Service Type
- 10.2.1. Mechanical
- 10.2.2. Exterior and Structural
- 10.2.3. Electrical and Electronics
- 10.3. Market Analysis, Insights and Forecast - by Equipment Type
- 10.3.1. Tires
- 10.3.2. Seats
- 10.3.3. Batteries
- 10.3.4. Other Equipment Types
- 10.1. Market Analysis, Insights and Forecast - by Vehicle Type
- 11. Asia Pacific USA Automotive Service Industry Analysis, Insights and Forecast, 2020-2032
- 11.1. Market Analysis, Insights and Forecast - by Vehicle Type
- 11.1.1. Passenger Cars
- 11.1.2. Commercial Vehicles
- 11.2. Market Analysis, Insights and Forecast - by Service Type
- 11.2.1. Mechanical
- 11.2.2. Exterior and Structural
- 11.2.3. Electrical and Electronics
- 11.3. Market Analysis, Insights and Forecast - by Equipment Type
- 11.3.1. Tires
- 11.3.2. Seats
- 11.3.3. Batteries
- 11.3.4. Other Equipment Types
- 11.1. Market Analysis, Insights and Forecast - by Vehicle Type
- 12. Competitive Analysis
- 12.1. Company Profiles
- 12.1.1 Midas International LLC
- 12.1.1.1. Company Overview
- 12.1.1.2. Products
- 12.1.1.3. Company Financials
- 12.1.1.4. SWOT Analysis
- 12.1.2 Meineke Car Care Centers LLC
- 12.1.2.1. Company Overview
- 12.1.2.2. Products
- 12.1.2.3. Company Financials
- 12.1.2.4. SWOT Analysis
- 12.1.3 Pep Boy
- 12.1.3.1. Company Overview
- 12.1.3.2. Products
- 12.1.3.3. Company Financials
- 12.1.3.4. SWOT Analysis
- 12.1.4 Firestone Complete Auto Care
- 12.1.4.1. Company Overview
- 12.1.4.2. Products
- 12.1.4.3. Company Financials
- 12.1.4.4. SWOT Analysis
- 12.1.5 Safelite Group
- 12.1.5.1. Company Overview
- 12.1.5.2. Products
- 12.1.5.3. Company Financials
- 12.1.5.4. SWOT Analysis
- 12.1.6 Monro Inc
- 12.1.6.1. Company Overview
- 12.1.6.2. Products
- 12.1.6.3. Company Financials
- 12.1.6.4. SWOT Analysis
- 12.1.7 Jiffy Lube International Inc
- 12.1.7.1. Company Overview
- 12.1.7.2. Products
- 12.1.7.3. Company Financials
- 12.1.7.4. SWOT Analysis
- 12.1.8 Walmart Inc
- 12.1.8.1. Company Overview
- 12.1.8.2. Products
- 12.1.8.3. Company Financials
- 12.1.8.4. SWOT Analysis
- 12.1.1 Midas International LLC
- 12.2. Market Entropy
- 12.2.1 Company's Key Areas Served
- 12.2.2 Recent Developments
- 12.3. Company Market Share Analysis 2025
- 12.3.1 Top 5 Companies Market Share Analysis
- 12.3.2 Top 3 Companies Market Share Analysis
- 12.4. List of Potential Customers
- 13. Research Methodology
List of Figures
- Figure 1: Global USA Automotive Service Industry Revenue Breakdown (Million, %) by Region 2025 & 2033
- Figure 2: North America USA Automotive Service Industry Revenue (Million), by Vehicle Type 2025 & 2033
- Figure 3: North America USA Automotive Service Industry Revenue Share (%), by Vehicle Type 2025 & 2033
- Figure 4: North America USA Automotive Service Industry Revenue (Million), by Service Type 2025 & 2033
- Figure 5: North America USA Automotive Service Industry Revenue Share (%), by Service Type 2025 & 2033
- Figure 6: North America USA Automotive Service Industry Revenue (Million), by Equipment Type 2025 & 2033
- Figure 7: North America USA Automotive Service Industry Revenue Share (%), by Equipment Type 2025 & 2033
- Figure 8: North America USA Automotive Service Industry Revenue (Million), by Country 2025 & 2033
- Figure 9: North America USA Automotive Service Industry Revenue Share (%), by Country 2025 & 2033
- Figure 10: South America USA Automotive Service Industry Revenue (Million), by Vehicle Type 2025 & 2033
- Figure 11: South America USA Automotive Service Industry Revenue Share (%), by Vehicle Type 2025 & 2033
- Figure 12: South America USA Automotive Service Industry Revenue (Million), by Service Type 2025 & 2033
- Figure 13: South America USA Automotive Service Industry Revenue Share (%), by Service Type 2025 & 2033
- Figure 14: South America USA Automotive Service Industry Revenue (Million), by Equipment Type 2025 & 2033
- Figure 15: South America USA Automotive Service Industry Revenue Share (%), by Equipment Type 2025 & 2033
- Figure 16: South America USA Automotive Service Industry Revenue (Million), by Country 2025 & 2033
- Figure 17: South America USA Automotive Service Industry Revenue Share (%), by Country 2025 & 2033
- Figure 18: Europe USA Automotive Service Industry Revenue (Million), by Vehicle Type 2025 & 2033
- Figure 19: Europe USA Automotive Service Industry Revenue Share (%), by Vehicle Type 2025 & 2033
- Figure 20: Europe USA Automotive Service Industry Revenue (Million), by Service Type 2025 & 2033
- Figure 21: Europe USA Automotive Service Industry Revenue Share (%), by Service Type 2025 & 2033
- Figure 22: Europe USA Automotive Service Industry Revenue (Million), by Equipment Type 2025 & 2033
- Figure 23: Europe USA Automotive Service Industry Revenue Share (%), by Equipment Type 2025 & 2033
- Figure 24: Europe USA Automotive Service Industry Revenue (Million), by Country 2025 & 2033
- Figure 25: Europe USA Automotive Service Industry Revenue Share (%), by Country 2025 & 2033
- Figure 26: Middle East & Africa USA Automotive Service Industry Revenue (Million), by Vehicle Type 2025 & 2033
- Figure 27: Middle East & Africa USA Automotive Service Industry Revenue Share (%), by Vehicle Type 2025 & 2033
- Figure 28: Middle East & Africa USA Automotive Service Industry Revenue (Million), by Service Type 2025 & 2033
- Figure 29: Middle East & Africa USA Automotive Service Industry Revenue Share (%), by Service Type 2025 & 2033
- Figure 30: Middle East & Africa USA Automotive Service Industry Revenue (Million), by Equipment Type 2025 & 2033
- Figure 31: Middle East & Africa USA Automotive Service Industry Revenue Share (%), by Equipment Type 2025 & 2033
- Figure 32: Middle East & Africa USA Automotive Service Industry Revenue (Million), by Country 2025 & 2033
- Figure 33: Middle East & Africa USA Automotive Service Industry Revenue Share (%), by Country 2025 & 2033
- Figure 34: Asia Pacific USA Automotive Service Industry Revenue (Million), by Vehicle Type 2025 & 2033
- Figure 35: Asia Pacific USA Automotive Service Industry Revenue Share (%), by Vehicle Type 2025 & 2033
- Figure 36: Asia Pacific USA Automotive Service Industry Revenue (Million), by Service Type 2025 & 2033
- Figure 37: Asia Pacific USA Automotive Service Industry Revenue Share (%), by Service Type 2025 & 2033
- Figure 38: Asia Pacific USA Automotive Service Industry Revenue (Million), by Equipment Type 2025 & 2033
- Figure 39: Asia Pacific USA Automotive Service Industry Revenue Share (%), by Equipment Type 2025 & 2033
- Figure 40: Asia Pacific USA Automotive Service Industry Revenue (Million), by Country 2025 & 2033
- Figure 41: Asia Pacific USA Automotive Service Industry Revenue Share (%), by Country 2025 & 2033
List of Tables
- Table 1: Global USA Automotive Service Industry Revenue Million Forecast, by Vehicle Type 2020 & 2033
- Table 2: Global USA Automotive Service Industry Revenue Million Forecast, by Service Type 2020 & 2033
- Table 3: Global USA Automotive Service Industry Revenue Million Forecast, by Equipment Type 2020 & 2033
- Table 4: Global USA Automotive Service Industry Revenue Million Forecast, by Region 2020 & 2033
- Table 5: Global USA Automotive Service Industry Revenue Million Forecast, by Vehicle Type 2020 & 2033
- Table 6: Global USA Automotive Service Industry Revenue Million Forecast, by Service Type 2020 & 2033
- Table 7: Global USA Automotive Service Industry Revenue Million Forecast, by Equipment Type 2020 & 2033
- Table 8: Global USA Automotive Service Industry Revenue Million Forecast, by Country 2020 & 2033
- Table 9: United States USA Automotive Service Industry Revenue (Million) Forecast, by Application 2020 & 2033
- Table 10: Canada USA Automotive Service Industry Revenue (Million) Forecast, by Application 2020 & 2033
- Table 11: Mexico USA Automotive Service Industry Revenue (Million) Forecast, by Application 2020 & 2033
- Table 12: Global USA Automotive Service Industry Revenue Million Forecast, by Vehicle Type 2020 & 2033
- Table 13: Global USA Automotive Service Industry Revenue Million Forecast, by Service Type 2020 & 2033
- Table 14: Global USA Automotive Service Industry Revenue Million Forecast, by Equipment Type 2020 & 2033
- Table 15: Global USA Automotive Service Industry Revenue Million Forecast, by Country 2020 & 2033
- Table 16: Brazil USA Automotive Service Industry Revenue (Million) Forecast, by Application 2020 & 2033
- Table 17: Argentina USA Automotive Service Industry Revenue (Million) Forecast, by Application 2020 & 2033
- Table 18: Rest of South America USA Automotive Service Industry Revenue (Million) Forecast, by Application 2020 & 2033
- Table 19: Global USA Automotive Service Industry Revenue Million Forecast, by Vehicle Type 2020 & 2033
- Table 20: Global USA Automotive Service Industry Revenue Million Forecast, by Service Type 2020 & 2033
- Table 21: Global USA Automotive Service Industry Revenue Million Forecast, by Equipment Type 2020 & 2033
- Table 22: Global USA Automotive Service Industry Revenue Million Forecast, by Country 2020 & 2033
- Table 23: United Kingdom USA Automotive Service Industry Revenue (Million) Forecast, by Application 2020 & 2033
- Table 24: Germany USA Automotive Service Industry Revenue (Million) Forecast, by Application 2020 & 2033
- Table 25: France USA Automotive Service Industry Revenue (Million) Forecast, by Application 2020 & 2033
- Table 26: Italy USA Automotive Service Industry Revenue (Million) Forecast, by Application 2020 & 2033
- Table 27: Spain USA Automotive Service Industry Revenue (Million) Forecast, by Application 2020 & 2033
- Table 28: Russia USA Automotive Service Industry Revenue (Million) Forecast, by Application 2020 & 2033
- Table 29: Benelux USA Automotive Service Industry Revenue (Million) Forecast, by Application 2020 & 2033
- Table 30: Nordics USA Automotive Service Industry Revenue (Million) Forecast, by Application 2020 & 2033
- Table 31: Rest of Europe USA Automotive Service Industry Revenue (Million) Forecast, by Application 2020 & 2033
- Table 32: Global USA Automotive Service Industry Revenue Million Forecast, by Vehicle Type 2020 & 2033
- Table 33: Global USA Automotive Service Industry Revenue Million Forecast, by Service Type 2020 & 2033
- Table 34: Global USA Automotive Service Industry Revenue Million Forecast, by Equipment Type 2020 & 2033
- Table 35: Global USA Automotive Service Industry Revenue Million Forecast, by Country 2020 & 2033
- Table 36: Turkey USA Automotive Service Industry Revenue (Million) Forecast, by Application 2020 & 2033
- Table 37: Israel USA Automotive Service Industry Revenue (Million) Forecast, by Application 2020 & 2033
- Table 38: GCC USA Automotive Service Industry Revenue (Million) Forecast, by Application 2020 & 2033
- Table 39: North Africa USA Automotive Service Industry Revenue (Million) Forecast, by Application 2020 & 2033
- Table 40: South Africa USA Automotive Service Industry Revenue (Million) Forecast, by Application 2020 & 2033
- Table 41: Rest of Middle East & Africa USA Automotive Service Industry Revenue (Million) Forecast, by Application 2020 & 2033
- Table 42: Global USA Automotive Service Industry Revenue Million Forecast, by Vehicle Type 2020 & 2033
- Table 43: Global USA Automotive Service Industry Revenue Million Forecast, by Service Type 2020 & 2033
- Table 44: Global USA Automotive Service Industry Revenue Million Forecast, by Equipment Type 2020 & 2033
- Table 45: Global USA Automotive Service Industry Revenue Million Forecast, by Country 2020 & 2033
- Table 46: China USA Automotive Service Industry Revenue (Million) Forecast, by Application 2020 & 2033
- Table 47: India USA Automotive Service Industry Revenue (Million) Forecast, by Application 2020 & 2033
- Table 48: Japan USA Automotive Service Industry Revenue (Million) Forecast, by Application 2020 & 2033
- Table 49: South Korea USA Automotive Service Industry Revenue (Million) Forecast, by Application 2020 & 2033
- Table 50: ASEAN USA Automotive Service Industry Revenue (Million) Forecast, by Application 2020 & 2033
- Table 51: Oceania USA Automotive Service Industry Revenue (Million) Forecast, by Application 2020 & 2033
- Table 52: Rest of Asia Pacific USA Automotive Service Industry Revenue (Million) Forecast, by Application 2020 & 2033
Frequently Asked Questions
1. What is the projected Compound Annual Growth Rate (CAGR) of the USA Automotive Service Industry?
The projected CAGR is approximately 5.98%.
2. Which companies are prominent players in the USA Automotive Service Industry?
Key companies in the market include Midas International LLC, Meineke Car Care Centers LLC, Pep Boy, Firestone Complete Auto Care, Safelite Group, Monro Inc, Jiffy Lube International Inc, Walmart Inc.
3. What are the main segments of the USA Automotive Service Industry?
The market segments include Vehicle Type, Service Type, Equipment Type.
4. Can you provide details about the market size?
The market size is estimated to be USD 188.13 Million as of 2022.
5. What are some drivers contributing to market growth?
Increasing Sales of Electric Vehicles are Expected to Drive the Market.
6. What are the notable trends driving market growth?
Growing Demand for Commercial Vehicles Likely to Drive the Market.
7. Are there any restraints impacting market growth?
Lack of Infrastructure May Hamper the growth of the Market.
8. Can you provide examples of recent developments in the market?
In December 2022, AutoNation Inc., one of America's largest automotive retailers, announced the acquisition of RepairSmith, a full-service mobile solution for automotive repair and maintenance headquartered in Los Angeles, CA, with a significant operational footprint in the southern and western United States.
9. What pricing options are available for accessing the report?
Pricing options include single-user, multi-user, and enterprise licenses priced at USD 3800, USD 4500, and USD 5800 respectively.
10. Is the market size provided in terms of value or volume?
The market size is provided in terms of value, measured in Million.
11. Are there any specific market keywords associated with the report?
Yes, the market keyword associated with the report is "USA Automotive Service Industry," which aids in identifying and referencing the specific market segment covered.
12. How do I determine which pricing option suits my needs best?
The pricing options vary based on user requirements and access needs. Individual users may opt for single-user licenses, while businesses requiring broader access may choose multi-user or enterprise licenses for cost-effective access to the report.
13. Are there any additional resources or data provided in the USA Automotive Service Industry report?
While the report offers comprehensive insights, it's advisable to review the specific contents or supplementary materials provided to ascertain if additional resources or data are available.
14. How can I stay updated on further developments or reports in the USA Automotive Service Industry?
To stay informed about further developments, trends, and reports in the USA Automotive Service Industry, consider subscribing to industry newsletters, following relevant companies and organizations, or regularly checking reputable industry news sources and publications.
Methodology
Step 1 - Identification of Relevant Samples Size from Population Database


Step 2 - Approaches for Defining Global Market Size (Value, Volume* & Price*)

Note*: In applicable scenarios
Step 3 - Data Sources
Primary Research
- Web Analytics
- Survey Reports
- Research Institute
- Latest Research Reports
- Opinion Leaders
Secondary Research
- Annual Reports
- White Paper
- Latest Press Release
- Industry Association
- Paid Database
- Investor Presentations

Step 4 - Data Triangulation
Involves using different sources of information in order to increase the validity of a study
These sources are likely to be stakeholders in a program - participants, other researchers, program staff, other community members, and so on.
Then we put all data in single framework & apply various statistical tools to find out the dynamic on the market.
During the analysis stage, feedback from the stakeholder groups would be compared to determine areas of agreement as well as areas of divergence