

Key Insights
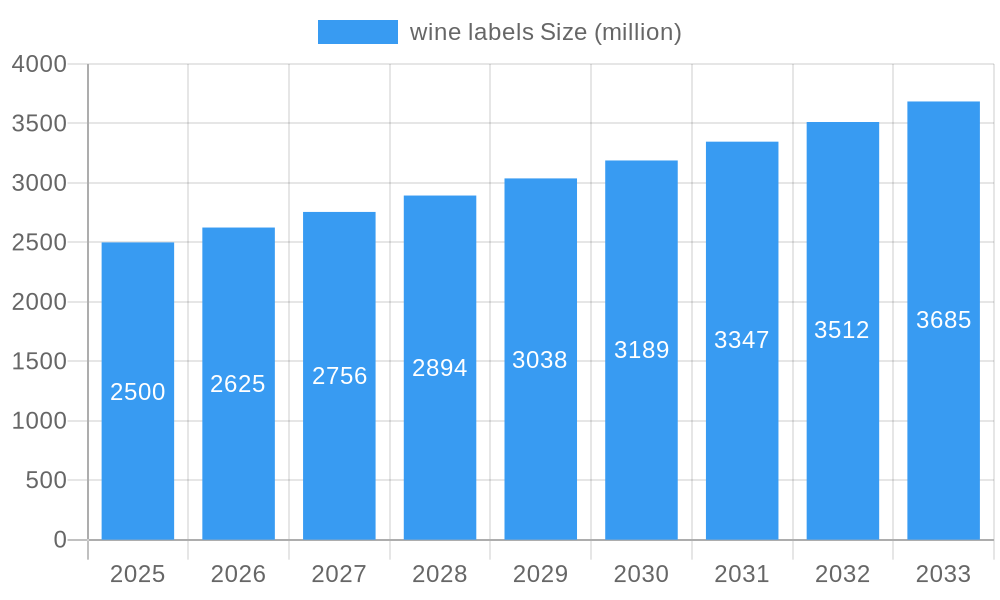
The global wine label market is experiencing robust growth, driven by the increasing popularity of wine, particularly premium and craft varieties, globally. The expanding wine tourism sector and a rising demand for sophisticated, aesthetically pleasing labels are further fueling market expansion. Consumer preference for sustainable and eco-friendly labeling solutions, such as those made from recycled materials or using water-based inks, presents a significant opportunity for market players. Technological advancements in label printing, including digital printing and embellishment techniques (e.g., embossing, foil stamping), are enhancing label quality and design capabilities, which contributes to higher-value labels and increased market revenue. Competitive pressures among label manufacturers necessitate innovation and cost optimization strategies to maintain market share. While fluctuating raw material costs and global economic conditions present challenges, the overall market outlook remains positive, projecting continued growth in the coming years. The market is segmented based on label type (e.g., paper, plastic, self-adhesive), printing technology (e.g., flexographic, digital), and application (e.g., bottle, box). Major players in the market are leveraging strategic partnerships, mergers and acquisitions, and geographical expansions to strengthen their market positions. We estimate the 2025 market size at $2.5 Billion, assuming a reasonable CAGR of 5% based on industry averages for similar packaging segments.
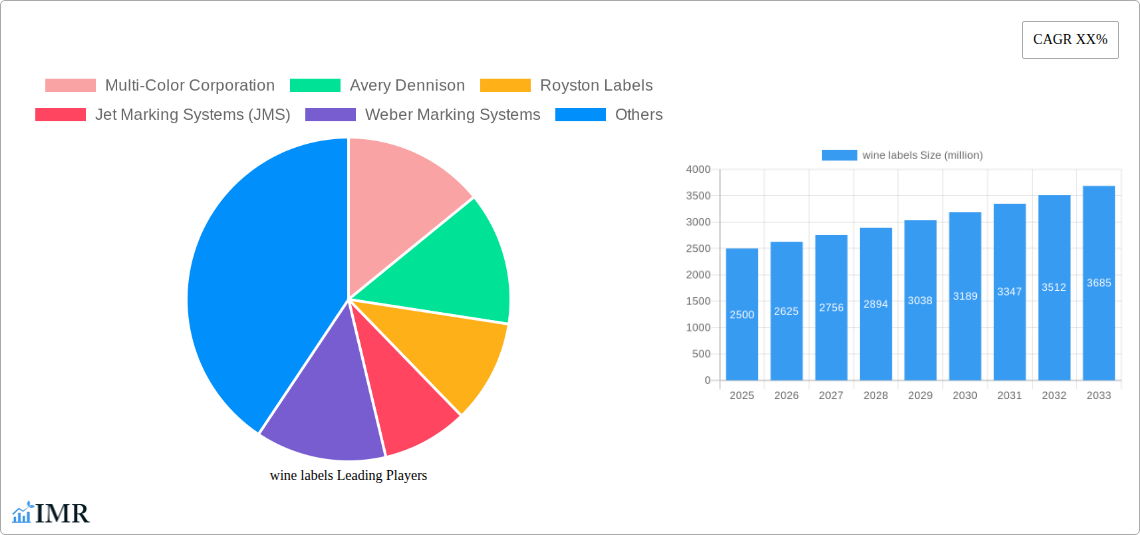
wine labels Market Size (In Billion)
Growth in the wine label market will continue to be influenced by evolving consumer preferences. The increasing demand for premium wines correlates with higher spending on sophisticated and eye-catching labels. Moreover, trends like direct-to-consumer wine sales and the rise of online wine retailers are creating new opportunities for label personalization and branding. The market will likely see increased adoption of smart labels with features such as RFID or QR codes, allowing for better product traceability and consumer engagement. This requires ongoing investment in research and development by label manufacturers. Regulatory changes regarding labeling requirements and sustainability standards, varying across different regions, will influence the market's trajectory, requiring manufacturers to adapt to regional-specific compliance regulations. This necessitates flexibility and adaptation from market participants, impacting both production methods and material choices.
wine labels Company Market Share
Wine Labels Market Report: 2019-2033 - A Comprehensive Analysis
This in-depth report provides a comprehensive analysis of the global wine labels market, offering invaluable insights for industry professionals, investors, and strategic decision-makers. Covering the period 2019-2033, with a focus on 2025, this report meticulously examines market dynamics, growth trends, competitive landscapes, and future opportunities within the wine and beverage labeling sectors. The report's detailed segmentation allows for granular understanding of the parent market (packaging labels) and child market (wine labels), enabling tailored strategies and informed investments. The market size is predicted to reach xx million units by 2033.
Wine Labels Market Dynamics & Structure
The global wine labels market is characterized by moderate concentration, with key players like Multi-Color Corporation and Avery Dennison holding significant market share. Technological innovation, driven by advancements in printing technologies (e.g., digital printing, flexographic printing) and sustainable materials, significantly shapes market dynamics. Stringent regulatory frameworks concerning label materials and labeling information influence production practices and costs. Competitive substitutes, such as shrink sleeves and other forms of packaging, exert pressure on market share. The end-user demographic, comprising wineries of varying sizes and geographical locations, influences label design and demand. M&A activity in the broader packaging industry, though not exceptionally high in the wine labels segment specifically, influences market consolidation.
- Market Concentration: Moderately concentrated, with the top 5 players holding approximately xx% of the market share in 2025.
- Technological Innovation: Digital printing and sustainable materials are key drivers of innovation.
- Regulatory Framework: Stringent regulations regarding labeling information and materials impact cost and production.
- Competitive Substitutes: Shrink sleeves and alternative packaging methods present competitive challenges.
- M&A Activity: Moderate level of consolidation through mergers and acquisitions in the wider packaging industry. (xx deals recorded between 2019-2024)
Wine Labels Growth Trends & Insights
The wine labels market experienced a compound annual growth rate (CAGR) of xx% during the historical period (2019-2024), reaching xx million units in 2025. This growth is attributed to several factors, including a rising global demand for wine, increasing preference for premium wines (requiring high-quality labels), and technological advancements enabling enhanced label customization and design. Adoption rates for sustainable and eco-friendly label materials are increasing, driven by consumer demand and environmental concerns. Technological disruptions, such as the adoption of digital printing and RFID technology for tracking and traceability, are transforming label production and supply chain efficiency. Changing consumer behavior, particularly a preference for personalized and aesthetically appealing labels, further drives market growth.
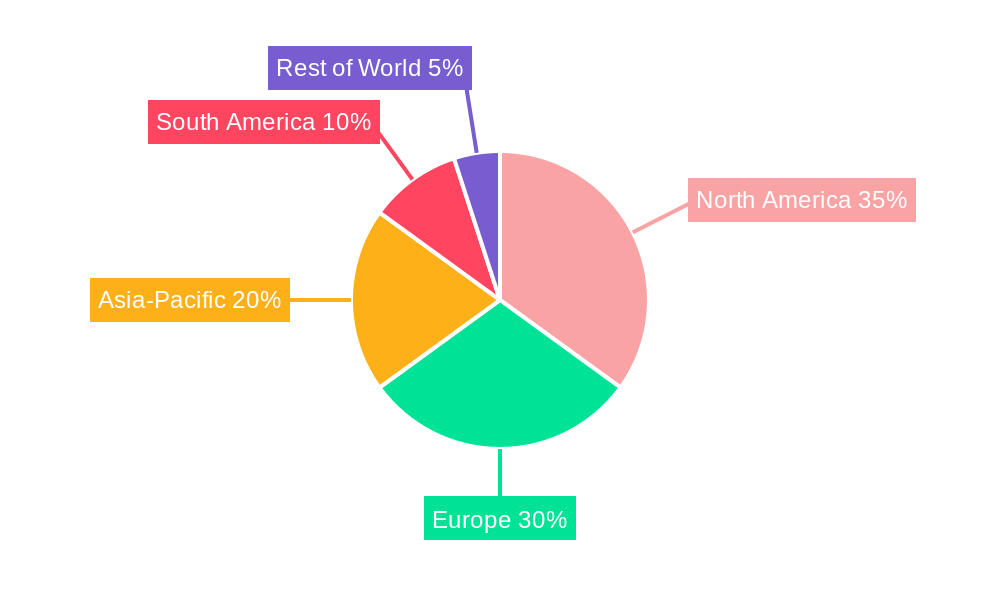
Dominant Regions, Countries, or Segments in Wine Labels
The North American region dominated the wine labels market in 2025, accounting for xx% of the global market share. This dominance is largely due to a robust wine industry, high per capita wine consumption, and a preference for premium wine labels. Europe holds a significant share (xx%), driven by established wine-producing countries such as France and Italy.
- Key Drivers in North America: Established wine industry, high consumption rates, preference for premium labels.
- Key Drivers in Europe: Large wine-producing regions, long-standing tradition of winemaking, diverse consumer preferences.
- Growth Potential: Emerging markets in Asia-Pacific and Latin America show significant growth potential due to increasing wine consumption and developing wine industries.
Wine Labels Product Landscape
The wine labels market offers a wide array of products, encompassing various materials (paper, PVC, PET), printing technologies (flexography, digital printing, screen printing), and label finishes (gloss, matte, textured). Innovation focuses on sustainable materials, such as recycled paper and biodegradable plastics, in response to growing environmental concerns. High-quality printing technologies provide enhanced visual appeal and brand differentiation. Key performance metrics include label durability, printability, adhesion, and sustainability. Unique selling propositions frequently center on design aesthetics, material sustainability, and brand-enhancing features.
Key Drivers, Barriers & Challenges in Wine Labels
Key Drivers:
- Increasing wine consumption globally.
- Growing demand for premium wines with sophisticated labels.
- Technological advancements in printing and material science.
- Rising consumer preference for personalized and sustainable labels.
Key Barriers & Challenges:
- Fluctuations in raw material prices impacting production costs.
- Stringent regulatory requirements and compliance costs.
- Intense competition among label manufacturers. (Market share competition leading to price wars and reduced profit margins for some players.)
- Supply chain disruptions causing delays and increased costs.
Emerging Opportunities in Wine Labels
- Growing demand for personalized wine labels and customized designs.
- Expanding use of smart labels incorporating RFID or NFC technology for improved traceability and consumer engagement.
- Increasing focus on sustainable and eco-friendly labeling solutions.
- Penetration into emerging wine markets in Asia and Latin America.
Growth Accelerators in the Wine Labels Industry
Technological breakthroughs in digital printing and sustainable material development are key catalysts for long-term growth. Strategic partnerships between label manufacturers and wine producers foster innovation and market expansion. Expanding into emerging markets with developing wine industries presents significant opportunities for growth.
Key Players Shaping the Wine Labels Market
- Multi-Color Corporation
- Avery Dennison
- Royston Labels
- Jet Marking Systems (JMS)
- Weber Marking Systems
- Lustre-Cal Corporation
- Blue Label Packaging
- Vintage 99 Label
- Consolidated Label
- A & A Labels
- JK Labels
- DISHA BARCODE SOLUTIONS
- Adazon
- VR Labels
- AMC AG
Notable Milestones in Wine Labels Sector
- 2020: Increased adoption of sustainable materials by leading label manufacturers.
- 2022: Launch of several new digital printing technologies enhancing label customization options.
- 2023: Significant M&A activity in the wider packaging sector.
In-Depth Wine Labels Market Outlook
The wine labels market is poised for continued growth driven by sustained demand for wine, technological innovation, and the expanding adoption of sustainable practices. Strategic investments in digital printing technologies and eco-friendly materials will be crucial for success. Expansion into emerging markets and the development of value-added services, such as smart label solutions, will present significant opportunities for growth and market leadership.
wine labels Segmentation
-
1. Application
- 1.1. Online Retail
- 1.2. Offline Retail
-
2. Types
- 2.1. Pressure-sensitive
- 2.2. Glue Applied
- 2.3. Others
wine labels Segmentation By Geography
-
1. North America
- 1.1. United States
- 1.2. Canada
- 1.3. Mexico
-
2. South America
- 2.1. Brazil
- 2.2. Argentina
- 2.3. Rest of South America
-
3. Europe
- 3.1. United Kingdom
- 3.2. Germany
- 3.3. France
- 3.4. Italy
- 3.5. Spain
- 3.6. Russia
- 3.7. Benelux
- 3.8. Nordics
- 3.9. Rest of Europe
-
4. Middle East & Africa
- 4.1. Turkey
- 4.2. Israel
- 4.3. GCC
- 4.4. North Africa
- 4.5. South Africa
- 4.6. Rest of Middle East & Africa
-
5. Asia Pacific
- 5.1. China
- 5.2. India
- 5.3. Japan
- 5.4. South Korea
- 5.5. ASEAN
- 5.6. Oceania
- 5.7. Rest of Asia Pacific
wine labels Regional Market Share
Geographic Coverage of wine labels
wine labels REPORT HIGHLIGHTS
| Aspects | Details |
|---|---|
| Study Period | 2020-2034 |
| Base Year | 2025 |
| Estimated Year | 2026 |
| Forecast Period | 2026-2034 |
| Historical Period | 2020-2025 |
| Growth Rate | CAGR of 5.7% from 2020-2034 |
| Segmentation |
|
Table of Contents
- 1. Introduction
- 1.1. Research Scope
- 1.2. Market Segmentation
- 1.3. Research Methodology
- 1.4. Definitions and Assumptions
- 2. Executive Summary
- 2.1. Introduction
- 3. Market Dynamics
- 3.1. Introduction
- 3.2. Market Drivers
- 3.3. Market Restrains
- 3.4. Market Trends
- 4. Market Factor Analysis
- 4.1. Porters Five Forces
- 4.2. Supply/Value Chain
- 4.3. PESTEL analysis
- 4.4. Market Entropy
- 4.5. Patent/Trademark Analysis
- 5. Global wine labels Analysis, Insights and Forecast, 2020-2032
- 5.1. Market Analysis, Insights and Forecast - by Application
- 5.1.1. Online Retail
- 5.1.2. Offline Retail
- 5.2. Market Analysis, Insights and Forecast - by Types
- 5.2.1. Pressure-sensitive
- 5.2.2. Glue Applied
- 5.2.3. Others
- 5.3. Market Analysis, Insights and Forecast - by Region
- 5.3.1. North America
- 5.3.2. South America
- 5.3.3. Europe
- 5.3.4. Middle East & Africa
- 5.3.5. Asia Pacific
- 5.1. Market Analysis, Insights and Forecast - by Application
- 6. North America wine labels Analysis, Insights and Forecast, 2020-2032
- 6.1. Market Analysis, Insights and Forecast - by Application
- 6.1.1. Online Retail
- 6.1.2. Offline Retail
- 6.2. Market Analysis, Insights and Forecast - by Types
- 6.2.1. Pressure-sensitive
- 6.2.2. Glue Applied
- 6.2.3. Others
- 6.1. Market Analysis, Insights and Forecast - by Application
- 7. South America wine labels Analysis, Insights and Forecast, 2020-2032
- 7.1. Market Analysis, Insights and Forecast - by Application
- 7.1.1. Online Retail
- 7.1.2. Offline Retail
- 7.2. Market Analysis, Insights and Forecast - by Types
- 7.2.1. Pressure-sensitive
- 7.2.2. Glue Applied
- 7.2.3. Others
- 7.1. Market Analysis, Insights and Forecast - by Application
- 8. Europe wine labels Analysis, Insights and Forecast, 2020-2032
- 8.1. Market Analysis, Insights and Forecast - by Application
- 8.1.1. Online Retail
- 8.1.2. Offline Retail
- 8.2. Market Analysis, Insights and Forecast - by Types
- 8.2.1. Pressure-sensitive
- 8.2.2. Glue Applied
- 8.2.3. Others
- 8.1. Market Analysis, Insights and Forecast - by Application
- 9. Middle East & Africa wine labels Analysis, Insights and Forecast, 2020-2032
- 9.1. Market Analysis, Insights and Forecast - by Application
- 9.1.1. Online Retail
- 9.1.2. Offline Retail
- 9.2. Market Analysis, Insights and Forecast - by Types
- 9.2.1. Pressure-sensitive
- 9.2.2. Glue Applied
- 9.2.3. Others
- 9.1. Market Analysis, Insights and Forecast - by Application
- 10. Asia Pacific wine labels Analysis, Insights and Forecast, 2020-2032
- 10.1. Market Analysis, Insights and Forecast - by Application
- 10.1.1. Online Retail
- 10.1.2. Offline Retail
- 10.2. Market Analysis, Insights and Forecast - by Types
- 10.2.1. Pressure-sensitive
- 10.2.2. Glue Applied
- 10.2.3. Others
- 10.1. Market Analysis, Insights and Forecast - by Application
- 11. Competitive Analysis
- 11.1. Global Market Share Analysis 2025
- 11.2. Company Profiles
- 11.2.1 Multi-Color Corporation
- 11.2.1.1. Overview
- 11.2.1.2. Products
- 11.2.1.3. SWOT Analysis
- 11.2.1.4. Recent Developments
- 11.2.1.5. Financials (Based on Availability)
- 11.2.2 Avery Dennison
- 11.2.2.1. Overview
- 11.2.2.2. Products
- 11.2.2.3. SWOT Analysis
- 11.2.2.4. Recent Developments
- 11.2.2.5. Financials (Based on Availability)
- 11.2.3 Royston Labels
- 11.2.3.1. Overview
- 11.2.3.2. Products
- 11.2.3.3. SWOT Analysis
- 11.2.3.4. Recent Developments
- 11.2.3.5. Financials (Based on Availability)
- 11.2.4 Jet Marking Systems (JMS)
- 11.2.4.1. Overview
- 11.2.4.2. Products
- 11.2.4.3. SWOT Analysis
- 11.2.4.4. Recent Developments
- 11.2.4.5. Financials (Based on Availability)
- 11.2.5 Weber Marking Systems
- 11.2.5.1. Overview
- 11.2.5.2. Products
- 11.2.5.3. SWOT Analysis
- 11.2.5.4. Recent Developments
- 11.2.5.5. Financials (Based on Availability)
- 11.2.6 Lustre-Cal Corporation
- 11.2.6.1. Overview
- 11.2.6.2. Products
- 11.2.6.3. SWOT Analysis
- 11.2.6.4. Recent Developments
- 11.2.6.5. Financials (Based on Availability)
- 11.2.7 Blue Label Packaging
- 11.2.7.1. Overview
- 11.2.7.2. Products
- 11.2.7.3. SWOT Analysis
- 11.2.7.4. Recent Developments
- 11.2.7.5. Financials (Based on Availability)
- 11.2.8 Vintage 99 Label
- 11.2.8.1. Overview
- 11.2.8.2. Products
- 11.2.8.3. SWOT Analysis
- 11.2.8.4. Recent Developments
- 11.2.8.5. Financials (Based on Availability)
- 11.2.9 Consolidated Label
- 11.2.9.1. Overview
- 11.2.9.2. Products
- 11.2.9.3. SWOT Analysis
- 11.2.9.4. Recent Developments
- 11.2.9.5. Financials (Based on Availability)
- 11.2.10 A & A Labels
- 11.2.10.1. Overview
- 11.2.10.2. Products
- 11.2.10.3. SWOT Analysis
- 11.2.10.4. Recent Developments
- 11.2.10.5. Financials (Based on Availability)
- 11.2.11 JK Labels
- 11.2.11.1. Overview
- 11.2.11.2. Products
- 11.2.11.3. SWOT Analysis
- 11.2.11.4. Recent Developments
- 11.2.11.5. Financials (Based on Availability)
- 11.2.12 DISHA BARCODE SOLUTIONS
- 11.2.12.1. Overview
- 11.2.12.2. Products
- 11.2.12.3. SWOT Analysis
- 11.2.12.4. Recent Developments
- 11.2.12.5. Financials (Based on Availability)
- 11.2.13 Adazon
- 11.2.13.1. Overview
- 11.2.13.2. Products
- 11.2.13.3. SWOT Analysis
- 11.2.13.4. Recent Developments
- 11.2.13.5. Financials (Based on Availability)
- 11.2.14 VR Labels
- 11.2.14.1. Overview
- 11.2.14.2. Products
- 11.2.14.3. SWOT Analysis
- 11.2.14.4. Recent Developments
- 11.2.14.5. Financials (Based on Availability)
- 11.2.15 AMC AG
- 11.2.15.1. Overview
- 11.2.15.2. Products
- 11.2.15.3. SWOT Analysis
- 11.2.15.4. Recent Developments
- 11.2.15.5. Financials (Based on Availability)
- 11.2.1 Multi-Color Corporation
List of Figures
- Figure 1: Global wine labels Revenue Breakdown (undefined, %) by Region 2025 & 2033
- Figure 2: Global wine labels Volume Breakdown (K, %) by Region 2025 & 2033
- Figure 3: North America wine labels Revenue (undefined), by Application 2025 & 2033
- Figure 4: North America wine labels Volume (K), by Application 2025 & 2033
- Figure 5: North America wine labels Revenue Share (%), by Application 2025 & 2033
- Figure 6: North America wine labels Volume Share (%), by Application 2025 & 2033
- Figure 7: North America wine labels Revenue (undefined), by Types 2025 & 2033
- Figure 8: North America wine labels Volume (K), by Types 2025 & 2033
- Figure 9: North America wine labels Revenue Share (%), by Types 2025 & 2033
- Figure 10: North America wine labels Volume Share (%), by Types 2025 & 2033
- Figure 11: North America wine labels Revenue (undefined), by Country 2025 & 2033
- Figure 12: North America wine labels Volume (K), by Country 2025 & 2033
- Figure 13: North America wine labels Revenue Share (%), by Country 2025 & 2033
- Figure 14: North America wine labels Volume Share (%), by Country 2025 & 2033
- Figure 15: South America wine labels Revenue (undefined), by Application 2025 & 2033
- Figure 16: South America wine labels Volume (K), by Application 2025 & 2033
- Figure 17: South America wine labels Revenue Share (%), by Application 2025 & 2033
- Figure 18: South America wine labels Volume Share (%), by Application 2025 & 2033
- Figure 19: South America wine labels Revenue (undefined), by Types 2025 & 2033
- Figure 20: South America wine labels Volume (K), by Types 2025 & 2033
- Figure 21: South America wine labels Revenue Share (%), by Types 2025 & 2033
- Figure 22: South America wine labels Volume Share (%), by Types 2025 & 2033
- Figure 23: South America wine labels Revenue (undefined), by Country 2025 & 2033
- Figure 24: South America wine labels Volume (K), by Country 2025 & 2033
- Figure 25: South America wine labels Revenue Share (%), by Country 2025 & 2033
- Figure 26: South America wine labels Volume Share (%), by Country 2025 & 2033
- Figure 27: Europe wine labels Revenue (undefined), by Application 2025 & 2033
- Figure 28: Europe wine labels Volume (K), by Application 2025 & 2033
- Figure 29: Europe wine labels Revenue Share (%), by Application 2025 & 2033
- Figure 30: Europe wine labels Volume Share (%), by Application 2025 & 2033
- Figure 31: Europe wine labels Revenue (undefined), by Types 2025 & 2033
- Figure 32: Europe wine labels Volume (K), by Types 2025 & 2033
- Figure 33: Europe wine labels Revenue Share (%), by Types 2025 & 2033
- Figure 34: Europe wine labels Volume Share (%), by Types 2025 & 2033
- Figure 35: Europe wine labels Revenue (undefined), by Country 2025 & 2033
- Figure 36: Europe wine labels Volume (K), by Country 2025 & 2033
- Figure 37: Europe wine labels Revenue Share (%), by Country 2025 & 2033
- Figure 38: Europe wine labels Volume Share (%), by Country 2025 & 2033
- Figure 39: Middle East & Africa wine labels Revenue (undefined), by Application 2025 & 2033
- Figure 40: Middle East & Africa wine labels Volume (K), by Application 2025 & 2033
- Figure 41: Middle East & Africa wine labels Revenue Share (%), by Application 2025 & 2033
- Figure 42: Middle East & Africa wine labels Volume Share (%), by Application 2025 & 2033
- Figure 43: Middle East & Africa wine labels Revenue (undefined), by Types 2025 & 2033
- Figure 44: Middle East & Africa wine labels Volume (K), by Types 2025 & 2033
- Figure 45: Middle East & Africa wine labels Revenue Share (%), by Types 2025 & 2033
- Figure 46: Middle East & Africa wine labels Volume Share (%), by Types 2025 & 2033
- Figure 47: Middle East & Africa wine labels Revenue (undefined), by Country 2025 & 2033
- Figure 48: Middle East & Africa wine labels Volume (K), by Country 2025 & 2033
- Figure 49: Middle East & Africa wine labels Revenue Share (%), by Country 2025 & 2033
- Figure 50: Middle East & Africa wine labels Volume Share (%), by Country 2025 & 2033
- Figure 51: Asia Pacific wine labels Revenue (undefined), by Application 2025 & 2033
- Figure 52: Asia Pacific wine labels Volume (K), by Application 2025 & 2033
- Figure 53: Asia Pacific wine labels Revenue Share (%), by Application 2025 & 2033
- Figure 54: Asia Pacific wine labels Volume Share (%), by Application 2025 & 2033
- Figure 55: Asia Pacific wine labels Revenue (undefined), by Types 2025 & 2033
- Figure 56: Asia Pacific wine labels Volume (K), by Types 2025 & 2033
- Figure 57: Asia Pacific wine labels Revenue Share (%), by Types 2025 & 2033
- Figure 58: Asia Pacific wine labels Volume Share (%), by Types 2025 & 2033
- Figure 59: Asia Pacific wine labels Revenue (undefined), by Country 2025 & 2033
- Figure 60: Asia Pacific wine labels Volume (K), by Country 2025 & 2033
- Figure 61: Asia Pacific wine labels Revenue Share (%), by Country 2025 & 2033
- Figure 62: Asia Pacific wine labels Volume Share (%), by Country 2025 & 2033
List of Tables
- Table 1: Global wine labels Revenue undefined Forecast, by Application 2020 & 2033
- Table 2: Global wine labels Volume K Forecast, by Application 2020 & 2033
- Table 3: Global wine labels Revenue undefined Forecast, by Types 2020 & 2033
- Table 4: Global wine labels Volume K Forecast, by Types 2020 & 2033
- Table 5: Global wine labels Revenue undefined Forecast, by Region 2020 & 2033
- Table 6: Global wine labels Volume K Forecast, by Region 2020 & 2033
- Table 7: Global wine labels Revenue undefined Forecast, by Application 2020 & 2033
- Table 8: Global wine labels Volume K Forecast, by Application 2020 & 2033
- Table 9: Global wine labels Revenue undefined Forecast, by Types 2020 & 2033
- Table 10: Global wine labels Volume K Forecast, by Types 2020 & 2033
- Table 11: Global wine labels Revenue undefined Forecast, by Country 2020 & 2033
- Table 12: Global wine labels Volume K Forecast, by Country 2020 & 2033
- Table 13: United States wine labels Revenue (undefined) Forecast, by Application 2020 & 2033
- Table 14: United States wine labels Volume (K) Forecast, by Application 2020 & 2033
- Table 15: Canada wine labels Revenue (undefined) Forecast, by Application 2020 & 2033
- Table 16: Canada wine labels Volume (K) Forecast, by Application 2020 & 2033
- Table 17: Mexico wine labels Revenue (undefined) Forecast, by Application 2020 & 2033
- Table 18: Mexico wine labels Volume (K) Forecast, by Application 2020 & 2033
- Table 19: Global wine labels Revenue undefined Forecast, by Application 2020 & 2033
- Table 20: Global wine labels Volume K Forecast, by Application 2020 & 2033
- Table 21: Global wine labels Revenue undefined Forecast, by Types 2020 & 2033
- Table 22: Global wine labels Volume K Forecast, by Types 2020 & 2033
- Table 23: Global wine labels Revenue undefined Forecast, by Country 2020 & 2033
- Table 24: Global wine labels Volume K Forecast, by Country 2020 & 2033
- Table 25: Brazil wine labels Revenue (undefined) Forecast, by Application 2020 & 2033
- Table 26: Brazil wine labels Volume (K) Forecast, by Application 2020 & 2033
- Table 27: Argentina wine labels Revenue (undefined) Forecast, by Application 2020 & 2033
- Table 28: Argentina wine labels Volume (K) Forecast, by Application 2020 & 2033
- Table 29: Rest of South America wine labels Revenue (undefined) Forecast, by Application 2020 & 2033
- Table 30: Rest of South America wine labels Volume (K) Forecast, by Application 2020 & 2033
- Table 31: Global wine labels Revenue undefined Forecast, by Application 2020 & 2033
- Table 32: Global wine labels Volume K Forecast, by Application 2020 & 2033
- Table 33: Global wine labels Revenue undefined Forecast, by Types 2020 & 2033
- Table 34: Global wine labels Volume K Forecast, by Types 2020 & 2033
- Table 35: Global wine labels Revenue undefined Forecast, by Country 2020 & 2033
- Table 36: Global wine labels Volume K Forecast, by Country 2020 & 2033
- Table 37: United Kingdom wine labels Revenue (undefined) Forecast, by Application 2020 & 2033
- Table 38: United Kingdom wine labels Volume (K) Forecast, by Application 2020 & 2033
- Table 39: Germany wine labels Revenue (undefined) Forecast, by Application 2020 & 2033
- Table 40: Germany wine labels Volume (K) Forecast, by Application 2020 & 2033
- Table 41: France wine labels Revenue (undefined) Forecast, by Application 2020 & 2033
- Table 42: France wine labels Volume (K) Forecast, by Application 2020 & 2033
- Table 43: Italy wine labels Revenue (undefined) Forecast, by Application 2020 & 2033
- Table 44: Italy wine labels Volume (K) Forecast, by Application 2020 & 2033
- Table 45: Spain wine labels Revenue (undefined) Forecast, by Application 2020 & 2033
- Table 46: Spain wine labels Volume (K) Forecast, by Application 2020 & 2033
- Table 47: Russia wine labels Revenue (undefined) Forecast, by Application 2020 & 2033
- Table 48: Russia wine labels Volume (K) Forecast, by Application 2020 & 2033
- Table 49: Benelux wine labels Revenue (undefined) Forecast, by Application 2020 & 2033
- Table 50: Benelux wine labels Volume (K) Forecast, by Application 2020 & 2033
- Table 51: Nordics wine labels Revenue (undefined) Forecast, by Application 2020 & 2033
- Table 52: Nordics wine labels Volume (K) Forecast, by Application 2020 & 2033
- Table 53: Rest of Europe wine labels Revenue (undefined) Forecast, by Application 2020 & 2033
- Table 54: Rest of Europe wine labels Volume (K) Forecast, by Application 2020 & 2033
- Table 55: Global wine labels Revenue undefined Forecast, by Application 2020 & 2033
- Table 56: Global wine labels Volume K Forecast, by Application 2020 & 2033
- Table 57: Global wine labels Revenue undefined Forecast, by Types 2020 & 2033
- Table 58: Global wine labels Volume K Forecast, by Types 2020 & 2033
- Table 59: Global wine labels Revenue undefined Forecast, by Country 2020 & 2033
- Table 60: Global wine labels Volume K Forecast, by Country 2020 & 2033
- Table 61: Turkey wine labels Revenue (undefined) Forecast, by Application 2020 & 2033
- Table 62: Turkey wine labels Volume (K) Forecast, by Application 2020 & 2033
- Table 63: Israel wine labels Revenue (undefined) Forecast, by Application 2020 & 2033
- Table 64: Israel wine labels Volume (K) Forecast, by Application 2020 & 2033
- Table 65: GCC wine labels Revenue (undefined) Forecast, by Application 2020 & 2033
- Table 66: GCC wine labels Volume (K) Forecast, by Application 2020 & 2033
- Table 67: North Africa wine labels Revenue (undefined) Forecast, by Application 2020 & 2033
- Table 68: North Africa wine labels Volume (K) Forecast, by Application 2020 & 2033
- Table 69: South Africa wine labels Revenue (undefined) Forecast, by Application 2020 & 2033
- Table 70: South Africa wine labels Volume (K) Forecast, by Application 2020 & 2033
- Table 71: Rest of Middle East & Africa wine labels Revenue (undefined) Forecast, by Application 2020 & 2033
- Table 72: Rest of Middle East & Africa wine labels Volume (K) Forecast, by Application 2020 & 2033
- Table 73: Global wine labels Revenue undefined Forecast, by Application 2020 & 2033
- Table 74: Global wine labels Volume K Forecast, by Application 2020 & 2033
- Table 75: Global wine labels Revenue undefined Forecast, by Types 2020 & 2033
- Table 76: Global wine labels Volume K Forecast, by Types 2020 & 2033
- Table 77: Global wine labels Revenue undefined Forecast, by Country 2020 & 2033
- Table 78: Global wine labels Volume K Forecast, by Country 2020 & 2033
- Table 79: China wine labels Revenue (undefined) Forecast, by Application 2020 & 2033
- Table 80: China wine labels Volume (K) Forecast, by Application 2020 & 2033
- Table 81: India wine labels Revenue (undefined) Forecast, by Application 2020 & 2033
- Table 82: India wine labels Volume (K) Forecast, by Application 2020 & 2033
- Table 83: Japan wine labels Revenue (undefined) Forecast, by Application 2020 & 2033
- Table 84: Japan wine labels Volume (K) Forecast, by Application 2020 & 2033
- Table 85: South Korea wine labels Revenue (undefined) Forecast, by Application 2020 & 2033
- Table 86: South Korea wine labels Volume (K) Forecast, by Application 2020 & 2033
- Table 87: ASEAN wine labels Revenue (undefined) Forecast, by Application 2020 & 2033
- Table 88: ASEAN wine labels Volume (K) Forecast, by Application 2020 & 2033
- Table 89: Oceania wine labels Revenue (undefined) Forecast, by Application 2020 & 2033
- Table 90: Oceania wine labels Volume (K) Forecast, by Application 2020 & 2033
- Table 91: Rest of Asia Pacific wine labels Revenue (undefined) Forecast, by Application 2020 & 2033
- Table 92: Rest of Asia Pacific wine labels Volume (K) Forecast, by Application 2020 & 2033
Frequently Asked Questions
1. What is the projected Compound Annual Growth Rate (CAGR) of the wine labels?
The projected CAGR is approximately 5.7%.
2. Which companies are prominent players in the wine labels?
Key companies in the market include Multi-Color Corporation, Avery Dennison, Royston Labels, Jet Marking Systems (JMS), Weber Marking Systems, Lustre-Cal Corporation, Blue Label Packaging, Vintage 99 Label, Consolidated Label, A & A Labels, JK Labels, DISHA BARCODE SOLUTIONS, Adazon, VR Labels, AMC AG.
3. What are the main segments of the wine labels?
The market segments include Application, Types.
4. Can you provide details about the market size?
The market size is estimated to be USD XXX N/A as of 2022.
5. What are some drivers contributing to market growth?
N/A
6. What are the notable trends driving market growth?
N/A
7. Are there any restraints impacting market growth?
N/A
8. Can you provide examples of recent developments in the market?
N/A
9. What pricing options are available for accessing the report?
Pricing options include single-user, multi-user, and enterprise licenses priced at USD 4350.00, USD 6525.00, and USD 8700.00 respectively.
10. Is the market size provided in terms of value or volume?
The market size is provided in terms of value, measured in N/A and volume, measured in K.
11. Are there any specific market keywords associated with the report?
Yes, the market keyword associated with the report is "wine labels," which aids in identifying and referencing the specific market segment covered.
12. How do I determine which pricing option suits my needs best?
The pricing options vary based on user requirements and access needs. Individual users may opt for single-user licenses, while businesses requiring broader access may choose multi-user or enterprise licenses for cost-effective access to the report.
13. Are there any additional resources or data provided in the wine labels report?
While the report offers comprehensive insights, it's advisable to review the specific contents or supplementary materials provided to ascertain if additional resources or data are available.
14. How can I stay updated on further developments or reports in the wine labels?
To stay informed about further developments, trends, and reports in the wine labels, consider subscribing to industry newsletters, following relevant companies and organizations, or regularly checking reputable industry news sources and publications.
Methodology
Step 1 - Identification of Relevant Samples Size from Population Database


Step 2 - Approaches for Defining Global Market Size (Value, Volume* & Price*)

Note*: In applicable scenarios
Step 3 - Data Sources
Primary Research
- Web Analytics
- Survey Reports
- Research Institute
- Latest Research Reports
- Opinion Leaders
Secondary Research
- Annual Reports
- White Paper
- Latest Press Release
- Industry Association
- Paid Database
- Investor Presentations

Step 4 - Data Triangulation
Involves using different sources of information in order to increase the validity of a study
These sources are likely to be stakeholders in a program - participants, other researchers, program staff, other community members, and so on.
Then we put all data in single framework & apply various statistical tools to find out the dynamic on the market.
During the analysis stage, feedback from the stakeholder groups would be compared to determine areas of agreement as well as areas of divergence