

Key Insights
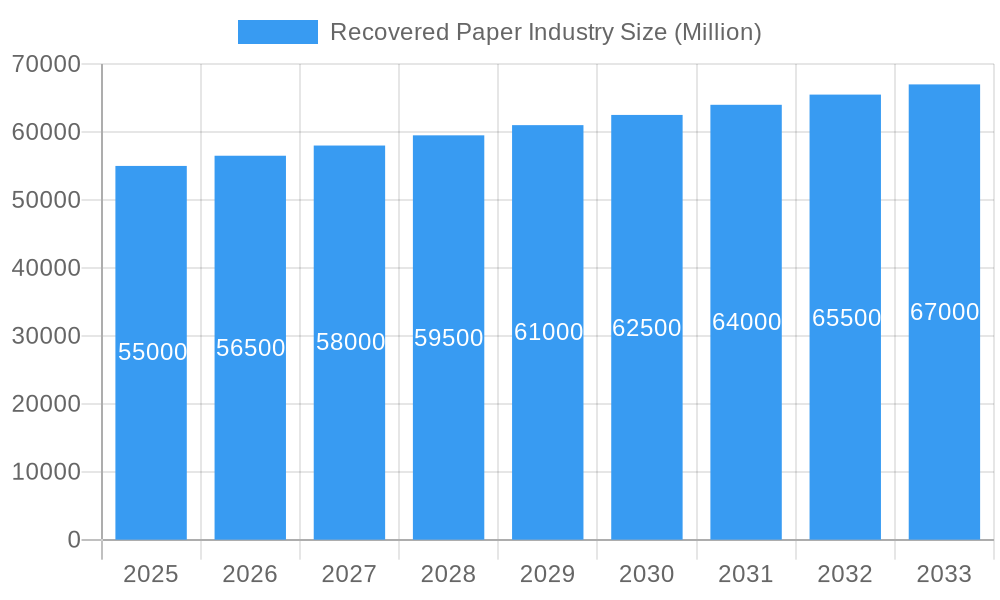
The global Recovered Paper market is poised for steady growth, projected to reach a significant market size of approximately $75,000 million by 2033, with a Compound Annual Growth Rate (CAGR) of 2.70% from the base year 2025. This expansion is primarily fueled by the escalating global demand for sustainable packaging solutions and the increasing environmental consciousness among consumers and corporations alike. As regulatory pressures to reduce virgin fiber consumption mount, the recovered paper industry benefits immensely from its role in the circular economy. Key drivers include the robust growth of the e-commerce sector, which necessitates high volumes of cardboard and containerboard, readily produced from recycled paper. Furthermore, advancements in paper recycling technologies are improving the quality and versatility of recovered paper, enabling its use in a wider array of applications, including premium printing and writing grades, and even high-quality tissue products. The increasing focus on reducing landfill waste and promoting resource efficiency further solidifies the foundational strength of this market.
Recovered Paper Industry Market Size (In Billion)
The market landscape is characterized by a diverse range of segments, with Containerboard emerging as a dominant force due to the sustained surge in demand for corrugated boxes driven by online retail and logistics. Printing and Writing Paper, while facing some digital disruption, continues to hold relevance, particularly in regions with strong traditional media and educational sectors. Tissue paper represents another significant segment, driven by hygiene needs and growing disposable incomes in developing economies. Restraints, though present, are largely manageable. Fluctuations in the quality and availability of recovered paper feedstock due to collection efficiencies and contamination issues can pose challenges. Additionally, the energy-intensive nature of the recycling process and the potential for volatile pricing of raw materials can impact profitability. However, strategic investments in advanced sorting and processing infrastructure, coupled with long-term supply agreements, are mitigating these restraints. Companies like International Paper, Smurfit Kappa Group, and Nine Dragons Paper are at the forefront of innovation, focusing on operational efficiency and product development to capitalize on the evolving market dynamics.
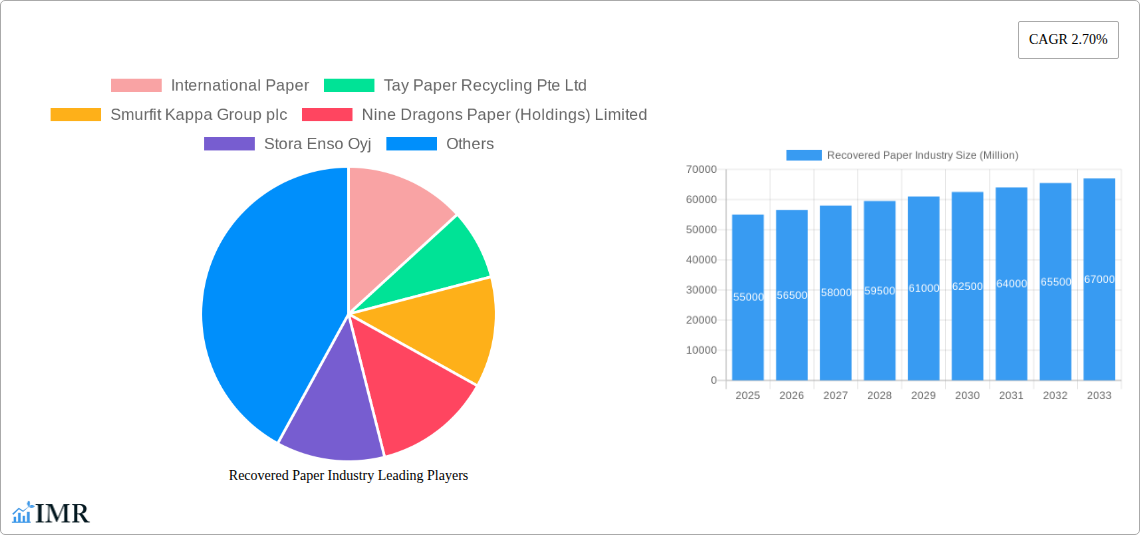
Recovered Paper Industry Company Market Share
Recovered Paper Industry: Comprehensive Market Analysis and Future Outlook
This in-depth report provides a critical analysis of the global Recovered Paper Industry, offering insights into its current dynamics, growth trajectory, and future potential. Leveraging high-traffic keywords, this report is optimized for search engine visibility and designed to engage industry professionals, investors, and stakeholders. We explore the intricate market structure, pinpoint dominant regions and segments, and detail key players shaping this vital sector. With a focus on parent and child market dynamics, this report delivers a holistic view of the recovered paper value chain. All monetary values are presented in Million USD.
Recovered Paper Industry Market Dynamics & Structure
The global Recovered Paper Industry exhibits a moderately concentrated market structure, with a few key players like International Paper, Smurfit Kappa Group plc, and Nine Dragons Paper (Holdings) Limited holding significant market share. Technological innovation is primarily driven by advancements in sorting and processing technologies, enhancing the quality and yield of recovered fibers. Regulatory frameworks, such as extended producer responsibility (EPR) schemes and landfill diversion targets, are increasingly influential in shaping market dynamics and encouraging higher recovery rates. Competitive product substitutes, primarily virgin pulp-based paper products, face increasing pressure from the cost-effectiveness and sustainability advantages of recycled paper. End-user demographics are shifting towards environmentally conscious consumers and businesses seeking sustainable sourcing options, particularly in packaging and consumer goods. Mergers and acquisitions (M&A) activity remains a significant strategy for consolidation and vertical integration, with an estimated XX M&A deals in the historical period (2019-2024).
- Market Concentration: Moderately concentrated, with major players focusing on economies of scale and integrated operations.
- Technological Innovation: Focus on improving sorting efficiency, de-inking processes, and enhancing the performance of recycled paper grades.
- Regulatory Frameworks: Growing influence of environmental regulations and policies promoting circular economy principles.
- Competitive Landscape: Virgin pulp products remain a substitute, but sustainability and cost are increasingly favoring recovered paper.
- End-User Demographics: Rising demand from businesses and consumers prioritizing sustainable materials.
- M&A Trends: Strategic acquisitions to expand capacity, secure feedstock, and enhance processing capabilities.
Recovered Paper Industry Growth Trends & Insights
The global Recovered Paper Industry is poised for robust growth, driven by escalating environmental concerns and the inherent economic benefits of recycling. The market size is projected to expand significantly from an estimated USD XXXX million in the base year 2025 to USD XXXX million by the end of the forecast period in 2033, exhibiting a Compound Annual Growth Rate (CAGR) of XX%. Adoption rates for recovered paper are steadily increasing across various end-use industries, particularly in packaging, where the demand for sustainable and cost-effective materials is at an all-time high. Technological disruptions are revolutionizing the industry, with advancements in artificial intelligence (AI) and automated sorting systems improving the efficiency and purity of recovered paper streams. Consumer behavior is a key influencer, with a discernible shift towards products with a lower environmental footprint, propelling demand for recycled content. Market penetration of recovered paper in key applications like containerboard and tissue is expected to rise, indicating a growing reliance on secondary fibers. The industry is also witnessing a surge in investments aimed at enhancing recycling infrastructure and developing higher-value applications for recovered paper. This sustained growth trajectory is underpinned by global initiatives promoting a circular economy, where waste is minimized, and resources are utilized efficiently. The increasing awareness of the carbon footprint associated with virgin pulp production further solidifies the competitive advantage of recovered paper. The evolution of recycling technologies is also enabling the processing of a wider range of paper waste, expanding the feedstock availability and driving innovation in product development.
Dominant Regions, Countries, or Segments in Recovered Paper Industry
The Containerboard segment is the undisputed leader and a primary growth engine within the Recovered Paper Industry. This dominance is propelled by the insatiable global demand for e-commerce packaging, sustainable shipping solutions, and protective materials for a vast array of consumer and industrial goods. The market share of containerboard derived from recovered paper is significant and projected to grow substantially. North America, with its advanced logistics networks and a strong e-commerce presence, alongside Europe, with its stringent waste management policies and a mature recycling infrastructure, are the leading regions. Asia Pacific, particularly China, is a rapidly expanding market, driven by its massive manufacturing base and growing domestic consumption.
- Dominant Segment: Containerboard:
- Drivers: Surge in e-commerce, demand for sustainable packaging, cost-effectiveness.
- Market Share (estimated): XX% of total recovered paper consumption.
- Growth Potential: High, driven by continued e-commerce expansion and corporate sustainability commitments.
- Leading Regions:
- North America: Mature recycling infrastructure, high e-commerce penetration, strong regulatory support.
- Europe: Advanced waste management, circular economy focus, increasing demand for recycled content.
- Asia Pacific (especially China): Rapid industrialization, growing consumer markets, expanding recycling capabilities.
- Key Drivers of Regional Dominance:
- Economic Policies: Government incentives for recycling and a circular economy.
- Infrastructure: Well-established collection, sorting, and processing facilities.
- Consumer Demand: Increasing preference for sustainable products.
- Industrial Output: High production of goods requiring packaging.
- Segment Growth Dynamics:
- Printing and Writing Paper: Declining demand due to digitalization but still a significant component.
- Newsprint: Significant decline due to shift to digital media.
- Tissue: Steady growth driven by hygiene and sanitation needs.
- Other Types: Growing niche applications and innovative uses of recovered fibers.
Recovered Paper Industry Product Landscape
Innovations in the Recovered Paper Industry are enhancing the performance and expanding the applications of recycled fiber. Products are increasingly being engineered to meet stringent quality standards, with advancements in de-inking and contaminant removal technologies yielding higher purity pulp. Key applications range from robust containerboard for shipping and e-commerce to soft and absorbent tissue products for hygiene. Performance metrics like tensile strength, burst strength, and brightness are continuously being improved to rival virgin pulp. Unique selling propositions revolve around the sustainability credentials, reduced environmental impact, and competitive pricing of recycled paper products. Technological advancements are also enabling the development of specialized recycled paper grades for niche markets, further diversifying the product portfolio and increasing the value proposition.
Key Drivers, Barriers & Challenges in Recovered Paper Industry
Key Drivers: The Recovered Paper Industry is propelled by escalating global environmental awareness, leading to a strong demand for sustainable materials. Government regulations promoting recycling and circular economy principles, coupled with the inherent cost-effectiveness of recovered paper compared to virgin pulp, are significant growth accelerators. Technological advancements in sorting and processing are also crucial drivers, enabling higher quality recycled fiber production.
Barriers & Challenges: Despite the positive outlook, the industry faces challenges such as inconsistent feedstock quality and supply chain disruptions. The high initial investment required for advanced processing infrastructure can be a barrier for smaller players. Regulatory hurdles and complex international trade policies for recovered paper can also pose challenges. Furthermore, intense competition from virgin pulp producers and the need to continuously innovate to meet evolving product quality demands remain constant pressures. The global estimated supply chain disruption impact is XX% of market value.
Emerging Opportunities in Recovered Paper Industry
Emerging opportunities lie in the development of higher-value applications for recovered paper beyond traditional packaging and newsprint. This includes innovative uses in building materials, textiles, and specialized industrial products. Untapped markets in developing economies with growing populations and increasing demand for sustainable solutions present significant growth potential. Evolving consumer preferences for eco-friendly products continue to drive demand for recycled content across all sectors. Furthermore, advancements in chemical recycling of paper waste could unlock new avenues for resource recovery and product creation.
Growth Accelerators in the Recovered Paper Industry Industry
Long-term growth in the Recovered Paper Industry is being significantly accelerated by breakthrough technological innovations, particularly in advanced sorting, purification, and material science. Strategic partnerships between paper manufacturers, waste management companies, and consumer brands are fostering more efficient collection and utilization of recovered paper. Market expansion strategies are targeting regions with developing recycling infrastructure and growing demand for sustainable products. The development of closed-loop recycling systems and the increasing integration of recovered paper into a wider array of consumer and industrial goods are also acting as powerful growth catalysts.
Key Players Shaping the Recovered Paper Industry Market
- International Paper
- Tay Paper Recycling Pte Ltd
- Smurfit Kappa Group plc
- Nine Dragons Paper (Holdings) Limited
- Stora Enso Oyj
- S A Industrias Celulosa Aragonesa (SAICA)
- Visy Industrie
- DS Smith Plc
Notable Milestones in Recovered Paper Industry Sector
- 2019: Increased global focus on plastic waste reduction leads to heightened interest in paper-based packaging solutions.
- 2020: COVID-19 pandemic accelerates e-commerce growth, significantly boosting demand for containerboard.
- 2021: Major investments in advanced sorting technologies and AI-driven waste management systems commence.
- 2022: Introduction of stricter EPR regulations in several key markets incentivizes higher recovered paper utilization.
- 2023: Development of new bio-based adhesives for paper packaging enhances recyclability and performance.
- 2024: Growing exploration of chemical recycling processes for more challenging paper waste streams.
- 2025: Projected increase in global recovered paper collection rates to XX%.
- 2026: Anticipated launch of novel recovered paper-based composite materials for diverse industries.
- 2028: Expected significant growth in demand for recovered paper in the tissue and hygiene sector.
- 2030: Continued advancements in optical sorting and contamination removal technologies.
- 2032: Increased integration of recovered paper in premium packaging applications.
- 2033: Projected achievement of XX% recycled content in global paper production.
In-Depth Recovered Paper Industry Market Outlook
The future outlook for the Recovered Paper Industry is exceptionally bright, driven by an unyielding global commitment to sustainability and the increasing economic viability of recycled fibers. Growth accelerators such as groundbreaking technological advancements in sorting and processing, alongside strategic collaborations across the value chain, will further solidify its market position. The expanding demand for eco-friendly packaging, coupled with supportive government policies promoting a circular economy, presents a fertile ground for sustained expansion. The industry is poised to capture an even larger share of the global paper market as innovation unlocks new, higher-value applications for recovered materials, ensuring robust and consistent growth through the forecast period and beyond.
Recovered Paper Industry Segmentation
-
1. Type
- 1.1. Printing and Writing Paper
- 1.2. Newsprint
- 1.3. Tissue
- 1.4. Containerboard
- 1.5. Other Types
Recovered Paper Industry Segmentation By Geography
- 1. North America
- 2. Europe
- 3. Asia Pacific
- 4. Latin America
- 5. Middle East and Africa
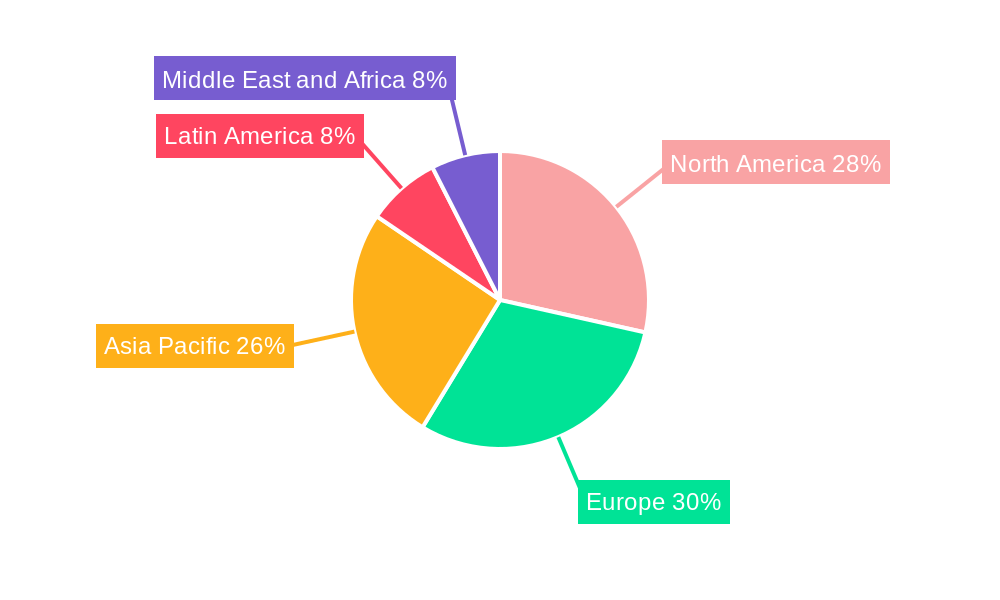
Recovered Paper Industry Regional Market Share
Geographic Coverage of Recovered Paper Industry
Recovered Paper Industry REPORT HIGHLIGHTS
| Aspects | Details |
|---|---|
| Study Period | 2020-2034 |
| Base Year | 2025 |
| Estimated Year | 2026 |
| Forecast Period | 2026-2034 |
| Historical Period | 2020-2025 |
| Growth Rate | CAGR of 2.70% from 2020-2034 |
| Segmentation |
|
Table of Contents
- 1. Introduction
- 1.1. Research Scope
- 1.2. Market Segmentation
- 1.3. Research Objective
- 1.4. Definitions and Assumptions
- 2. Executive Summary
- 2.1. Market Snapshot
- 3. Market Dynamics
- 3.1. Market Drivers
- 3.2. Market Restrains
- 3.3. Market Trends
- 3.4. Market Opportunities
- 4. Market Factor Analysis
- 4.1. Porters Five Forces
- 4.1.1. Bargaining Power of Suppliers
- 4.1.2. Bargaining Power of Buyers
- 4.1.3. Threat of New Entrants
- 4.1.4. Threat of Substitutes
- 4.1.5. Competitive Rivalry
- 4.2. PESTEL analysis
- 4.3. BCG Analysis
- 4.3.1. Stars (High Growth, High Market Share)
- 4.3.2. Cash Cows (Low Growth, High Market Share)
- 4.3.3. Question Mark (High Growth, Low Market Share)
- 4.3.4. Dogs (Low Growth, Low Market Share)
- 4.4. Ansoff Matrix Analysis
- 4.5. Supply Chain Analysis
- 4.6. Regulatory Landscape
- 4.7. Current Market Potential and Opportunity Assessment (TAM–SAM–SOM Framework)
- 4.8. IMR Analyst Note
- 4.1. Porters Five Forces
- 5. Market Analysis, Insights and Forecast 2021-2033
- 5.1. Market Analysis, Insights and Forecast - by Type
- 5.1.1. Printing and Writing Paper
- 5.1.2. Newsprint
- 5.1.3. Tissue
- 5.1.4. Containerboard
- 5.1.5. Other Types
- 5.2. Market Analysis, Insights and Forecast - by Region
- 5.2.1. North America
- 5.2.2. Europe
- 5.2.3. Asia Pacific
- 5.2.4. Latin America
- 5.2.5. Middle East and Africa
- 5.1. Market Analysis, Insights and Forecast - by Type
- 6. Global Recovered Paper Industry Analysis, Insights and Forecast, 2021-2033
- 6.1. Market Analysis, Insights and Forecast - by Type
- 6.1.1. Printing and Writing Paper
- 6.1.2. Newsprint
- 6.1.3. Tissue
- 6.1.4. Containerboard
- 6.1.5. Other Types
- 6.1. Market Analysis, Insights and Forecast - by Type
- 7. North America Recovered Paper Industry Analysis, Insights and Forecast, 2020-2032
- 7.1. Market Analysis, Insights and Forecast - by Type
- 7.1.1. Printing and Writing Paper
- 7.1.2. Newsprint
- 7.1.3. Tissue
- 7.1.4. Containerboard
- 7.1.5. Other Types
- 7.1. Market Analysis, Insights and Forecast - by Type
- 8. Europe Recovered Paper Industry Analysis, Insights and Forecast, 2020-2032
- 8.1. Market Analysis, Insights and Forecast - by Type
- 8.1.1. Printing and Writing Paper
- 8.1.2. Newsprint
- 8.1.3. Tissue
- 8.1.4. Containerboard
- 8.1.5. Other Types
- 8.1. Market Analysis, Insights and Forecast - by Type
- 9. Asia Pacific Recovered Paper Industry Analysis, Insights and Forecast, 2020-2032
- 9.1. Market Analysis, Insights and Forecast - by Type
- 9.1.1. Printing and Writing Paper
- 9.1.2. Newsprint
- 9.1.3. Tissue
- 9.1.4. Containerboard
- 9.1.5. Other Types
- 9.1. Market Analysis, Insights and Forecast - by Type
- 10. Latin America Recovered Paper Industry Analysis, Insights and Forecast, 2020-2032
- 10.1. Market Analysis, Insights and Forecast - by Type
- 10.1.1. Printing and Writing Paper
- 10.1.2. Newsprint
- 10.1.3. Tissue
- 10.1.4. Containerboard
- 10.1.5. Other Types
- 10.1. Market Analysis, Insights and Forecast - by Type
- 11. Middle East and Africa Recovered Paper Industry Analysis, Insights and Forecast, 2020-2032
- 11.1. Market Analysis, Insights and Forecast - by Type
- 11.1.1. Printing and Writing Paper
- 11.1.2. Newsprint
- 11.1.3. Tissue
- 11.1.4. Containerboard
- 11.1.5. Other Types
- 11.1. Market Analysis, Insights and Forecast - by Type
- 12. Competitive Analysis
- 12.1. Company Profiles
- 12.1.1 International Paper
- 12.1.1.1. Company Overview
- 12.1.1.2. Products
- 12.1.1.3. Company Financials
- 12.1.1.4. SWOT Analysis
- 12.1.2 Tay Paper Recycling Pte Ltd
- 12.1.2.1. Company Overview
- 12.1.2.2. Products
- 12.1.2.3. Company Financials
- 12.1.2.4. SWOT Analysis
- 12.1.3 Smurfit Kappa Group plc
- 12.1.3.1. Company Overview
- 12.1.3.2. Products
- 12.1.3.3. Company Financials
- 12.1.3.4. SWOT Analysis
- 12.1.4 Nine Dragons Paper (Holdings) Limited
- 12.1.4.1. Company Overview
- 12.1.4.2. Products
- 12.1.4.3. Company Financials
- 12.1.4.4. SWOT Analysis
- 12.1.5 Stora Enso Oyj
- 12.1.5.1. Company Overview
- 12.1.5.2. Products
- 12.1.5.3. Company Financials
- 12.1.5.4. SWOT Analysis
- 12.1.6 S A Industrias Celulosa Aragonesa (SAICA)
- 12.1.6.1. Company Overview
- 12.1.6.2. Products
- 12.1.6.3. Company Financials
- 12.1.6.4. SWOT Analysis
- 12.1.7 Visy Industrie
- 12.1.7.1. Company Overview
- 12.1.7.2. Products
- 12.1.7.3. Company Financials
- 12.1.7.4. SWOT Analysis
- 12.1.8 DS Smith Plc
- 12.1.8.1. Company Overview
- 12.1.8.2. Products
- 12.1.8.3. Company Financials
- 12.1.8.4. SWOT Analysis
- 12.1.1 International Paper
- 12.2. Market Entropy
- 12.2.1 Company's Key Areas Served
- 12.2.2 Recent Developments
- 12.3. Company Market Share Analysis 2025
- 12.3.1 Top 5 Companies Market Share Analysis
- 12.3.2 Top 3 Companies Market Share Analysis
- 12.4. List of Potential Customers
- 13. Research Methodology
List of Figures
- Figure 1: Global Recovered Paper Industry Revenue Breakdown (Million, %) by Region 2025 & 2033
- Figure 2: North America Recovered Paper Industry Revenue (Million), by Type 2025 & 2033
- Figure 3: North America Recovered Paper Industry Revenue Share (%), by Type 2025 & 2033
- Figure 4: North America Recovered Paper Industry Revenue (Million), by Country 2025 & 2033
- Figure 5: North America Recovered Paper Industry Revenue Share (%), by Country 2025 & 2033
- Figure 6: Europe Recovered Paper Industry Revenue (Million), by Type 2025 & 2033
- Figure 7: Europe Recovered Paper Industry Revenue Share (%), by Type 2025 & 2033
- Figure 8: Europe Recovered Paper Industry Revenue (Million), by Country 2025 & 2033
- Figure 9: Europe Recovered Paper Industry Revenue Share (%), by Country 2025 & 2033
- Figure 10: Asia Pacific Recovered Paper Industry Revenue (Million), by Type 2025 & 2033
- Figure 11: Asia Pacific Recovered Paper Industry Revenue Share (%), by Type 2025 & 2033
- Figure 12: Asia Pacific Recovered Paper Industry Revenue (Million), by Country 2025 & 2033
- Figure 13: Asia Pacific Recovered Paper Industry Revenue Share (%), by Country 2025 & 2033
- Figure 14: Latin America Recovered Paper Industry Revenue (Million), by Type 2025 & 2033
- Figure 15: Latin America Recovered Paper Industry Revenue Share (%), by Type 2025 & 2033
- Figure 16: Latin America Recovered Paper Industry Revenue (Million), by Country 2025 & 2033
- Figure 17: Latin America Recovered Paper Industry Revenue Share (%), by Country 2025 & 2033
- Figure 18: Middle East and Africa Recovered Paper Industry Revenue (Million), by Type 2025 & 2033
- Figure 19: Middle East and Africa Recovered Paper Industry Revenue Share (%), by Type 2025 & 2033
- Figure 20: Middle East and Africa Recovered Paper Industry Revenue (Million), by Country 2025 & 2033
- Figure 21: Middle East and Africa Recovered Paper Industry Revenue Share (%), by Country 2025 & 2033
List of Tables
- Table 1: Global Recovered Paper Industry Revenue Million Forecast, by Type 2020 & 2033
- Table 2: Global Recovered Paper Industry Revenue Million Forecast, by Region 2020 & 2033
- Table 3: Global Recovered Paper Industry Revenue Million Forecast, by Type 2020 & 2033
- Table 4: Global Recovered Paper Industry Revenue Million Forecast, by Country 2020 & 2033
- Table 5: Global Recovered Paper Industry Revenue Million Forecast, by Type 2020 & 2033
- Table 6: Global Recovered Paper Industry Revenue Million Forecast, by Country 2020 & 2033
- Table 7: Global Recovered Paper Industry Revenue Million Forecast, by Type 2020 & 2033
- Table 8: Global Recovered Paper Industry Revenue Million Forecast, by Country 2020 & 2033
- Table 9: Global Recovered Paper Industry Revenue Million Forecast, by Type 2020 & 2033
- Table 10: Global Recovered Paper Industry Revenue Million Forecast, by Country 2020 & 2033
- Table 11: Global Recovered Paper Industry Revenue Million Forecast, by Type 2020 & 2033
- Table 12: Global Recovered Paper Industry Revenue Million Forecast, by Country 2020 & 2033
Frequently Asked Questions
1. What is the projected Compound Annual Growth Rate (CAGR) of the Recovered Paper Industry?
The projected CAGR is approximately 2.70%.
2. Which companies are prominent players in the Recovered Paper Industry?
Key companies in the market include International Paper, Tay Paper Recycling Pte Ltd, Smurfit Kappa Group plc, Nine Dragons Paper (Holdings) Limited, Stora Enso Oyj, S A Industrias Celulosa Aragonesa (SAICA), Visy Industrie, DS Smith Plc.
3. What are the main segments of the Recovered Paper Industry?
The market segments include Type.
4. Can you provide details about the market size?
The market size is estimated to be USD XX Million as of 2022.
5. What are some drivers contributing to market growth?
Growth in E-commerce Sales in China; Rising Demand from the Food-service Sector; Growing Consumer Awareness on Paper Packaging; Recycling Initiatives Involving Closed-loop Systems to Aid Market Adoption of Paper Packaging-based Materials.
6. What are the notable trends driving market growth?
Containerboard to Dominate the Market.
7. Are there any restraints impacting market growth?
Recycling. Raw Material Supply Chain Management. and Challenges in the Paper Packaging Industry; Effects of Deforestation on Paper Packaging; Increasing Raw Material Costs and Outsourcing.
8. Can you provide examples of recent developments in the market?
N/A
9. What pricing options are available for accessing the report?
Pricing options include single-user, multi-user, and enterprise licenses priced at USD 4750, USD 5250, and USD 8750 respectively.
10. Is the market size provided in terms of value or volume?
The market size is provided in terms of value, measured in Million.
11. Are there any specific market keywords associated with the report?
Yes, the market keyword associated with the report is "Recovered Paper Industry," which aids in identifying and referencing the specific market segment covered.
12. How do I determine which pricing option suits my needs best?
The pricing options vary based on user requirements and access needs. Individual users may opt for single-user licenses, while businesses requiring broader access may choose multi-user or enterprise licenses for cost-effective access to the report.
13. Are there any additional resources or data provided in the Recovered Paper Industry report?
While the report offers comprehensive insights, it's advisable to review the specific contents or supplementary materials provided to ascertain if additional resources or data are available.
14. How can I stay updated on further developments or reports in the Recovered Paper Industry?
To stay informed about further developments, trends, and reports in the Recovered Paper Industry, consider subscribing to industry newsletters, following relevant companies and organizations, or regularly checking reputable industry news sources and publications.
Methodology
Step 1 - Identification of Relevant Samples Size from Population Database


Step 2 - Approaches for Defining Global Market Size (Value, Volume* & Price*)

Note*: In applicable scenarios
Step 3 - Data Sources
Primary Research
- Web Analytics
- Survey Reports
- Research Institute
- Latest Research Reports
- Opinion Leaders
Secondary Research
- Annual Reports
- White Paper
- Latest Press Release
- Industry Association
- Paid Database
- Investor Presentations

Step 4 - Data Triangulation
Involves using different sources of information in order to increase the validity of a study
These sources are likely to be stakeholders in a program - participants, other researchers, program staff, other community members, and so on.
Then we put all data in single framework & apply various statistical tools to find out the dynamic on the market.
During the analysis stage, feedback from the stakeholder groups would be compared to determine areas of agreement as well as areas of divergence