

Key Insights
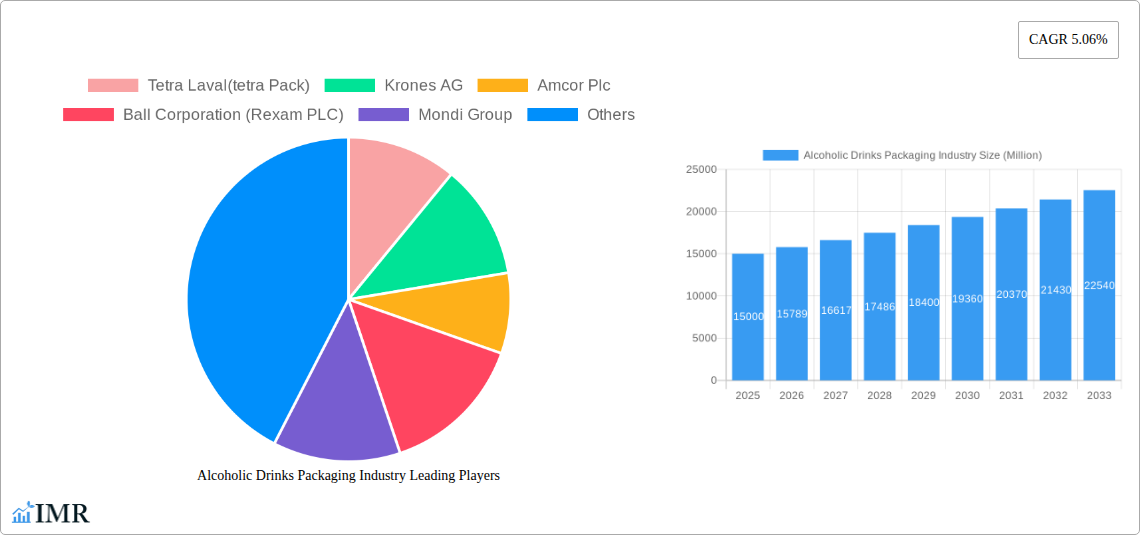
The alcoholic drinks packaging market, valued at $168.08 billion in 2025, is projected for significant expansion with a Compound Annual Growth Rate (CAGR) of 5.05% from 2025 to 2033. Key growth drivers include rising demand for convenient and sustainable packaging, with manufacturers adopting lightweight plastics and eco-friendly paper alternatives. The increasing popularity of craft beers and premium spirits, often featuring distinctive packaging, also fuels market growth. Evolving consumer preferences for individual-serving packages and the expanding e-commerce sector, requiring robust and tamper-evident solutions, are further contributing factors. Challenges include fluctuating raw material prices, stringent regulatory compliance for material safety and recyclability, and growing environmental concerns. The market is segmented by package type (bottles, cans, cartons, jars, pouches), product type (beer, spirits, wine), and material type (plastic, paper, metal, glass). Bottles currently hold the largest market share, followed by cans, due to their protective and shelf-life-enhancing qualities. The Asia Pacific region is anticipated to lead growth, driven by increasing disposable incomes and evolving consumption patterns. Leading companies like Tetra Laval, Krones AG, Amcor, Ball Corporation, and Mondi Group are investing in R&D to advance packaging technologies and meet dynamic consumer and regulatory demands.
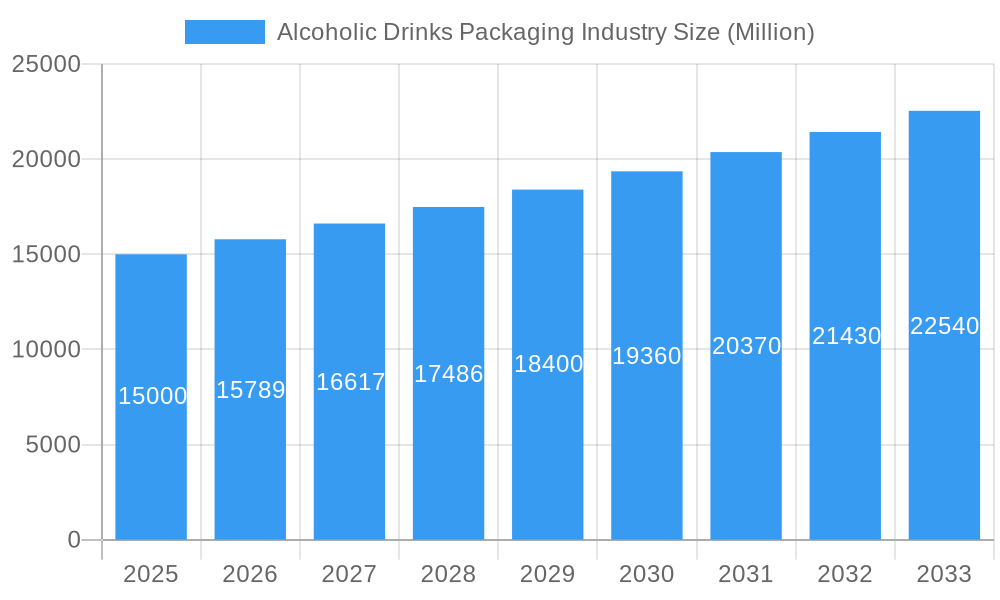
Alcoholic Drinks Packaging Industry Market Size (In Billion)
The competitive environment is marked by intense rivalry, prompting strategic collaborations, mergers, and acquisitions to enhance market share and global reach. Opportunities lie in developing sustainable and innovative packaging that aligns with consumer demand for convenience, aesthetic appeal, and environmental responsibility. Companies are prioritizing production capacity enhancement and the exploration of novel materials. The forecast period (2025-2033) anticipates a continued shift towards eco-conscious packaging, with a potential surge in demand for recyclable and biodegradable options. This underscores the need for effective recycling infrastructure and consumer education on responsible disposal. Regional variations in consumption and regulations will shape future market dynamics, necessitating adaptable strategies from packaging manufacturers.
Alcoholic Drinks Packaging Industry Company Market Share
This report offers a comprehensive analysis of the alcoholic drinks packaging industry, detailing market dynamics, growth trends, regional insights, product landscape, and key player strategies. Covering a study period from 2019-2033, with a base year of 2025 and a forecast period of 2025-2033, this report provides critical insights for industry professionals, investors, and stakeholders. It examines parent markets (Packaging Industry) and child markets (Beer, Wine, Spirits Packaging). Market values are presented in millions of dollars.
Alcoholic Drinks Packaging Industry Market Dynamics & Structure
The alcoholic drinks packaging market is characterized by moderate concentration, with key players like Tetra Laval (Tetra Pak), Krones AG, Amcor Plc, Ball Corporation (Rexam PLC), Mondi Group, Saint Gobain SA, Sidel Inc, and Crown Holdings Incorporated holding significant market share. However, the market also exhibits a considerable number of smaller players, particularly in regional markets. Technological innovation, driven by sustainability concerns and evolving consumer preferences, is a key driver. Stringent regulatory frameworks concerning material safety and labeling are significant factors. Competitive substitutes include alternative packaging materials and formats. The end-user demographic is broad, ranging from individual consumers to large-scale distributors. M&A activity has been moderate in recent years, with xx deals recorded between 2019 and 2024, leading to some consolidation within the market.
- Market Concentration: Moderately concentrated, with top players holding xx% market share in 2024.
- Technological Innovation: Focus on lightweighting, sustainability (recycled and renewable materials), and improved barrier properties.
- Regulatory Landscape: Stringent regulations regarding material safety, labeling, and recyclability.
- Competitive Substitutes: Growing competition from flexible packaging and alternative materials.
- End-User Demographics: Diverse, encompassing individual consumers, retailers, and wholesalers.
- M&A Activity: xx deals recorded between 2019 and 2024, indicating a trend toward consolidation.
- Innovation Barriers: High initial investment costs for new technologies and regulatory compliance challenges.
Alcoholic Drinks Packaging Industry Growth Trends & Insights
The global alcoholic drinks packaging market witnessed substantial growth during the historical period (2019-2024), expanding from xx million units to xx million units in 2024, exhibiting a CAGR of xx%. This growth is attributed to increasing alcoholic beverage consumption globally, particularly in emerging economies, coupled with the rising preference for convenient and attractive packaging formats. Technological disruptions, such as the adoption of lightweighting technologies and sustainable materials, further fueled market expansion. Shifting consumer behavior, with a growing preference for premiumization and personalized experiences, is impacting packaging choices. The forecast period (2025-2033) anticipates continued growth, driven by similar factors, projecting a market size of xx million units by 2033, with a projected CAGR of xx%. Market penetration of sustainable packaging is expected to increase significantly during this period.
Dominant Regions, Countries, or Segments in Alcoholic Drinks Packaging Industry
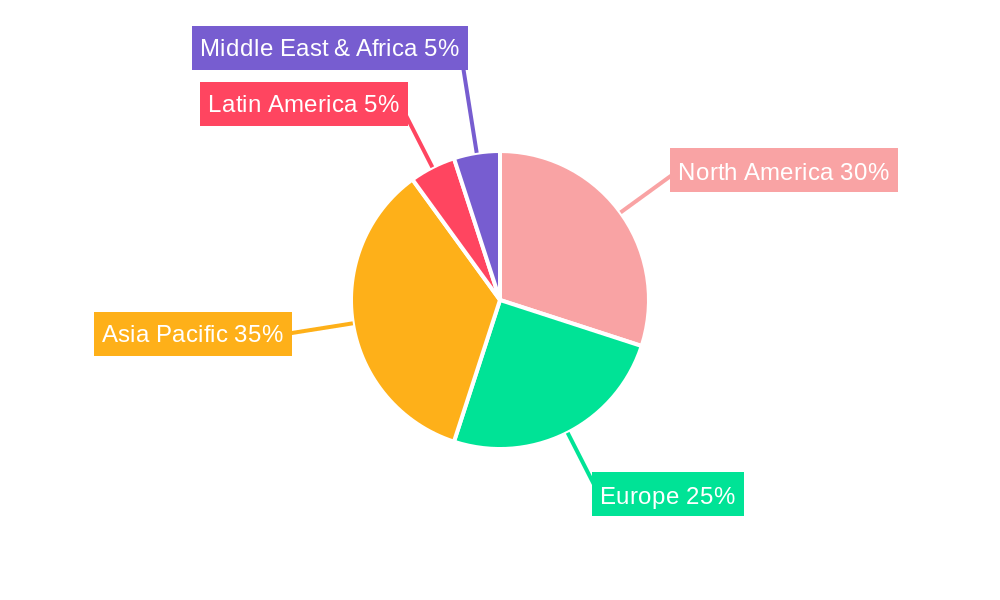
North America and Europe currently dominate the alcoholic drinks packaging market, accounting for xx% of the global market share in 2024. Within these regions, the United States and Germany are leading countries. However, significant growth potential exists in Asia-Pacific and Latin America due to rising disposable incomes and increasing alcoholic beverage consumption.
By Package Type: Bottles remain the dominant package type, followed by metal cans and cartons. The growth of pouches and other innovative formats is gaining momentum.
- Bottles: Holds the largest market share (xx%) in 2024 due to its established position and adaptability.
- Metal Cans: Strong growth driven by their recyclability and suitability for various alcoholic beverages.
- Cartons: Increasing popularity due to cost-effectiveness and sustainability aspects.
- Key Drivers: Growing demand for alcoholic beverages, increasing disposable incomes in emerging economies, and government policies promoting eco-friendly packaging.
By Product: Beer packaging dominates the market followed by wine and spirits. The “Other Products” category, which includes ready-to-drink cocktails and other alcoholic beverages is also experiencing considerable growth.
- Beer: Largest market segment (xx%) in 2024, driven by high consumption levels globally.
- Wine: Significant market share (xx%) due to premiumization and growing popularity of wine.
- Spirits: Growing at a faster rate than beer and wine (xx% CAGR) due to increased consumption of premium spirits and diverse product offerings.
By Material: Glass remains a significant material despite increasing competition from alternative materials due to its perceived quality and aesthetic appeal. However, plastic and metal are gaining traction due to their lightweight nature, cost-effectiveness, and recyclability.
- Glass: Strong market share (xx%) but facing challenges due to weight and fragility.
- Plastic: Growing market share due to lightweighting and versatility.
- Metal: Significant market share and growing popularity due to recyclability and barrier properties.
Alcoholic Drinks Packaging Industry Product Landscape
The alcoholic drinks packaging market is witnessing a proliferation of innovative products, focused on enhancing sustainability, convenience, and brand appeal. Lightweighting technologies are prevalent, using less material while maintaining product integrity. Improved barrier properties are crucial for extending shelf life and preventing spoilage. Consumer-friendly features, such as resealable closures and tamper-evident seals, are becoming standard. Furthermore, the integration of smart packaging technologies, enabling traceability and product authentication, is gaining traction.
Key Drivers, Barriers & Challenges in Alcoholic Drinks Packaging Industry
Key Drivers:
- Growing global consumption of alcoholic beverages.
- Increasing disposable incomes, particularly in emerging markets.
- Growing preference for convenient, sustainable, and aesthetically pleasing packaging.
- Technological advancements in packaging materials and manufacturing processes.
Challenges:
- Fluctuating raw material prices.
- Stringent environmental regulations and sustainability concerns.
- Intense competition among packaging manufacturers.
- Supply chain disruptions and logistical challenges. Estimated impact of supply chain issues on market growth in 2024: xx%.
Emerging Opportunities in Alcoholic Drinks Packaging Industry
- Growing demand for sustainable and eco-friendly packaging solutions.
- Increasing adoption of lightweighting and smart packaging technologies.
- Expansion into emerging markets with high growth potential.
- Customization and personalization of packaging to enhance brand appeal.
Growth Accelerators in the Alcoholic Drinks Packaging Industry Industry
Technological advancements, including the development of innovative materials and manufacturing processes, are key growth accelerators. Strategic partnerships between packaging manufacturers and beverage companies are facilitating the adoption of new technologies and sustainable practices. Market expansion into new geographic regions and diversification into new product segments also contribute to growth.
Key Players Shaping the Alcoholic Drinks Packaging Industry Market
- Tetra Laval (Tetra Pak)
- Krones AG
- Amcor Plc
- Ball Corporation (Rexam PLC)
- Mondi Group
- Saint Gobain SA
- Sidel Inc
- Crown Holdings Incorporated
Notable Milestones in Alcoholic Drinks Packaging Industry Sector
- 2020: Amcor Plc launches a new range of sustainable packaging solutions for alcoholic beverages.
- 2021: Tetra Pak introduces a recyclable carton for wine.
- 2022: Ball Corporation expands its production capacity for aluminum cans.
- 2023: Krones AG develops a new high-speed bottling line for spirits.
- 2024: Mondi Group partners with a major brewery to develop a paper-based bottle.
In-Depth Alcoholic Drinks Packaging Industry Market Outlook
The alcoholic drinks packaging market is poised for continued growth in the coming years, driven by factors such as increasing alcoholic beverage consumption, rising demand for sustainable packaging, and technological innovations. Strategic partnerships and investments in research and development will play a crucial role in shaping the future of the industry. The market is expected to reach xx million units by 2033, offering significant opportunities for both established players and new entrants.
Alcoholic Drinks Packaging Industry Segmentation
-
1. Material
- 1.1. Plastic
- 1.2. Paper
- 1.3. Metal
- 1.4. Glass
- 1.5. Other Materials
-
2. Package Type
- 2.1. Bottles
- 2.2. Metal Cans
- 2.3. Cartons
- 2.4. Jars
- 2.5. Pouches
- 2.6. Other Package Types
-
3. Product
- 3.1. Beer
- 3.2. Spirit
- 3.3. Wine
- 3.4. Other Products
Alcoholic Drinks Packaging Industry Segmentation By Geography
-
1. North America
- 1.1. United States
- 1.2. Canada
-
2. Europe
- 2.1. Germany
- 2.2. United Kingdom
- 2.3. France
- 2.4. Rest of Europe
-
3. Asia Pacific
- 3.1. China
- 3.2. Japan
- 3.3. India
- 3.4. Rest of Asia Pacific
-
4. Latin America
- 4.1. Brazil
- 4.2. Argentina
- 4.3. Mexico
- 4.4. Rest of Latin America
- 5. Middle East
-
6. UAE
- 6.1. South Africa
- 6.2. Rest of Middle East
Alcoholic Drinks Packaging Industry Regional Market Share
Geographic Coverage of Alcoholic Drinks Packaging Industry
Alcoholic Drinks Packaging Industry REPORT HIGHLIGHTS
| Aspects | Details |
|---|---|
| Study Period | 2020-2034 |
| Base Year | 2025 |
| Estimated Year | 2026 |
| Forecast Period | 2026-2034 |
| Historical Period | 2020-2025 |
| Growth Rate | CAGR of 5.05% from 2020-2034 |
| Segmentation |
|
Table of Contents
- 1. Introduction
- 1.1. Research Scope
- 1.2. Market Segmentation
- 1.3. Research Objective
- 1.4. Definitions and Assumptions
- 2. Executive Summary
- 2.1. Market Snapshot
- 3. Market Dynamics
- 3.1. Market Drivers
- 3.2. Market Restrains
- 3.3. Market Trends
- 3.4. Market Opportunities
- 4. Market Factor Analysis
- 4.1. Porters Five Forces
- 4.1.1. Bargaining Power of Suppliers
- 4.1.2. Bargaining Power of Buyers
- 4.1.3. Threat of New Entrants
- 4.1.4. Threat of Substitutes
- 4.1.5. Competitive Rivalry
- 4.2. PESTEL analysis
- 4.3. BCG Analysis
- 4.3.1. Stars (High Growth, High Market Share)
- 4.3.2. Cash Cows (Low Growth, High Market Share)
- 4.3.3. Question Mark (High Growth, Low Market Share)
- 4.3.4. Dogs (Low Growth, Low Market Share)
- 4.4. Ansoff Matrix Analysis
- 4.5. Supply Chain Analysis
- 4.6. Regulatory Landscape
- 4.7. Current Market Potential and Opportunity Assessment (TAM–SAM–SOM Framework)
- 4.8. IMR Analyst Note
- 4.1. Porters Five Forces
- 5. Market Analysis, Insights and Forecast 2021-2033
- 5.1. Market Analysis, Insights and Forecast - by Material
- 5.1.1. Plastic
- 5.1.2. Paper
- 5.1.3. Metal
- 5.1.4. Glass
- 5.1.5. Other Materials
- 5.2. Market Analysis, Insights and Forecast - by Package Type
- 5.2.1. Bottles
- 5.2.2. Metal Cans
- 5.2.3. Cartons
- 5.2.4. Jars
- 5.2.5. Pouches
- 5.2.6. Other Package Types
- 5.3. Market Analysis, Insights and Forecast - by Product
- 5.3.1. Beer
- 5.3.2. Spirit
- 5.3.3. Wine
- 5.3.4. Other Products
- 5.4. Market Analysis, Insights and Forecast - by Region
- 5.4.1. North America
- 5.4.2. Europe
- 5.4.3. Asia Pacific
- 5.4.4. Latin America
- 5.4.5. Middle East
- 5.4.6. UAE
- 5.1. Market Analysis, Insights and Forecast - by Material
- 6. Global Alcoholic Drinks Packaging Industry Analysis, Insights and Forecast, 2021-2033
- 6.1. Market Analysis, Insights and Forecast - by Material
- 6.1.1. Plastic
- 6.1.2. Paper
- 6.1.3. Metal
- 6.1.4. Glass
- 6.1.5. Other Materials
- 6.2. Market Analysis, Insights and Forecast - by Package Type
- 6.2.1. Bottles
- 6.2.2. Metal Cans
- 6.2.3. Cartons
- 6.2.4. Jars
- 6.2.5. Pouches
- 6.2.6. Other Package Types
- 6.3. Market Analysis, Insights and Forecast - by Product
- 6.3.1. Beer
- 6.3.2. Spirit
- 6.3.3. Wine
- 6.3.4. Other Products
- 6.1. Market Analysis, Insights and Forecast - by Material
- 7. North America Alcoholic Drinks Packaging Industry Analysis, Insights and Forecast, 2020-2032
- 7.1. Market Analysis, Insights and Forecast - by Material
- 7.1.1. Plastic
- 7.1.2. Paper
- 7.1.3. Metal
- 7.1.4. Glass
- 7.1.5. Other Materials
- 7.2. Market Analysis, Insights and Forecast - by Package Type
- 7.2.1. Bottles
- 7.2.2. Metal Cans
- 7.2.3. Cartons
- 7.2.4. Jars
- 7.2.5. Pouches
- 7.2.6. Other Package Types
- 7.3. Market Analysis, Insights and Forecast - by Product
- 7.3.1. Beer
- 7.3.2. Spirit
- 7.3.3. Wine
- 7.3.4. Other Products
- 7.1. Market Analysis, Insights and Forecast - by Material
- 8. Europe Alcoholic Drinks Packaging Industry Analysis, Insights and Forecast, 2020-2032
- 8.1. Market Analysis, Insights and Forecast - by Material
- 8.1.1. Plastic
- 8.1.2. Paper
- 8.1.3. Metal
- 8.1.4. Glass
- 8.1.5. Other Materials
- 8.2. Market Analysis, Insights and Forecast - by Package Type
- 8.2.1. Bottles
- 8.2.2. Metal Cans
- 8.2.3. Cartons
- 8.2.4. Jars
- 8.2.5. Pouches
- 8.2.6. Other Package Types
- 8.3. Market Analysis, Insights and Forecast - by Product
- 8.3.1. Beer
- 8.3.2. Spirit
- 8.3.3. Wine
- 8.3.4. Other Products
- 8.1. Market Analysis, Insights and Forecast - by Material
- 9. Asia Pacific Alcoholic Drinks Packaging Industry Analysis, Insights and Forecast, 2020-2032
- 9.1. Market Analysis, Insights and Forecast - by Material
- 9.1.1. Plastic
- 9.1.2. Paper
- 9.1.3. Metal
- 9.1.4. Glass
- 9.1.5. Other Materials
- 9.2. Market Analysis, Insights and Forecast - by Package Type
- 9.2.1. Bottles
- 9.2.2. Metal Cans
- 9.2.3. Cartons
- 9.2.4. Jars
- 9.2.5. Pouches
- 9.2.6. Other Package Types
- 9.3. Market Analysis, Insights and Forecast - by Product
- 9.3.1. Beer
- 9.3.2. Spirit
- 9.3.3. Wine
- 9.3.4. Other Products
- 9.1. Market Analysis, Insights and Forecast - by Material
- 10. Latin America Alcoholic Drinks Packaging Industry Analysis, Insights and Forecast, 2020-2032
- 10.1. Market Analysis, Insights and Forecast - by Material
- 10.1.1. Plastic
- 10.1.2. Paper
- 10.1.3. Metal
- 10.1.4. Glass
- 10.1.5. Other Materials
- 10.2. Market Analysis, Insights and Forecast - by Package Type
- 10.2.1. Bottles
- 10.2.2. Metal Cans
- 10.2.3. Cartons
- 10.2.4. Jars
- 10.2.5. Pouches
- 10.2.6. Other Package Types
- 10.3. Market Analysis, Insights and Forecast - by Product
- 10.3.1. Beer
- 10.3.2. Spirit
- 10.3.3. Wine
- 10.3.4. Other Products
- 10.1. Market Analysis, Insights and Forecast - by Material
- 11. Middle East Alcoholic Drinks Packaging Industry Analysis, Insights and Forecast, 2020-2032
- 11.1. Market Analysis, Insights and Forecast - by Material
- 11.1.1. Plastic
- 11.1.2. Paper
- 11.1.3. Metal
- 11.1.4. Glass
- 11.1.5. Other Materials
- 11.2. Market Analysis, Insights and Forecast - by Package Type
- 11.2.1. Bottles
- 11.2.2. Metal Cans
- 11.2.3. Cartons
- 11.2.4. Jars
- 11.2.5. Pouches
- 11.2.6. Other Package Types
- 11.3. Market Analysis, Insights and Forecast - by Product
- 11.3.1. Beer
- 11.3.2. Spirit
- 11.3.3. Wine
- 11.3.4. Other Products
- 11.1. Market Analysis, Insights and Forecast - by Material
- 12. UAE Alcoholic Drinks Packaging Industry Analysis, Insights and Forecast, 2020-2032
- 12.1. Market Analysis, Insights and Forecast - by Material
- 12.1.1. Plastic
- 12.1.2. Paper
- 12.1.3. Metal
- 12.1.4. Glass
- 12.1.5. Other Materials
- 12.2. Market Analysis, Insights and Forecast - by Package Type
- 12.2.1. Bottles
- 12.2.2. Metal Cans
- 12.2.3. Cartons
- 12.2.4. Jars
- 12.2.5. Pouches
- 12.2.6. Other Package Types
- 12.3. Market Analysis, Insights and Forecast - by Product
- 12.3.1. Beer
- 12.3.2. Spirit
- 12.3.3. Wine
- 12.3.4. Other Products
- 12.1. Market Analysis, Insights and Forecast - by Material
- 13. Competitive Analysis
- 13.1. Company Profiles
- 13.1.1 Tetra Laval(tetra Pack)
- 13.1.1.1. Company Overview
- 13.1.1.2. Products
- 13.1.1.3. Company Financials
- 13.1.1.4. SWOT Analysis
- 13.1.2 Krones AG
- 13.1.2.1. Company Overview
- 13.1.2.2. Products
- 13.1.2.3. Company Financials
- 13.1.2.4. SWOT Analysis
- 13.1.3 Amcor Plc
- 13.1.3.1. Company Overview
- 13.1.3.2. Products
- 13.1.3.3. Company Financials
- 13.1.3.4. SWOT Analysis
- 13.1.4 Ball Corporation (Rexam PLC)
- 13.1.4.1. Company Overview
- 13.1.4.2. Products
- 13.1.4.3. Company Financials
- 13.1.4.4. SWOT Analysis
- 13.1.5 Mondi Group
- 13.1.5.1. Company Overview
- 13.1.5.2. Products
- 13.1.5.3. Company Financials
- 13.1.5.4. SWOT Analysis
- 13.1.6 Saint Gobain SA
- 13.1.6.1. Company Overview
- 13.1.6.2. Products
- 13.1.6.3. Company Financials
- 13.1.6.4. SWOT Analysis
- 13.1.7 Sidel Inc *List Not Exhaustive
- 13.1.7.1. Company Overview
- 13.1.7.2. Products
- 13.1.7.3. Company Financials
- 13.1.7.4. SWOT Analysis
- 13.1.8 Crown Holdings Incorporated
- 13.1.8.1. Company Overview
- 13.1.8.2. Products
- 13.1.8.3. Company Financials
- 13.1.8.4. SWOT Analysis
- 13.1.1 Tetra Laval(tetra Pack)
- 13.2. Market Entropy
- 13.2.1 Company's Key Areas Served
- 13.2.2 Recent Developments
- 13.3. Company Market Share Analysis 2025
- 13.3.1 Top 5 Companies Market Share Analysis
- 13.3.2 Top 3 Companies Market Share Analysis
- 13.4. List of Potential Customers
- 14. Research Methodology
List of Figures
- Figure 1: Global Alcoholic Drinks Packaging Industry Revenue Breakdown (billion, %) by Region 2025 & 2033
- Figure 2: North America Alcoholic Drinks Packaging Industry Revenue (billion), by Material 2025 & 2033
- Figure 3: North America Alcoholic Drinks Packaging Industry Revenue Share (%), by Material 2025 & 2033
- Figure 4: North America Alcoholic Drinks Packaging Industry Revenue (billion), by Package Type 2025 & 2033
- Figure 5: North America Alcoholic Drinks Packaging Industry Revenue Share (%), by Package Type 2025 & 2033
- Figure 6: North America Alcoholic Drinks Packaging Industry Revenue (billion), by Product 2025 & 2033
- Figure 7: North America Alcoholic Drinks Packaging Industry Revenue Share (%), by Product 2025 & 2033
- Figure 8: North America Alcoholic Drinks Packaging Industry Revenue (billion), by Country 2025 & 2033
- Figure 9: North America Alcoholic Drinks Packaging Industry Revenue Share (%), by Country 2025 & 2033
- Figure 10: Europe Alcoholic Drinks Packaging Industry Revenue (billion), by Material 2025 & 2033
- Figure 11: Europe Alcoholic Drinks Packaging Industry Revenue Share (%), by Material 2025 & 2033
- Figure 12: Europe Alcoholic Drinks Packaging Industry Revenue (billion), by Package Type 2025 & 2033
- Figure 13: Europe Alcoholic Drinks Packaging Industry Revenue Share (%), by Package Type 2025 & 2033
- Figure 14: Europe Alcoholic Drinks Packaging Industry Revenue (billion), by Product 2025 & 2033
- Figure 15: Europe Alcoholic Drinks Packaging Industry Revenue Share (%), by Product 2025 & 2033
- Figure 16: Europe Alcoholic Drinks Packaging Industry Revenue (billion), by Country 2025 & 2033
- Figure 17: Europe Alcoholic Drinks Packaging Industry Revenue Share (%), by Country 2025 & 2033
- Figure 18: Asia Pacific Alcoholic Drinks Packaging Industry Revenue (billion), by Material 2025 & 2033
- Figure 19: Asia Pacific Alcoholic Drinks Packaging Industry Revenue Share (%), by Material 2025 & 2033
- Figure 20: Asia Pacific Alcoholic Drinks Packaging Industry Revenue (billion), by Package Type 2025 & 2033
- Figure 21: Asia Pacific Alcoholic Drinks Packaging Industry Revenue Share (%), by Package Type 2025 & 2033
- Figure 22: Asia Pacific Alcoholic Drinks Packaging Industry Revenue (billion), by Product 2025 & 2033
- Figure 23: Asia Pacific Alcoholic Drinks Packaging Industry Revenue Share (%), by Product 2025 & 2033
- Figure 24: Asia Pacific Alcoholic Drinks Packaging Industry Revenue (billion), by Country 2025 & 2033
- Figure 25: Asia Pacific Alcoholic Drinks Packaging Industry Revenue Share (%), by Country 2025 & 2033
- Figure 26: Latin America Alcoholic Drinks Packaging Industry Revenue (billion), by Material 2025 & 2033
- Figure 27: Latin America Alcoholic Drinks Packaging Industry Revenue Share (%), by Material 2025 & 2033
- Figure 28: Latin America Alcoholic Drinks Packaging Industry Revenue (billion), by Package Type 2025 & 2033
- Figure 29: Latin America Alcoholic Drinks Packaging Industry Revenue Share (%), by Package Type 2025 & 2033
- Figure 30: Latin America Alcoholic Drinks Packaging Industry Revenue (billion), by Product 2025 & 2033
- Figure 31: Latin America Alcoholic Drinks Packaging Industry Revenue Share (%), by Product 2025 & 2033
- Figure 32: Latin America Alcoholic Drinks Packaging Industry Revenue (billion), by Country 2025 & 2033
- Figure 33: Latin America Alcoholic Drinks Packaging Industry Revenue Share (%), by Country 2025 & 2033
- Figure 34: Middle East Alcoholic Drinks Packaging Industry Revenue (billion), by Material 2025 & 2033
- Figure 35: Middle East Alcoholic Drinks Packaging Industry Revenue Share (%), by Material 2025 & 2033
- Figure 36: Middle East Alcoholic Drinks Packaging Industry Revenue (billion), by Package Type 2025 & 2033
- Figure 37: Middle East Alcoholic Drinks Packaging Industry Revenue Share (%), by Package Type 2025 & 2033
- Figure 38: Middle East Alcoholic Drinks Packaging Industry Revenue (billion), by Product 2025 & 2033
- Figure 39: Middle East Alcoholic Drinks Packaging Industry Revenue Share (%), by Product 2025 & 2033
- Figure 40: Middle East Alcoholic Drinks Packaging Industry Revenue (billion), by Country 2025 & 2033
- Figure 41: Middle East Alcoholic Drinks Packaging Industry Revenue Share (%), by Country 2025 & 2033
- Figure 42: UAE Alcoholic Drinks Packaging Industry Revenue (billion), by Material 2025 & 2033
- Figure 43: UAE Alcoholic Drinks Packaging Industry Revenue Share (%), by Material 2025 & 2033
- Figure 44: UAE Alcoholic Drinks Packaging Industry Revenue (billion), by Package Type 2025 & 2033
- Figure 45: UAE Alcoholic Drinks Packaging Industry Revenue Share (%), by Package Type 2025 & 2033
- Figure 46: UAE Alcoholic Drinks Packaging Industry Revenue (billion), by Product 2025 & 2033
- Figure 47: UAE Alcoholic Drinks Packaging Industry Revenue Share (%), by Product 2025 & 2033
- Figure 48: UAE Alcoholic Drinks Packaging Industry Revenue (billion), by Country 2025 & 2033
- Figure 49: UAE Alcoholic Drinks Packaging Industry Revenue Share (%), by Country 2025 & 2033
List of Tables
- Table 1: Global Alcoholic Drinks Packaging Industry Revenue billion Forecast, by Material 2020 & 2033
- Table 2: Global Alcoholic Drinks Packaging Industry Revenue billion Forecast, by Package Type 2020 & 2033
- Table 3: Global Alcoholic Drinks Packaging Industry Revenue billion Forecast, by Product 2020 & 2033
- Table 4: Global Alcoholic Drinks Packaging Industry Revenue billion Forecast, by Region 2020 & 2033
- Table 5: Global Alcoholic Drinks Packaging Industry Revenue billion Forecast, by Material 2020 & 2033
- Table 6: Global Alcoholic Drinks Packaging Industry Revenue billion Forecast, by Package Type 2020 & 2033
- Table 7: Global Alcoholic Drinks Packaging Industry Revenue billion Forecast, by Product 2020 & 2033
- Table 8: Global Alcoholic Drinks Packaging Industry Revenue billion Forecast, by Country 2020 & 2033
- Table 9: United States Alcoholic Drinks Packaging Industry Revenue (billion) Forecast, by Application 2020 & 2033
- Table 10: Canada Alcoholic Drinks Packaging Industry Revenue (billion) Forecast, by Application 2020 & 2033
- Table 11: Global Alcoholic Drinks Packaging Industry Revenue billion Forecast, by Material 2020 & 2033
- Table 12: Global Alcoholic Drinks Packaging Industry Revenue billion Forecast, by Package Type 2020 & 2033
- Table 13: Global Alcoholic Drinks Packaging Industry Revenue billion Forecast, by Product 2020 & 2033
- Table 14: Global Alcoholic Drinks Packaging Industry Revenue billion Forecast, by Country 2020 & 2033
- Table 15: Germany Alcoholic Drinks Packaging Industry Revenue (billion) Forecast, by Application 2020 & 2033
- Table 16: United Kingdom Alcoholic Drinks Packaging Industry Revenue (billion) Forecast, by Application 2020 & 2033
- Table 17: France Alcoholic Drinks Packaging Industry Revenue (billion) Forecast, by Application 2020 & 2033
- Table 18: Rest of Europe Alcoholic Drinks Packaging Industry Revenue (billion) Forecast, by Application 2020 & 2033
- Table 19: Global Alcoholic Drinks Packaging Industry Revenue billion Forecast, by Material 2020 & 2033
- Table 20: Global Alcoholic Drinks Packaging Industry Revenue billion Forecast, by Package Type 2020 & 2033
- Table 21: Global Alcoholic Drinks Packaging Industry Revenue billion Forecast, by Product 2020 & 2033
- Table 22: Global Alcoholic Drinks Packaging Industry Revenue billion Forecast, by Country 2020 & 2033
- Table 23: China Alcoholic Drinks Packaging Industry Revenue (billion) Forecast, by Application 2020 & 2033
- Table 24: Japan Alcoholic Drinks Packaging Industry Revenue (billion) Forecast, by Application 2020 & 2033
- Table 25: India Alcoholic Drinks Packaging Industry Revenue (billion) Forecast, by Application 2020 & 2033
- Table 26: Rest of Asia Pacific Alcoholic Drinks Packaging Industry Revenue (billion) Forecast, by Application 2020 & 2033
- Table 27: Global Alcoholic Drinks Packaging Industry Revenue billion Forecast, by Material 2020 & 2033
- Table 28: Global Alcoholic Drinks Packaging Industry Revenue billion Forecast, by Package Type 2020 & 2033
- Table 29: Global Alcoholic Drinks Packaging Industry Revenue billion Forecast, by Product 2020 & 2033
- Table 30: Global Alcoholic Drinks Packaging Industry Revenue billion Forecast, by Country 2020 & 2033
- Table 31: Brazil Alcoholic Drinks Packaging Industry Revenue (billion) Forecast, by Application 2020 & 2033
- Table 32: Argentina Alcoholic Drinks Packaging Industry Revenue (billion) Forecast, by Application 2020 & 2033
- Table 33: Mexico Alcoholic Drinks Packaging Industry Revenue (billion) Forecast, by Application 2020 & 2033
- Table 34: Rest of Latin America Alcoholic Drinks Packaging Industry Revenue (billion) Forecast, by Application 2020 & 2033
- Table 35: Global Alcoholic Drinks Packaging Industry Revenue billion Forecast, by Material 2020 & 2033
- Table 36: Global Alcoholic Drinks Packaging Industry Revenue billion Forecast, by Package Type 2020 & 2033
- Table 37: Global Alcoholic Drinks Packaging Industry Revenue billion Forecast, by Product 2020 & 2033
- Table 38: Global Alcoholic Drinks Packaging Industry Revenue billion Forecast, by Country 2020 & 2033
- Table 39: Global Alcoholic Drinks Packaging Industry Revenue billion Forecast, by Material 2020 & 2033
- Table 40: Global Alcoholic Drinks Packaging Industry Revenue billion Forecast, by Package Type 2020 & 2033
- Table 41: Global Alcoholic Drinks Packaging Industry Revenue billion Forecast, by Product 2020 & 2033
- Table 42: Global Alcoholic Drinks Packaging Industry Revenue billion Forecast, by Country 2020 & 2033
- Table 43: South Africa Alcoholic Drinks Packaging Industry Revenue (billion) Forecast, by Application 2020 & 2033
- Table 44: Rest of Middle East Alcoholic Drinks Packaging Industry Revenue (billion) Forecast, by Application 2020 & 2033
Frequently Asked Questions
1. What is the projected Compound Annual Growth Rate (CAGR) of the Alcoholic Drinks Packaging Industry?
The projected CAGR is approximately 5.05%.
2. Which companies are prominent players in the Alcoholic Drinks Packaging Industry?
Key companies in the market include Tetra Laval(tetra Pack), Krones AG, Amcor Plc, Ball Corporation (Rexam PLC), Mondi Group, Saint Gobain SA, Sidel Inc *List Not Exhaustive, Crown Holdings Incorporated.
3. What are the main segments of the Alcoholic Drinks Packaging Industry?
The market segments include Material, Package Type, Product.
4. Can you provide details about the market size?
The market size is estimated to be USD 168.08 billion as of 2022.
5. What are some drivers contributing to market growth?
; Increasing Prosperity and Urbanization; Rising Innovations in the Packaging Industry.
6. What are the notable trends driving market growth?
Glass Packing Accounts for the Largest Share in the Market.
7. Are there any restraints impacting market growth?
; Fluctuating Raw Material Prices.
8. Can you provide examples of recent developments in the market?
N/A
9. What pricing options are available for accessing the report?
Pricing options include single-user, multi-user, and enterprise licenses priced at USD 4750, USD 5250, and USD 8750 respectively.
10. Is the market size provided in terms of value or volume?
The market size is provided in terms of value, measured in billion.
11. Are there any specific market keywords associated with the report?
Yes, the market keyword associated with the report is "Alcoholic Drinks Packaging Industry," which aids in identifying and referencing the specific market segment covered.
12. How do I determine which pricing option suits my needs best?
The pricing options vary based on user requirements and access needs. Individual users may opt for single-user licenses, while businesses requiring broader access may choose multi-user or enterprise licenses for cost-effective access to the report.
13. Are there any additional resources or data provided in the Alcoholic Drinks Packaging Industry report?
While the report offers comprehensive insights, it's advisable to review the specific contents or supplementary materials provided to ascertain if additional resources or data are available.
14. How can I stay updated on further developments or reports in the Alcoholic Drinks Packaging Industry?
To stay informed about further developments, trends, and reports in the Alcoholic Drinks Packaging Industry, consider subscribing to industry newsletters, following relevant companies and organizations, or regularly checking reputable industry news sources and publications.
Methodology
Step 1 - Identification of Relevant Samples Size from Population Database


Step 2 - Approaches for Defining Global Market Size (Value, Volume* & Price*)

Note*: In applicable scenarios
Step 3 - Data Sources
Primary Research
- Web Analytics
- Survey Reports
- Research Institute
- Latest Research Reports
- Opinion Leaders
Secondary Research
- Annual Reports
- White Paper
- Latest Press Release
- Industry Association
- Paid Database
- Investor Presentations

Step 4 - Data Triangulation
Involves using different sources of information in order to increase the validity of a study
These sources are likely to be stakeholders in a program - participants, other researchers, program staff, other community members, and so on.
Then we put all data in single framework & apply various statistical tools to find out the dynamic on the market.
During the analysis stage, feedback from the stakeholder groups would be compared to determine areas of agreement as well as areas of divergence