

Key Insights
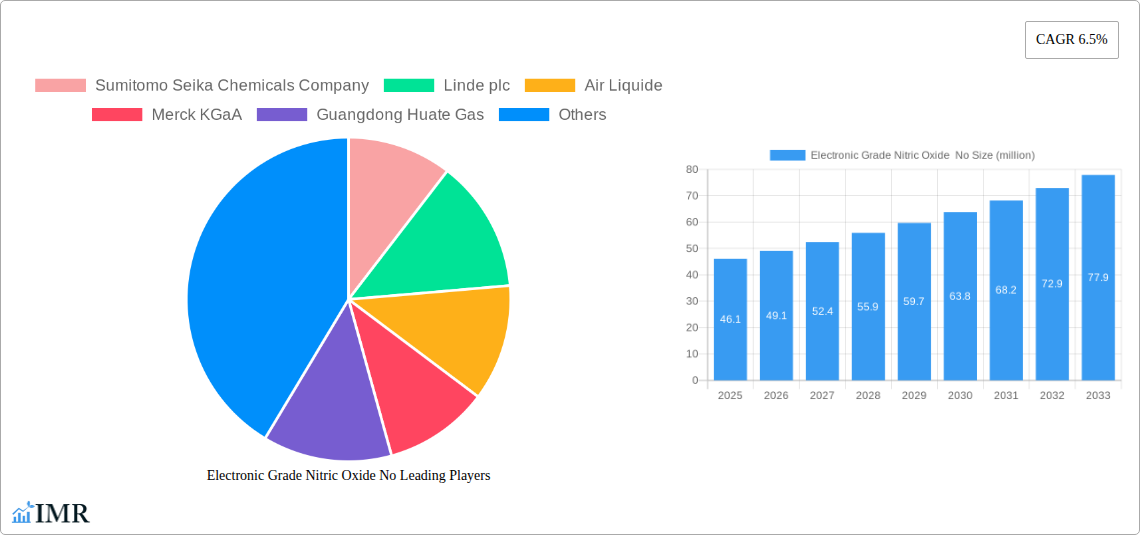
The Electronic Grade Nitric Oxide (NO) market, valued at $46.1 million in 2025, is projected to experience robust growth, driven by the increasing demand for advanced semiconductor manufacturing and related applications. A Compound Annual Growth Rate (CAGR) of 6.5% from 2025 to 2033 indicates a significant expansion of the market to approximately $75 million by 2033. Key drivers include the rising adoption of sophisticated technologies in electronics, such as 5G and beyond-5G infrastructure development and the expanding use of NO in etching and deposition processes within the semiconductor industry. Furthermore, increasing investments in research and development within the semiconductor sector are fueling innovation, leading to a higher demand for high-purity Electronic Grade NO. This growth is further propelled by the miniaturization trend in electronics, requiring increasingly precise and controlled manufacturing processes. Competitive players like Sumitomo Seika Chemicals, Linde plc, Air Liquide, Merck KGaA, Guangdong Huate Gas, and Linggas, Ltd. are actively participating in this expanding market.
The market's growth is anticipated to be relatively steady, although potential restraints include fluctuations in raw material prices and stringent regulatory compliance requirements regarding the handling and transportation of NO. However, these factors are likely to have a limited impact on the overall positive growth trajectory. The segmentation of the market, though currently unspecified, likely reflects differences in purity levels, packaging formats, and end-use applications. Future market analysis should focus on gaining a deeper understanding of these segments to accurately assess market potential within each area. Regional differences in semiconductor manufacturing capacity and technological adoption rates will also play a significant role in shaping the geographical distribution of the Electronic Grade NO market.
Electronic Grade Nitric Oxide (NO) Market Report: 2019-2033
This comprehensive report provides a detailed analysis of the Electronic Grade Nitric Oxide (NO) market, offering in-depth insights into market dynamics, growth trends, key players, and future opportunities. The study period covers 2019-2033, with a base year of 2025 and a forecast period of 2025-2033. This report is invaluable for industry professionals, investors, and researchers seeking a complete understanding of this dynamic market.
Electronic Grade Nitric Oxide (NO) Market Dynamics & Structure
The Electronic Grade Nitric Oxide market is characterized by moderate concentration, with key players like Sumitomo Seika Chemicals Company, Linde plc, Air Liquide, Merck KGaA, Guangdong Huate Gas, and Linggas, Ltd. dominating the landscape. Technological advancements, particularly in purification and delivery systems, are driving market growth. Stringent regulatory frameworks concerning gas handling and safety significantly influence market operations. The market faces competition from alternative materials and technologies in specific applications, yet the unique properties of Electronic Grade Nitric Oxide continue to secure its position. M&A activity has been relatively limited in recent years (xx deals in the past 5 years), reflecting the established nature of the market and high entry barriers.
- Market Concentration: Moderately concentrated, with top 5 players holding approximately xx% market share in 2024.
- Technological Innovation: Focus on improving purity, reducing impurities, and developing efficient delivery systems.
- Regulatory Framework: Stringent safety and handling regulations impacting operational costs and market entry.
- Competitive Substitutes: Limited, due to the unique properties of Electronic Grade Nitric Oxide in specific applications.
- End-User Demographics: Primarily focused on the semiconductor and electronics industries, with emerging applications in research and development.
- M&A Trends: Low level of activity in recent years, with focus on organic growth and technological advancements.
Electronic Grade Nitric Oxide (NO) Growth Trends & Insights
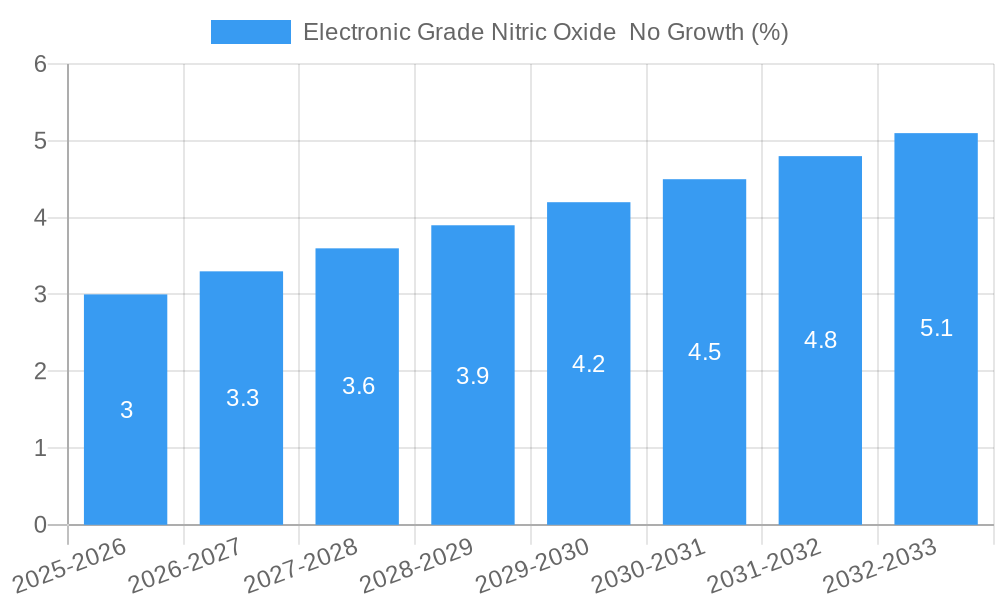
The Electronic Grade Nitric Oxide market experienced robust growth during the historical period (2019-2024), driven primarily by increasing demand from the semiconductor industry. The market size reached xx million units in 2024, exhibiting a Compound Annual Growth Rate (CAGR) of xx% during this period. This growth is expected to continue throughout the forecast period (2025-2033), albeit at a slightly moderated pace. Technological advancements, such as the development of more precise and efficient delivery systems, are fueling market expansion. Consumer behavior shifts towards higher-quality electronic components and increasing adoption of advanced semiconductor technologies further contribute to market growth. The market penetration in key end-use sectors is expected to reach xx% by 2033. (Further detailed analysis provided within the full report).
Dominant Regions, Countries, or Segments in Electronic Grade Nitric Oxide (NO)
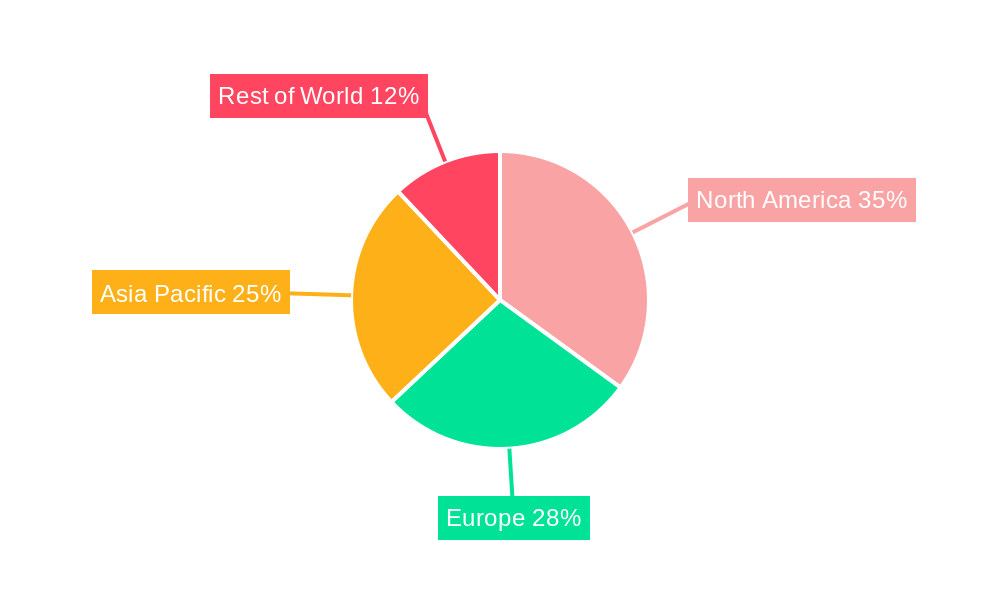
The Asia-Pacific region, particularly China, South Korea, and Taiwan, currently dominates the Electronic Grade Nitric Oxide market. This dominance stems from the concentrated presence of semiconductor manufacturing facilities within these regions, coupled with supportive government policies promoting technological advancement within the electronics industry. North America and Europe follow as significant markets, albeit with lower growth rates compared to Asia-Pacific. The semiconductor industry segment represents the largest end-use application, driving a majority of the market demand.
- Key Drivers in Asia-Pacific:
- High concentration of semiconductor manufacturing facilities.
- Supportive government policies promoting technological advancement in electronics.
- Strong economic growth and investments in advanced technology infrastructure.
- Dominance Factors: High demand from semiconductor industry, established manufacturing capabilities, and favorable government policies.
- Growth Potential: While growth in Asia-Pacific is expected to continue, other regions are poised for expansion as the adoption of advanced technologies grows globally.
Electronic Grade Nitric Oxide (NO) Product Landscape
Electronic Grade Nitric Oxide is primarily offered in various forms, including cylinders, gas mixtures, and specialized delivery systems designed to ensure precise and safe handling. Product innovations focus on enhancing purity levels, improving stability, and developing more efficient delivery methods. Key performance metrics include purity levels (typically expressed in parts per million of impurities), pressure stability, and delivery accuracy. The primary Unique Selling Proposition (USP) for producers lies in offering superior purity and reliable delivery systems tailored to the specific needs of different applications.
Key Drivers, Barriers & Challenges in Electronic Grade Nitric Oxide (NO)
Key Drivers:
- The increasing demand for high-performance electronics is the primary driver.
- Technological advancements in semiconductor manufacturing processes necessitate high-purity NO.
- Government investments in research and development activities further boost market demand.
Challenges & Restraints:
- Stringent safety regulations and handling procedures associated with NO increase operational costs.
- Supply chain disruptions can impact the availability and pricing of Electronic Grade NO.
- Competition from alternative materials, although limited, poses a challenge in niche applications. This is expected to impact the market by xx% by 2033.
Emerging Opportunities in Electronic Grade Nitric Oxide (NO)
Emerging opportunities lie in expanding into new applications beyond the semiconductor industry. Research and development in areas such as medical applications and advanced materials offer promising avenues for market growth. Furthermore, the development of more sustainable and environmentally friendly production processes can provide a competitive edge. Untapped markets in developing economies with growing semiconductor industries represent substantial potential for future expansion.
Growth Accelerators in the Electronic Grade Nitric Oxide (NO) Industry
Technological advancements, particularly in purification and delivery systems, are key growth accelerators. Strategic partnerships between gas producers and semiconductor manufacturers, enabling co-development of customized solutions, further enhance market growth. The expansion into new applications and geographical regions also contributes to the long-term growth trajectory of this market.
Key Players Shaping the Electronic Grade Nitric Oxide (NO) Market
- Sumitomo Seika Chemicals Company
- Linde plc
- Air Liquide
- Merck KGaA
- Guangdong Huate Gas
- Linggas, Ltd.
Notable Milestones in Electronic Grade Nitric Oxide (NO) Sector
- 2020: Linde plc announced a significant investment in expanding its Electronic Grade Nitric Oxide production capacity.
- 2022: Sumitomo Seika Chemicals Company launched a new, high-purity Electronic Grade Nitric Oxide product line.
- 2023: Air Liquide partnered with a major semiconductor manufacturer to develop a customized delivery system for Electronic Grade Nitric Oxide. (Further detailed milestones provided within the full report)
In-Depth Electronic Grade Nitric Oxide (NO) Market Outlook
The Electronic Grade Nitric Oxide market is poised for continued growth driven by the expansion of the semiconductor industry, technological advancements, and the exploration of new applications. Strategic partnerships, investments in R&D, and geographical expansion will be crucial for companies seeking to capitalize on the market's long-term potential. This market presents compelling opportunities for both established players and new entrants with innovative offerings and strategic market positioning.
Electronic Grade Nitric Oxide No Segmentation
-
1. Application
- 1.1. Chemical Vapor Deposition Process
- 1.2. Others
-
2. Type
- 2.1. ≥99.5% Purity
- 2.2. ≥99.99% Purity
Electronic Grade Nitric Oxide No Segmentation By Geography
-
1. North America
- 1.1. United States
- 1.2. Canada
- 1.3. Mexico
-
2. South America
- 2.1. Brazil
- 2.2. Argentina
- 2.3. Rest of South America
-
3. Europe
- 3.1. United Kingdom
- 3.2. Germany
- 3.3. France
- 3.4. Italy
- 3.5. Spain
- 3.6. Russia
- 3.7. Benelux
- 3.8. Nordics
- 3.9. Rest of Europe
-
4. Middle East & Africa
- 4.1. Turkey
- 4.2. Israel
- 4.3. GCC
- 4.4. North Africa
- 4.5. South Africa
- 4.6. Rest of Middle East & Africa
-
5. Asia Pacific
- 5.1. China
- 5.2. India
- 5.3. Japan
- 5.4. South Korea
- 5.5. ASEAN
- 5.6. Oceania
- 5.7. Rest of Asia Pacific
Electronic Grade Nitric Oxide No REPORT HIGHLIGHTS
| Aspects | Details |
|---|---|
| Study Period | 2019-2033 |
| Base Year | 2024 |
| Estimated Year | 2025 |
| Forecast Period | 2025-2033 |
| Historical Period | 2019-2024 |
| Growth Rate | CAGR of 6.5% from 2019-2033 |
| Segmentation |
|
Table of Contents
- 1. Introduction
- 1.1. Research Scope
- 1.2. Market Segmentation
- 1.3. Research Methodology
- 1.4. Definitions and Assumptions
- 2. Executive Summary
- 2.1. Introduction
- 3. Market Dynamics
- 3.1. Introduction
- 3.2. Market Drivers
- 3.3. Market Restrains
- 3.4. Market Trends
- 4. Market Factor Analysis
- 4.1. Porters Five Forces
- 4.2. Supply/Value Chain
- 4.3. PESTEL analysis
- 4.4. Market Entropy
- 4.5. Patent/Trademark Analysis
- 5. Global Electronic Grade Nitric Oxide No Analysis, Insights and Forecast, 2019-2031
- 5.1. Market Analysis, Insights and Forecast - by Application
- 5.1.1. Chemical Vapor Deposition Process
- 5.1.2. Others
- 5.2. Market Analysis, Insights and Forecast - by Type
- 5.2.1. ≥99.5% Purity
- 5.2.2. ≥99.99% Purity
- 5.3. Market Analysis, Insights and Forecast - by Region
- 5.3.1. North America
- 5.3.2. South America
- 5.3.3. Europe
- 5.3.4. Middle East & Africa
- 5.3.5. Asia Pacific
- 5.1. Market Analysis, Insights and Forecast - by Application
- 6. North America Electronic Grade Nitric Oxide No Analysis, Insights and Forecast, 2019-2031
- 6.1. Market Analysis, Insights and Forecast - by Application
- 6.1.1. Chemical Vapor Deposition Process
- 6.1.2. Others
- 6.2. Market Analysis, Insights and Forecast - by Type
- 6.2.1. ≥99.5% Purity
- 6.2.2. ≥99.99% Purity
- 6.1. Market Analysis, Insights and Forecast - by Application
- 7. South America Electronic Grade Nitric Oxide No Analysis, Insights and Forecast, 2019-2031
- 7.1. Market Analysis, Insights and Forecast - by Application
- 7.1.1. Chemical Vapor Deposition Process
- 7.1.2. Others
- 7.2. Market Analysis, Insights and Forecast - by Type
- 7.2.1. ≥99.5% Purity
- 7.2.2. ≥99.99% Purity
- 7.1. Market Analysis, Insights and Forecast - by Application
- 8. Europe Electronic Grade Nitric Oxide No Analysis, Insights and Forecast, 2019-2031
- 8.1. Market Analysis, Insights and Forecast - by Application
- 8.1.1. Chemical Vapor Deposition Process
- 8.1.2. Others
- 8.2. Market Analysis, Insights and Forecast - by Type
- 8.2.1. ≥99.5% Purity
- 8.2.2. ≥99.99% Purity
- 8.1. Market Analysis, Insights and Forecast - by Application
- 9. Middle East & Africa Electronic Grade Nitric Oxide No Analysis, Insights and Forecast, 2019-2031
- 9.1. Market Analysis, Insights and Forecast - by Application
- 9.1.1. Chemical Vapor Deposition Process
- 9.1.2. Others
- 9.2. Market Analysis, Insights and Forecast - by Type
- 9.2.1. ≥99.5% Purity
- 9.2.2. ≥99.99% Purity
- 9.1. Market Analysis, Insights and Forecast - by Application
- 10. Asia Pacific Electronic Grade Nitric Oxide No Analysis, Insights and Forecast, 2019-2031
- 10.1. Market Analysis, Insights and Forecast - by Application
- 10.1.1. Chemical Vapor Deposition Process
- 10.1.2. Others
- 10.2. Market Analysis, Insights and Forecast - by Type
- 10.2.1. ≥99.5% Purity
- 10.2.2. ≥99.99% Purity
- 10.1. Market Analysis, Insights and Forecast - by Application
- 11. Competitive Analysis
- 11.1. Global Market Share Analysis 2024
- 11.2. Company Profiles
- 11.2.1 Sumitomo Seika Chemicals Company
- 11.2.1.1. Overview
- 11.2.1.2. Products
- 11.2.1.3. SWOT Analysis
- 11.2.1.4. Recent Developments
- 11.2.1.5. Financials (Based on Availability)
- 11.2.2 Linde plc
- 11.2.2.1. Overview
- 11.2.2.2. Products
- 11.2.2.3. SWOT Analysis
- 11.2.2.4. Recent Developments
- 11.2.2.5. Financials (Based on Availability)
- 11.2.3 Air Liquide
- 11.2.3.1. Overview
- 11.2.3.2. Products
- 11.2.3.3. SWOT Analysis
- 11.2.3.4. Recent Developments
- 11.2.3.5. Financials (Based on Availability)
- 11.2.4 Merck KGaA
- 11.2.4.1. Overview
- 11.2.4.2. Products
- 11.2.4.3. SWOT Analysis
- 11.2.4.4. Recent Developments
- 11.2.4.5. Financials (Based on Availability)
- 11.2.5 Guangdong Huate Gas
- 11.2.5.1. Overview
- 11.2.5.2. Products
- 11.2.5.3. SWOT Analysis
- 11.2.5.4. Recent Developments
- 11.2.5.5. Financials (Based on Availability)
- 11.2.6 LinggasLtd.
- 11.2.6.1. Overview
- 11.2.6.2. Products
- 11.2.6.3. SWOT Analysis
- 11.2.6.4. Recent Developments
- 11.2.6.5. Financials (Based on Availability)
- 11.2.1 Sumitomo Seika Chemicals Company
List of Figures
- Figure 1: Global Electronic Grade Nitric Oxide No Revenue Breakdown (million, %) by Region 2024 & 2032
- Figure 2: North America Electronic Grade Nitric Oxide No Revenue (million), by Application 2024 & 2032
- Figure 3: North America Electronic Grade Nitric Oxide No Revenue Share (%), by Application 2024 & 2032
- Figure 4: North America Electronic Grade Nitric Oxide No Revenue (million), by Type 2024 & 2032
- Figure 5: North America Electronic Grade Nitric Oxide No Revenue Share (%), by Type 2024 & 2032
- Figure 6: North America Electronic Grade Nitric Oxide No Revenue (million), by Country 2024 & 2032
- Figure 7: North America Electronic Grade Nitric Oxide No Revenue Share (%), by Country 2024 & 2032
- Figure 8: South America Electronic Grade Nitric Oxide No Revenue (million), by Application 2024 & 2032
- Figure 9: South America Electronic Grade Nitric Oxide No Revenue Share (%), by Application 2024 & 2032
- Figure 10: South America Electronic Grade Nitric Oxide No Revenue (million), by Type 2024 & 2032
- Figure 11: South America Electronic Grade Nitric Oxide No Revenue Share (%), by Type 2024 & 2032
- Figure 12: South America Electronic Grade Nitric Oxide No Revenue (million), by Country 2024 & 2032
- Figure 13: South America Electronic Grade Nitric Oxide No Revenue Share (%), by Country 2024 & 2032
- Figure 14: Europe Electronic Grade Nitric Oxide No Revenue (million), by Application 2024 & 2032
- Figure 15: Europe Electronic Grade Nitric Oxide No Revenue Share (%), by Application 2024 & 2032
- Figure 16: Europe Electronic Grade Nitric Oxide No Revenue (million), by Type 2024 & 2032
- Figure 17: Europe Electronic Grade Nitric Oxide No Revenue Share (%), by Type 2024 & 2032
- Figure 18: Europe Electronic Grade Nitric Oxide No Revenue (million), by Country 2024 & 2032
- Figure 19: Europe Electronic Grade Nitric Oxide No Revenue Share (%), by Country 2024 & 2032
- Figure 20: Middle East & Africa Electronic Grade Nitric Oxide No Revenue (million), by Application 2024 & 2032
- Figure 21: Middle East & Africa Electronic Grade Nitric Oxide No Revenue Share (%), by Application 2024 & 2032
- Figure 22: Middle East & Africa Electronic Grade Nitric Oxide No Revenue (million), by Type 2024 & 2032
- Figure 23: Middle East & Africa Electronic Grade Nitric Oxide No Revenue Share (%), by Type 2024 & 2032
- Figure 24: Middle East & Africa Electronic Grade Nitric Oxide No Revenue (million), by Country 2024 & 2032
- Figure 25: Middle East & Africa Electronic Grade Nitric Oxide No Revenue Share (%), by Country 2024 & 2032
- Figure 26: Asia Pacific Electronic Grade Nitric Oxide No Revenue (million), by Application 2024 & 2032
- Figure 27: Asia Pacific Electronic Grade Nitric Oxide No Revenue Share (%), by Application 2024 & 2032
- Figure 28: Asia Pacific Electronic Grade Nitric Oxide No Revenue (million), by Type 2024 & 2032
- Figure 29: Asia Pacific Electronic Grade Nitric Oxide No Revenue Share (%), by Type 2024 & 2032
- Figure 30: Asia Pacific Electronic Grade Nitric Oxide No Revenue (million), by Country 2024 & 2032
- Figure 31: Asia Pacific Electronic Grade Nitric Oxide No Revenue Share (%), by Country 2024 & 2032
List of Tables
- Table 1: Global Electronic Grade Nitric Oxide No Revenue million Forecast, by Region 2019 & 2032
- Table 2: Global Electronic Grade Nitric Oxide No Revenue million Forecast, by Application 2019 & 2032
- Table 3: Global Electronic Grade Nitric Oxide No Revenue million Forecast, by Type 2019 & 2032
- Table 4: Global Electronic Grade Nitric Oxide No Revenue million Forecast, by Region 2019 & 2032
- Table 5: Global Electronic Grade Nitric Oxide No Revenue million Forecast, by Application 2019 & 2032
- Table 6: Global Electronic Grade Nitric Oxide No Revenue million Forecast, by Type 2019 & 2032
- Table 7: Global Electronic Grade Nitric Oxide No Revenue million Forecast, by Country 2019 & 2032
- Table 8: United States Electronic Grade Nitric Oxide No Revenue (million) Forecast, by Application 2019 & 2032
- Table 9: Canada Electronic Grade Nitric Oxide No Revenue (million) Forecast, by Application 2019 & 2032
- Table 10: Mexico Electronic Grade Nitric Oxide No Revenue (million) Forecast, by Application 2019 & 2032
- Table 11: Global Electronic Grade Nitric Oxide No Revenue million Forecast, by Application 2019 & 2032
- Table 12: Global Electronic Grade Nitric Oxide No Revenue million Forecast, by Type 2019 & 2032
- Table 13: Global Electronic Grade Nitric Oxide No Revenue million Forecast, by Country 2019 & 2032
- Table 14: Brazil Electronic Grade Nitric Oxide No Revenue (million) Forecast, by Application 2019 & 2032
- Table 15: Argentina Electronic Grade Nitric Oxide No Revenue (million) Forecast, by Application 2019 & 2032
- Table 16: Rest of South America Electronic Grade Nitric Oxide No Revenue (million) Forecast, by Application 2019 & 2032
- Table 17: Global Electronic Grade Nitric Oxide No Revenue million Forecast, by Application 2019 & 2032
- Table 18: Global Electronic Grade Nitric Oxide No Revenue million Forecast, by Type 2019 & 2032
- Table 19: Global Electronic Grade Nitric Oxide No Revenue million Forecast, by Country 2019 & 2032
- Table 20: United Kingdom Electronic Grade Nitric Oxide No Revenue (million) Forecast, by Application 2019 & 2032
- Table 21: Germany Electronic Grade Nitric Oxide No Revenue (million) Forecast, by Application 2019 & 2032
- Table 22: France Electronic Grade Nitric Oxide No Revenue (million) Forecast, by Application 2019 & 2032
- Table 23: Italy Electronic Grade Nitric Oxide No Revenue (million) Forecast, by Application 2019 & 2032
- Table 24: Spain Electronic Grade Nitric Oxide No Revenue (million) Forecast, by Application 2019 & 2032
- Table 25: Russia Electronic Grade Nitric Oxide No Revenue (million) Forecast, by Application 2019 & 2032
- Table 26: Benelux Electronic Grade Nitric Oxide No Revenue (million) Forecast, by Application 2019 & 2032
- Table 27: Nordics Electronic Grade Nitric Oxide No Revenue (million) Forecast, by Application 2019 & 2032
- Table 28: Rest of Europe Electronic Grade Nitric Oxide No Revenue (million) Forecast, by Application 2019 & 2032
- Table 29: Global Electronic Grade Nitric Oxide No Revenue million Forecast, by Application 2019 & 2032
- Table 30: Global Electronic Grade Nitric Oxide No Revenue million Forecast, by Type 2019 & 2032
- Table 31: Global Electronic Grade Nitric Oxide No Revenue million Forecast, by Country 2019 & 2032
- Table 32: Turkey Electronic Grade Nitric Oxide No Revenue (million) Forecast, by Application 2019 & 2032
- Table 33: Israel Electronic Grade Nitric Oxide No Revenue (million) Forecast, by Application 2019 & 2032
- Table 34: GCC Electronic Grade Nitric Oxide No Revenue (million) Forecast, by Application 2019 & 2032
- Table 35: North Africa Electronic Grade Nitric Oxide No Revenue (million) Forecast, by Application 2019 & 2032
- Table 36: South Africa Electronic Grade Nitric Oxide No Revenue (million) Forecast, by Application 2019 & 2032
- Table 37: Rest of Middle East & Africa Electronic Grade Nitric Oxide No Revenue (million) Forecast, by Application 2019 & 2032
- Table 38: Global Electronic Grade Nitric Oxide No Revenue million Forecast, by Application 2019 & 2032
- Table 39: Global Electronic Grade Nitric Oxide No Revenue million Forecast, by Type 2019 & 2032
- Table 40: Global Electronic Grade Nitric Oxide No Revenue million Forecast, by Country 2019 & 2032
- Table 41: China Electronic Grade Nitric Oxide No Revenue (million) Forecast, by Application 2019 & 2032
- Table 42: India Electronic Grade Nitric Oxide No Revenue (million) Forecast, by Application 2019 & 2032
- Table 43: Japan Electronic Grade Nitric Oxide No Revenue (million) Forecast, by Application 2019 & 2032
- Table 44: South Korea Electronic Grade Nitric Oxide No Revenue (million) Forecast, by Application 2019 & 2032
- Table 45: ASEAN Electronic Grade Nitric Oxide No Revenue (million) Forecast, by Application 2019 & 2032
- Table 46: Oceania Electronic Grade Nitric Oxide No Revenue (million) Forecast, by Application 2019 & 2032
- Table 47: Rest of Asia Pacific Electronic Grade Nitric Oxide No Revenue (million) Forecast, by Application 2019 & 2032
Frequently Asked Questions
1. What is the projected Compound Annual Growth Rate (CAGR) of the Electronic Grade Nitric Oxide No?
The projected CAGR is approximately 6.5%.
2. Which companies are prominent players in the Electronic Grade Nitric Oxide No?
Key companies in the market include Sumitomo Seika Chemicals Company, Linde plc, Air Liquide, Merck KGaA, Guangdong Huate Gas, Linggas,Ltd..
3. What are the main segments of the Electronic Grade Nitric Oxide No?
The market segments include Application, Type.
4. Can you provide details about the market size?
The market size is estimated to be USD 46.1 million as of 2022.
5. What are some drivers contributing to market growth?
N/A
6. What are the notable trends driving market growth?
N/A
7. Are there any restraints impacting market growth?
N/A
8. Can you provide examples of recent developments in the market?
N/A
9. What pricing options are available for accessing the report?
Pricing options include single-user, multi-user, and enterprise licenses priced at USD 2900.00, USD 4350.00, and USD 5800.00 respectively.
10. Is the market size provided in terms of value or volume?
The market size is provided in terms of value, measured in million.
11. Are there any specific market keywords associated with the report?
Yes, the market keyword associated with the report is "Electronic Grade Nitric Oxide No," which aids in identifying and referencing the specific market segment covered.
12. How do I determine which pricing option suits my needs best?
The pricing options vary based on user requirements and access needs. Individual users may opt for single-user licenses, while businesses requiring broader access may choose multi-user or enterprise licenses for cost-effective access to the report.
13. Are there any additional resources or data provided in the Electronic Grade Nitric Oxide No report?
While the report offers comprehensive insights, it's advisable to review the specific contents or supplementary materials provided to ascertain if additional resources or data are available.
14. How can I stay updated on further developments or reports in the Electronic Grade Nitric Oxide No?
To stay informed about further developments, trends, and reports in the Electronic Grade Nitric Oxide No, consider subscribing to industry newsletters, following relevant companies and organizations, or regularly checking reputable industry news sources and publications.
Methodology
Step 1 - Identification of Relevant Samples Size from Population Database


Step 2 - Approaches for Defining Global Market Size (Value, Volume* & Price*)

Note*: In applicable scenarios
Step 3 - Data Sources
Primary Research
- Web Analytics
- Survey Reports
- Research Institute
- Latest Research Reports
- Opinion Leaders
Secondary Research
- Annual Reports
- White Paper
- Latest Press Release
- Industry Association
- Paid Database
- Investor Presentations

Step 4 - Data Triangulation
Involves using different sources of information in order to increase the validity of a study
These sources are likely to be stakeholders in a program - participants, other researchers, program staff, other community members, and so on.
Then we put all data in single framework & apply various statistical tools to find out the dynamic on the market.
During the analysis stage, feedback from the stakeholder groups would be compared to determine areas of agreement as well as areas of divergence
