

Key Insights
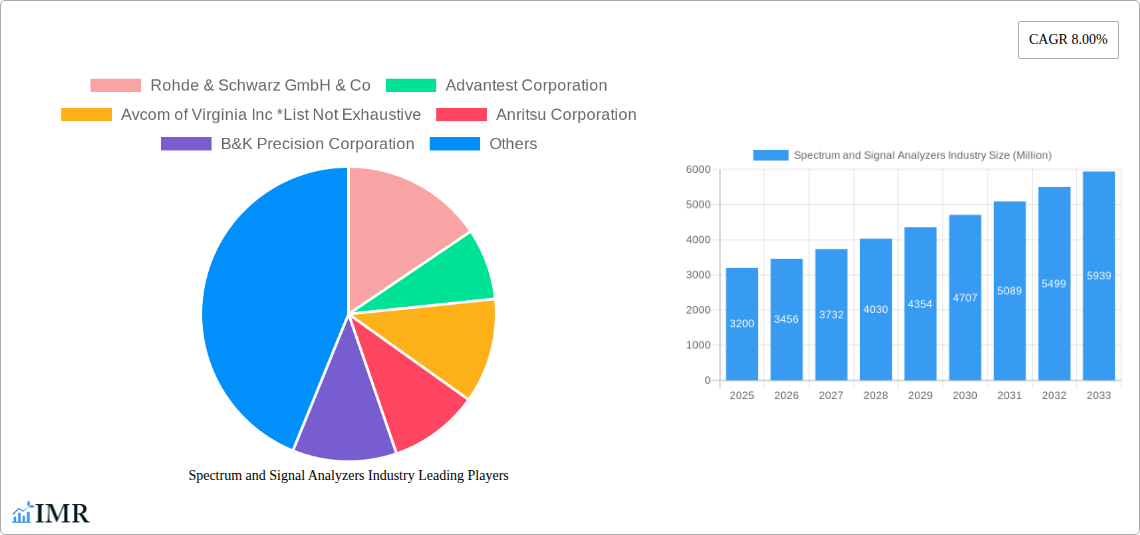
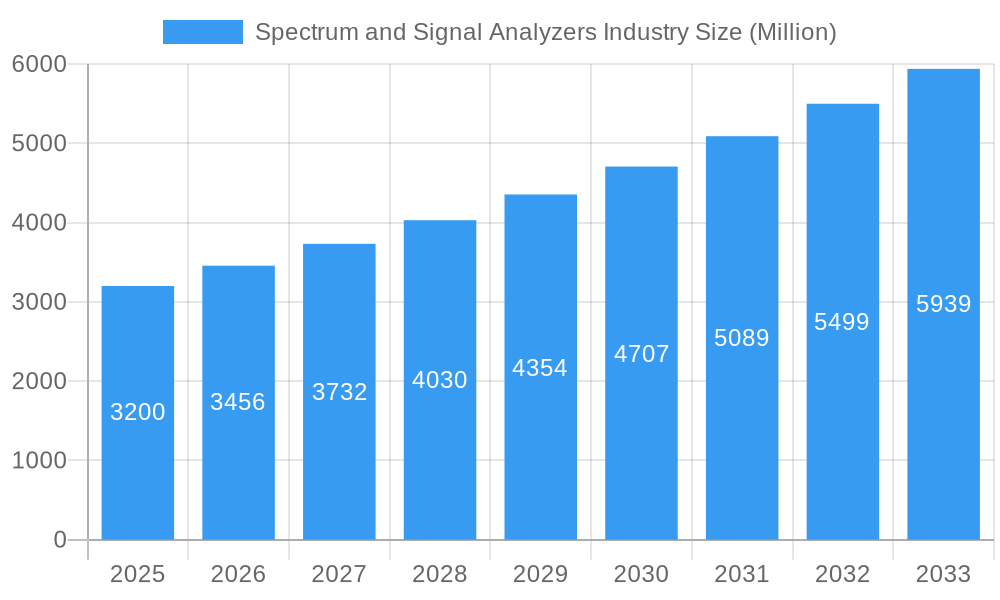
The global Spectrum and Signal Analyzers market is poised for robust expansion, projected to reach a significant market size of approximately $3,200 million by 2025, with a compelling Compound Annual Growth Rate (CAGR) of 8.00% anticipated throughout the forecast period of 2025-2033. This growth is primarily fueled by the escalating demand from the IT & Telecommunication sector, driven by the rapid proliferation of 5G networks, increasing data traffic, and the growing adoption of IoT devices. The automotive industry also presents a substantial growth avenue, with the increasing complexity of in-vehicle electronics, the development of autonomous driving systems, and the integration of advanced communication technologies necessitating sophisticated signal analysis. Furthermore, the aerospace and defense sector continues to be a strong contributor, demanding high-performance analyzers for radar systems, electronic warfare, and satellite communications.
Spectrum and Signal Analyzers Industry Market Size (In Billion)
Key market restraints include the high cost of advanced spectrum and signal analyzers, which can limit adoption for smaller enterprises and research institutions. Additionally, the rapid pace of technological evolution requires continuous investment in R&D and product upgrades, posing a challenge for some market players. However, ongoing technological advancements, such as the development of portable and compact analyzers, enhanced signal processing capabilities, and the integration of AI and machine learning for automated analysis, are expected to overcome these limitations. The market is segmented across various frequency ranges, with a strong emphasis on the "More than 18 GHz" segment due to the demands of next-generation wireless communication technologies. North America currently holds a dominant market share, driven by its advanced technological infrastructure and significant investments in R&D, followed closely by Europe and the Asia Pacific region, which is experiencing rapid growth fueled by burgeoning electronics manufacturing and telecommunications infrastructure development.
Spectrum and Signal Analyzers Industry Company Market Share
This comprehensive report delivers an in-depth analysis of the global Spectrum and Signal Analyzers market, encompassing market dynamics, growth trends, regional dominance, product landscape, key drivers, challenges, emerging opportunities, and a detailed outlook for the forecast period of 2025–2033. Utilizing high-traffic keywords, this report is optimized for search engines to maximize visibility and engagement among industry professionals, researchers, and investors. We explore parent and child market segments, providing quantitative insights presented in Million units for clarity and precision.
Spectrum and Signal Analyzers Industry Market Dynamics & Structure
The Spectrum and Signal Analyzers market is characterized by a moderately concentrated structure, with a few dominant players holding significant market share. Technological innovation serves as a primary driver, pushing the development of more sophisticated, compact, and feature-rich devices to meet the evolving demands of industries like IT & Telecommunication, Aerospace & Defense, and Automotive. Regulatory frameworks, particularly those concerning electromagnetic compatibility (EMC) and spectrum allocation, also play a crucial role in shaping product development and market entry. Competitive product substitutes are limited, as specialized spectrum and signal analyzers offer unique capabilities not easily replicated. End-user demographics are increasingly shifting towards advanced R&D departments and field service technicians requiring portable and high-performance solutions. Mergers and acquisitions (M&A) trends, though not aggressive, indicate strategic consolidation to acquire new technologies or expand market reach. For instance, the market has witnessed strategic acquisitions aimed at bolstering capabilities in areas like 5G testing and IoT device analysis. Innovation barriers include the high cost of R&D and the need for specialized expertise.
- Market Concentration: Moderate, with key players like Keysight Technologies and Rohde & Schwarz dominating.
- Technological Innovation Drivers: Miniaturization, increased bandwidth, higher frequency ranges, and advanced signal processing capabilities.
- Regulatory Frameworks: EMC directives, spectrum licensing, and standardization efforts for wireless technologies.
- Competitive Product Substitutes: Limited, with specialized test equipment often being the only viable alternative.
- End-User Demographics: Growing demand from telecommunications, defense contractors, and automotive manufacturers for compliance testing and performance verification.
- M&A Trends: Strategic acquisitions for technology integration and market expansion.
Spectrum and Signal Analyzers Industry Growth Trends & Insights
The global Spectrum and Signal Analyzers market is poised for robust growth, driven by the rapid expansion of wireless technologies, the proliferation of IoT devices, and increasing investments in advanced communication infrastructure. The market size is projected to witness a Compound Annual Growth Rate (CAGR) of approximately 6.8% from 2025 to 2033, expanding from an estimated market size of $2,350.5 Million units in 2025 to over $3,900 Million units by 2033. Adoption rates are steadily increasing across various end-user industries, fueled by the need for accurate signal measurement, interference analysis, and compliance testing for next-generation technologies like 5G, Wi-Fi 6/6E, and satellite communications. Technological disruptions, such as the advent of real-time spectrum analysis and enhanced dynamic range capabilities, are transforming how signals are monitored and analyzed. Consumer behavior shifts, particularly within the IT & Telecommunication sector, emphasize the demand for portable, user-friendly, and cost-effective solutions capable of handling complex signal environments. The increasing complexity of wireless protocols and the expanding frequency spectrum necessitate sophisticated analysis tools. The market penetration of advanced spectrum analyzers is deepening as industries recognize their critical role in product development, quality assurance, and troubleshooting. Furthermore, the growing adoption of cloud-based analytics and software-defined instrumentation is enhancing the flexibility and accessibility of these crucial test instruments. The evolving landscape of radio frequency (RF) and microwave applications is continuously creating new use cases and driving demand for specialized signal analysis solutions.
Dominant Regions, Countries, or Segments in Spectrum and Signal Analyzers Industry
The IT & Telecommunication segment emerges as a dominant force in the Spectrum and Signal Analyzers industry, driven by the relentless global rollout of 5G networks, the expansion of broadband infrastructure, and the burgeoning IoT ecosystem. North America and Europe currently lead in market share, attributed to significant investments in advanced telecommunications, robust R&D activities, and stringent regulatory compliance requirements. However, the Asia-Pacific region is exhibiting the fastest growth rate, propelled by rapid digitalization, increasing disposable incomes, and government initiatives promoting technological advancement. Within the frequency range segments, More than 18 GHz is witnessing accelerated growth, directly correlated with the deployment of higher frequency bands for 5G and future wireless communication standards. This expansion is critical for unlocking greater bandwidth and data transfer speeds.
- Dominant End-User Industry: IT & Telecommunication, accounting for an estimated 40% of the market share in 2025.
- Key Drivers: 5G deployment, Wi-Fi 6/6E adoption, IoT device proliferation, and the need for advanced wireless testing.
- Market Share: Expected to reach $940.2 Million units in 2025.
- Dominant Frequency Range: More than 18 GHz, driven by demand for higher bandwidth solutions.
- Key Drivers: Next-generation wireless technologies, satellite communications, and radar systems.
- Growth Potential: Projected to grow at a CAGR of approximately 7.5% during the forecast period.
- Leading Regions:
- North America: Strong R&D investment, mature telecommunications market, and defense applications.
- Europe: Stringent regulatory standards, significant industrial automation, and automotive R&D.
- Asia-Pacific: Rapid digitalization, substantial investments in 5G infrastructure, and a growing manufacturing base.
Spectrum and Signal Analyzers Industry Product Landscape
The product landscape of the Spectrum and Signal Analyzers industry is characterized by continuous innovation, delivering enhanced performance, versatility, and user-friendliness. Leading manufacturers are focusing on developing compact, portable devices for field applications, alongside high-performance benchtop analyzers for laboratory and R&D environments. Key product innovations include real-time spectrum analysis capabilities with extended capture bandwidths, improved dynamic range for detecting weak signals in noisy environments, and expanded frequency coverage to support emerging wireless standards. Applications span a wide spectrum, from validating wireless device compliance and troubleshooting RF interference to characterizing complex modulated signals and supporting advanced radar and electronic warfare systems. Unique selling propositions often revolve around superior measurement accuracy, intuitive user interfaces, comprehensive analysis software suites, and seamless integration with other test and measurement equipment. Technological advancements are also incorporating AI and machine learning for automated anomaly detection and signal classification.
Key Drivers, Barriers & Challenges in Spectrum and Signal Analyzers Industry
The Spectrum and Signal Analyzers industry is propelled by several key drivers. The relentless expansion of wireless technologies, including 5G, Wi-Fi 7, and satellite communications, demands increasingly sophisticated signal analysis tools for development, testing, and deployment. Growing investments in defense and aerospace sectors for radar systems, electronic warfare, and satellite communication also fuel demand. Furthermore, the burgeoning IoT market necessitates specialized equipment for testing and verifying diverse wireless devices.
Conversely, significant barriers and challenges exist. The high cost of advanced spectrum and signal analyzers can be a deterrent for smaller organizations or emerging markets. The rapid pace of technological evolution requires continuous investment in R&D, making it difficult for some companies to keep up. Supply chain disruptions, particularly for critical electronic components, can impact production timelines and costs. Regulatory hurdles related to spectrum allocation and testing standards can also present challenges. Competitive pressures, especially from lower-cost alternatives in less demanding applications, necessitate a focus on differentiation through performance and features.
Emerging Opportunities in Spectrum and Signal Analyzers Industry
Emerging opportunities in the Spectrum and Signal Analyzers industry are manifold and driven by technological advancements and evolving market needs. The expansion of sub-6 GHz and mmWave frequencies for 5G Advanced and future wireless communication systems presents a significant opportunity for developing analyzers with extended frequency coverage and higher bandwidths. The increasing demand for precise measurements in automotive radar and autonomous driving technologies is another key area. Furthermore, the growth of satellite-based internet services and the development of new satellite constellations require specialized signal analysis capabilities. The proliferation of Software-Defined Radio (SDR) and its integration with spectrum analysis tools opens avenues for flexible and reconfigurable measurement solutions. Untapped markets in emerging economies, coupled with the increasing need for spectrum monitoring and management for efficient resource utilization, also present substantial growth potential.
Growth Accelerators in the Spectrum and Signal Analyzers Industry Industry
Several factors are accelerating the growth of the Spectrum and Signal Analyzers industry. Technological breakthroughs in semiconductor technology are enabling the development of smaller, more powerful, and more cost-effective analyzers. Strategic partnerships between test equipment manufacturers and leading telecommunications companies, chipset vendors, and research institutions are driving innovation and market adoption. The increasing complexity of wireless signals and the need for accurate performance validation are creating a strong pull for advanced measurement solutions. Furthermore, the growing trend towards digitalization and Industry 4.0 is driving the adoption of sophisticated test and measurement equipment in manufacturing and industrial automation. Market expansion strategies, including geographical diversification and the development of application-specific solutions, are also contributing to sustained growth. The integration of AI and machine learning for advanced signal processing and anomaly detection is a key accelerator, enhancing the value proposition of these instruments.
Key Players Shaping the Spectrum and Signal Analyzers Industry Market
- Rohde & Schwarz GmbH & Co
- Advantest Corporation
- Avcom of Virginia Inc
- Anritsu Corporation
- B&K Precision Corporation
- National Instruments Corporation
- LP Technologies Inc
- Keysight Technologies Inc
- Yokogawa Electric Corporation
- Teledyne Lecroy Inc
- Stanford Research Systems Inc
Notable Milestones in Spectrum and Signal Analyzers Industry Sector
- August 2022: Yokogawa introduced two unique optical spectrum analyzers (OSAs), the AQ6375E and AQ6376E, featuring grating-based designs and top-tier optical performance for SWIR and MWIR wavelength measurements, addressing new requirements in optical device innovation and production.
- June 2021: Signal Hound unveiled the SM435B 43.5 GHz RF spectrum analyzer and monitor receiver, extending its reach into new segments for 5G cellular, aerospace, and military applications.
- June 2021: Signal Hound announced the BB60D, a 6 GHz real-time spectrum analyzer with significant performance enhancements, including a 10dB higher dynamic range and an improved phase distortion, building on the success of its predecessor.
In-Depth Spectrum and Signal Analyzers Industry Market Outlook
The Spectrum and Signal Analyzers industry market outlook is exceptionally positive, driven by ongoing technological advancements and the ubiquitous expansion of wireless connectivity. The sustained global rollout of 5G networks, the development of Wi-Fi 7 and future wireless standards, and the accelerating adoption of IoT devices will continue to be primary growth catalysts. Strategic partnerships and collaborations will foster innovation, leading to the development of more integrated and intelligent test solutions. The increasing demand for spectrum monitoring and management for efficient RF resource utilization, coupled with advancements in artificial intelligence for signal analysis, will unlock new market potentials. Furthermore, the growing applications in automotive, aerospace, and defense sectors will provide significant impetus for growth. The industry is expected to witness a steady upward trajectory, with a strong focus on developing portable, high-performance, and user-friendly spectrum and signal analyzers that cater to the diverse and evolving needs of a connected world.
Spectrum and Signal Analyzers Industry Segmentation
-
1. Frequency Range
- 1.1. Less than 6 GHz
- 1.2. 6-18 GHz
- 1.3. More than 18 GHz
-
2. End-user Industry
- 2.1. IT & Telecommunication
- 2.2. Automotive
- 2.3. Aerospace & Defense
- 2.4. Healthcare
- 2.5. Other End-user Industries
Spectrum and Signal Analyzers Industry Segmentation By Geography
- 1. North America
- 2. Europe
- 3. Asia Pacific
- 4. Latin America
- 5. Middle East
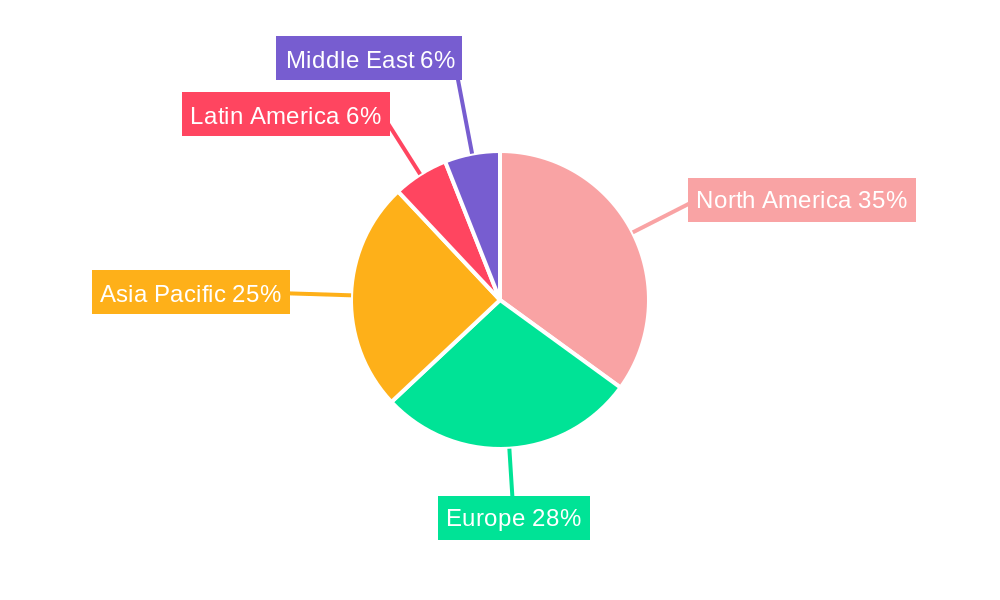
Spectrum and Signal Analyzers Industry Regional Market Share
Geographic Coverage of Spectrum and Signal Analyzers Industry
Spectrum and Signal Analyzers Industry REPORT HIGHLIGHTS
| Aspects | Details |
|---|---|
| Study Period | 2020-2034 |
| Base Year | 2025 |
| Estimated Year | 2026 |
| Forecast Period | 2026-2034 |
| Historical Period | 2020-2025 |
| Growth Rate | CAGR of 5.98% from 2020-2034 |
| Segmentation |
|
Table of Contents
- 1. Introduction
- 1.1. Research Scope
- 1.2. Market Segmentation
- 1.3. Research Objective
- 1.4. Definitions and Assumptions
- 2. Executive Summary
- 2.1. Market Snapshot
- 3. Market Dynamics
- 3.1. Market Drivers
- 3.2. Market Restrains
- 3.3. Market Trends
- 3.4. Market Opportunities
- 4. Market Factor Analysis
- 4.1. Porters Five Forces
- 4.1.1. Bargaining Power of Suppliers
- 4.1.2. Bargaining Power of Buyers
- 4.1.3. Threat of New Entrants
- 4.1.4. Threat of Substitutes
- 4.1.5. Competitive Rivalry
- 4.2. PESTEL analysis
- 4.3. BCG Analysis
- 4.3.1. Stars (High Growth, High Market Share)
- 4.3.2. Cash Cows (Low Growth, High Market Share)
- 4.3.3. Question Mark (High Growth, Low Market Share)
- 4.3.4. Dogs (Low Growth, Low Market Share)
- 4.4. Ansoff Matrix Analysis
- 4.5. Supply Chain Analysis
- 4.6. Regulatory Landscape
- 4.7. Current Market Potential and Opportunity Assessment (TAM–SAM–SOM Framework)
- 4.8. IMR Analyst Note
- 4.1. Porters Five Forces
- 5. Market Analysis, Insights and Forecast 2021-2033
- 5.1. Market Analysis, Insights and Forecast - by Frequency Range
- 5.1.1. Less than 6 GHz
- 5.1.2. 6-18 GHz
- 5.1.3. More than 18 GHz
- 5.2. Market Analysis, Insights and Forecast - by End-user Industry
- 5.2.1. IT & Telecommunication
- 5.2.2. Automotive
- 5.2.3. Aerospace & Defense
- 5.2.4. Healthcare
- 5.2.5. Other End-user Industries
- 5.3. Market Analysis, Insights and Forecast - by Region
- 5.3.1. North America
- 5.3.2. Europe
- 5.3.3. Asia Pacific
- 5.3.4. Latin America
- 5.3.5. Middle East
- 5.1. Market Analysis, Insights and Forecast - by Frequency Range
- 6. Global Spectrum and Signal Analyzers Industry Analysis, Insights and Forecast, 2021-2033
- 6.1. Market Analysis, Insights and Forecast - by Frequency Range
- 6.1.1. Less than 6 GHz
- 6.1.2. 6-18 GHz
- 6.1.3. More than 18 GHz
- 6.2. Market Analysis, Insights and Forecast - by End-user Industry
- 6.2.1. IT & Telecommunication
- 6.2.2. Automotive
- 6.2.3. Aerospace & Defense
- 6.2.4. Healthcare
- 6.2.5. Other End-user Industries
- 6.1. Market Analysis, Insights and Forecast - by Frequency Range
- 7. North America Spectrum and Signal Analyzers Industry Analysis, Insights and Forecast, 2020-2032
- 7.1. Market Analysis, Insights and Forecast - by Frequency Range
- 7.1.1. Less than 6 GHz
- 7.1.2. 6-18 GHz
- 7.1.3. More than 18 GHz
- 7.2. Market Analysis, Insights and Forecast - by End-user Industry
- 7.2.1. IT & Telecommunication
- 7.2.2. Automotive
- 7.2.3. Aerospace & Defense
- 7.2.4. Healthcare
- 7.2.5. Other End-user Industries
- 7.1. Market Analysis, Insights and Forecast - by Frequency Range
- 8. Europe Spectrum and Signal Analyzers Industry Analysis, Insights and Forecast, 2020-2032
- 8.1. Market Analysis, Insights and Forecast - by Frequency Range
- 8.1.1. Less than 6 GHz
- 8.1.2. 6-18 GHz
- 8.1.3. More than 18 GHz
- 8.2. Market Analysis, Insights and Forecast - by End-user Industry
- 8.2.1. IT & Telecommunication
- 8.2.2. Automotive
- 8.2.3. Aerospace & Defense
- 8.2.4. Healthcare
- 8.2.5. Other End-user Industries
- 8.1. Market Analysis, Insights and Forecast - by Frequency Range
- 9. Asia Pacific Spectrum and Signal Analyzers Industry Analysis, Insights and Forecast, 2020-2032
- 9.1. Market Analysis, Insights and Forecast - by Frequency Range
- 9.1.1. Less than 6 GHz
- 9.1.2. 6-18 GHz
- 9.1.3. More than 18 GHz
- 9.2. Market Analysis, Insights and Forecast - by End-user Industry
- 9.2.1. IT & Telecommunication
- 9.2.2. Automotive
- 9.2.3. Aerospace & Defense
- 9.2.4. Healthcare
- 9.2.5. Other End-user Industries
- 9.1. Market Analysis, Insights and Forecast - by Frequency Range
- 10. Latin America Spectrum and Signal Analyzers Industry Analysis, Insights and Forecast, 2020-2032
- 10.1. Market Analysis, Insights and Forecast - by Frequency Range
- 10.1.1. Less than 6 GHz
- 10.1.2. 6-18 GHz
- 10.1.3. More than 18 GHz
- 10.2. Market Analysis, Insights and Forecast - by End-user Industry
- 10.2.1. IT & Telecommunication
- 10.2.2. Automotive
- 10.2.3. Aerospace & Defense
- 10.2.4. Healthcare
- 10.2.5. Other End-user Industries
- 10.1. Market Analysis, Insights and Forecast - by Frequency Range
- 11. Middle East Spectrum and Signal Analyzers Industry Analysis, Insights and Forecast, 2020-2032
- 11.1. Market Analysis, Insights and Forecast - by Frequency Range
- 11.1.1. Less than 6 GHz
- 11.1.2. 6-18 GHz
- 11.1.3. More than 18 GHz
- 11.2. Market Analysis, Insights and Forecast - by End-user Industry
- 11.2.1. IT & Telecommunication
- 11.2.2. Automotive
- 11.2.3. Aerospace & Defense
- 11.2.4. Healthcare
- 11.2.5. Other End-user Industries
- 11.1. Market Analysis, Insights and Forecast - by Frequency Range
- 12. Competitive Analysis
- 12.1. Company Profiles
- 12.1.1 Rohde & Schwarz GmbH & Co
- 12.1.1.1. Company Overview
- 12.1.1.2. Products
- 12.1.1.3. Company Financials
- 12.1.1.4. SWOT Analysis
- 12.1.2 Advantest Corporation
- 12.1.2.1. Company Overview
- 12.1.2.2. Products
- 12.1.2.3. Company Financials
- 12.1.2.4. SWOT Analysis
- 12.1.3 Avcom of Virginia Inc *List Not Exhaustive
- 12.1.3.1. Company Overview
- 12.1.3.2. Products
- 12.1.3.3. Company Financials
- 12.1.3.4. SWOT Analysis
- 12.1.4 Anritsu Corporation
- 12.1.4.1. Company Overview
- 12.1.4.2. Products
- 12.1.4.3. Company Financials
- 12.1.4.4. SWOT Analysis
- 12.1.5 B&K Precision Corporation
- 12.1.5.1. Company Overview
- 12.1.5.2. Products
- 12.1.5.3. Company Financials
- 12.1.5.4. SWOT Analysis
- 12.1.6 National Instruments Corporation
- 12.1.6.1. Company Overview
- 12.1.6.2. Products
- 12.1.6.3. Company Financials
- 12.1.6.4. SWOT Analysis
- 12.1.7 LP Technologies Inc
- 12.1.7.1. Company Overview
- 12.1.7.2. Products
- 12.1.7.3. Company Financials
- 12.1.7.4. SWOT Analysis
- 12.1.8 Keysight Technologies Inc
- 12.1.8.1. Company Overview
- 12.1.8.2. Products
- 12.1.8.3. Company Financials
- 12.1.8.4. SWOT Analysis
- 12.1.9 Yokogawa Electric Corporation
- 12.1.9.1. Company Overview
- 12.1.9.2. Products
- 12.1.9.3. Company Financials
- 12.1.9.4. SWOT Analysis
- 12.1.10 Teledyne Lecroy Inc
- 12.1.10.1. Company Overview
- 12.1.10.2. Products
- 12.1.10.3. Company Financials
- 12.1.10.4. SWOT Analysis
- 12.1.11 Stanford Research Systems Inc
- 12.1.11.1. Company Overview
- 12.1.11.2. Products
- 12.1.11.3. Company Financials
- 12.1.11.4. SWOT Analysis
- 12.1.1 Rohde & Schwarz GmbH & Co
- 12.2. Market Entropy
- 12.2.1 Company's Key Areas Served
- 12.2.2 Recent Developments
- 12.3. Company Market Share Analysis 2025
- 12.3.1 Top 5 Companies Market Share Analysis
- 12.3.2 Top 3 Companies Market Share Analysis
- 12.4. List of Potential Customers
- 13. Research Methodology
List of Figures
- Figure 1: Global Spectrum and Signal Analyzers Industry Revenue Breakdown (undefined, %) by Region 2025 & 2033
- Figure 2: North America Spectrum and Signal Analyzers Industry Revenue (undefined), by Frequency Range 2025 & 2033
- Figure 3: North America Spectrum and Signal Analyzers Industry Revenue Share (%), by Frequency Range 2025 & 2033
- Figure 4: North America Spectrum and Signal Analyzers Industry Revenue (undefined), by End-user Industry 2025 & 2033
- Figure 5: North America Spectrum and Signal Analyzers Industry Revenue Share (%), by End-user Industry 2025 & 2033
- Figure 6: North America Spectrum and Signal Analyzers Industry Revenue (undefined), by Country 2025 & 2033
- Figure 7: North America Spectrum and Signal Analyzers Industry Revenue Share (%), by Country 2025 & 2033
- Figure 8: Europe Spectrum and Signal Analyzers Industry Revenue (undefined), by Frequency Range 2025 & 2033
- Figure 9: Europe Spectrum and Signal Analyzers Industry Revenue Share (%), by Frequency Range 2025 & 2033
- Figure 10: Europe Spectrum and Signal Analyzers Industry Revenue (undefined), by End-user Industry 2025 & 2033
- Figure 11: Europe Spectrum and Signal Analyzers Industry Revenue Share (%), by End-user Industry 2025 & 2033
- Figure 12: Europe Spectrum and Signal Analyzers Industry Revenue (undefined), by Country 2025 & 2033
- Figure 13: Europe Spectrum and Signal Analyzers Industry Revenue Share (%), by Country 2025 & 2033
- Figure 14: Asia Pacific Spectrum and Signal Analyzers Industry Revenue (undefined), by Frequency Range 2025 & 2033
- Figure 15: Asia Pacific Spectrum and Signal Analyzers Industry Revenue Share (%), by Frequency Range 2025 & 2033
- Figure 16: Asia Pacific Spectrum and Signal Analyzers Industry Revenue (undefined), by End-user Industry 2025 & 2033
- Figure 17: Asia Pacific Spectrum and Signal Analyzers Industry Revenue Share (%), by End-user Industry 2025 & 2033
- Figure 18: Asia Pacific Spectrum and Signal Analyzers Industry Revenue (undefined), by Country 2025 & 2033
- Figure 19: Asia Pacific Spectrum and Signal Analyzers Industry Revenue Share (%), by Country 2025 & 2033
- Figure 20: Latin America Spectrum and Signal Analyzers Industry Revenue (undefined), by Frequency Range 2025 & 2033
- Figure 21: Latin America Spectrum and Signal Analyzers Industry Revenue Share (%), by Frequency Range 2025 & 2033
- Figure 22: Latin America Spectrum and Signal Analyzers Industry Revenue (undefined), by End-user Industry 2025 & 2033
- Figure 23: Latin America Spectrum and Signal Analyzers Industry Revenue Share (%), by End-user Industry 2025 & 2033
- Figure 24: Latin America Spectrum and Signal Analyzers Industry Revenue (undefined), by Country 2025 & 2033
- Figure 25: Latin America Spectrum and Signal Analyzers Industry Revenue Share (%), by Country 2025 & 2033
- Figure 26: Middle East Spectrum and Signal Analyzers Industry Revenue (undefined), by Frequency Range 2025 & 2033
- Figure 27: Middle East Spectrum and Signal Analyzers Industry Revenue Share (%), by Frequency Range 2025 & 2033
- Figure 28: Middle East Spectrum and Signal Analyzers Industry Revenue (undefined), by End-user Industry 2025 & 2033
- Figure 29: Middle East Spectrum and Signal Analyzers Industry Revenue Share (%), by End-user Industry 2025 & 2033
- Figure 30: Middle East Spectrum and Signal Analyzers Industry Revenue (undefined), by Country 2025 & 2033
- Figure 31: Middle East Spectrum and Signal Analyzers Industry Revenue Share (%), by Country 2025 & 2033
List of Tables
- Table 1: Global Spectrum and Signal Analyzers Industry Revenue undefined Forecast, by Frequency Range 2020 & 2033
- Table 2: Global Spectrum and Signal Analyzers Industry Revenue undefined Forecast, by End-user Industry 2020 & 2033
- Table 3: Global Spectrum and Signal Analyzers Industry Revenue undefined Forecast, by Region 2020 & 2033
- Table 4: Global Spectrum and Signal Analyzers Industry Revenue undefined Forecast, by Frequency Range 2020 & 2033
- Table 5: Global Spectrum and Signal Analyzers Industry Revenue undefined Forecast, by End-user Industry 2020 & 2033
- Table 6: Global Spectrum and Signal Analyzers Industry Revenue undefined Forecast, by Country 2020 & 2033
- Table 7: Global Spectrum and Signal Analyzers Industry Revenue undefined Forecast, by Frequency Range 2020 & 2033
- Table 8: Global Spectrum and Signal Analyzers Industry Revenue undefined Forecast, by End-user Industry 2020 & 2033
- Table 9: Global Spectrum and Signal Analyzers Industry Revenue undefined Forecast, by Country 2020 & 2033
- Table 10: Global Spectrum and Signal Analyzers Industry Revenue undefined Forecast, by Frequency Range 2020 & 2033
- Table 11: Global Spectrum and Signal Analyzers Industry Revenue undefined Forecast, by End-user Industry 2020 & 2033
- Table 12: Global Spectrum and Signal Analyzers Industry Revenue undefined Forecast, by Country 2020 & 2033
- Table 13: Global Spectrum and Signal Analyzers Industry Revenue undefined Forecast, by Frequency Range 2020 & 2033
- Table 14: Global Spectrum and Signal Analyzers Industry Revenue undefined Forecast, by End-user Industry 2020 & 2033
- Table 15: Global Spectrum and Signal Analyzers Industry Revenue undefined Forecast, by Country 2020 & 2033
- Table 16: Global Spectrum and Signal Analyzers Industry Revenue undefined Forecast, by Frequency Range 2020 & 2033
- Table 17: Global Spectrum and Signal Analyzers Industry Revenue undefined Forecast, by End-user Industry 2020 & 2033
- Table 18: Global Spectrum and Signal Analyzers Industry Revenue undefined Forecast, by Country 2020 & 2033
Frequently Asked Questions
1. What is the projected Compound Annual Growth Rate (CAGR) of the Spectrum and Signal Analyzers Industry?
The projected CAGR is approximately 5.98%.
2. Which companies are prominent players in the Spectrum and Signal Analyzers Industry?
Key companies in the market include Rohde & Schwarz GmbH & Co, Advantest Corporation, Avcom of Virginia Inc *List Not Exhaustive, Anritsu Corporation, B&K Precision Corporation, National Instruments Corporation, LP Technologies Inc, Keysight Technologies Inc, Yokogawa Electric Corporation, Teledyne Lecroy Inc, Stanford Research Systems Inc.
3. What are the main segments of the Spectrum and Signal Analyzers Industry?
The market segments include Frequency Range, End-user Industry.
4. Can you provide details about the market size?
The market size is estimated to be USD XXX N/A as of 2022.
5. What are some drivers contributing to market growth?
Growing Demand for Spectrum Analyzers With Multi-Tasking Capabilities; Technological Advancement Leading to Innovation in Spectrum Analyzer Offering.
6. What are the notable trends driving market growth?
Automotive Segment is Expected to Witness Significant Growth.
7. Are there any restraints impacting market growth?
Requirement of Cost-Effective Spectrum Analyzers With Maximum Features.
8. Can you provide examples of recent developments in the market?
August 2022 - Yokogawa introduced two unique optical spectrum analyzers (OSAs) to address industry demand for a device that can measure a wide variety of wavelengths in order to satisfy new requirements in optical device innovation and production. The Yokogawa AQ6375E and AQ6376E were the unique grating-based OSAs with top-tier optical performance that span SWIR over 2 m & MWIR beyond 3 m.
9. What pricing options are available for accessing the report?
Pricing options include single-user, multi-user, and enterprise licenses priced at USD 4750, USD 5250, and USD 8750 respectively.
10. Is the market size provided in terms of value or volume?
The market size is provided in terms of value, measured in N/A.
11. Are there any specific market keywords associated with the report?
Yes, the market keyword associated with the report is "Spectrum and Signal Analyzers Industry," which aids in identifying and referencing the specific market segment covered.
12. How do I determine which pricing option suits my needs best?
The pricing options vary based on user requirements and access needs. Individual users may opt for single-user licenses, while businesses requiring broader access may choose multi-user or enterprise licenses for cost-effective access to the report.
13. Are there any additional resources or data provided in the Spectrum and Signal Analyzers Industry report?
While the report offers comprehensive insights, it's advisable to review the specific contents or supplementary materials provided to ascertain if additional resources or data are available.
14. How can I stay updated on further developments or reports in the Spectrum and Signal Analyzers Industry?
To stay informed about further developments, trends, and reports in the Spectrum and Signal Analyzers Industry, consider subscribing to industry newsletters, following relevant companies and organizations, or regularly checking reputable industry news sources and publications.
Methodology
Step 1 - Identification of Relevant Samples Size from Population Database


Step 2 - Approaches for Defining Global Market Size (Value, Volume* & Price*)

Note*: In applicable scenarios
Step 3 - Data Sources
Primary Research
- Web Analytics
- Survey Reports
- Research Institute
- Latest Research Reports
- Opinion Leaders
Secondary Research
- Annual Reports
- White Paper
- Latest Press Release
- Industry Association
- Paid Database
- Investor Presentations

Step 4 - Data Triangulation
Involves using different sources of information in order to increase the validity of a study
These sources are likely to be stakeholders in a program - participants, other researchers, program staff, other community members, and so on.
Then we put all data in single framework & apply various statistical tools to find out the dynamic on the market.
During the analysis stage, feedback from the stakeholder groups would be compared to determine areas of agreement as well as areas of divergence