

Key Insights
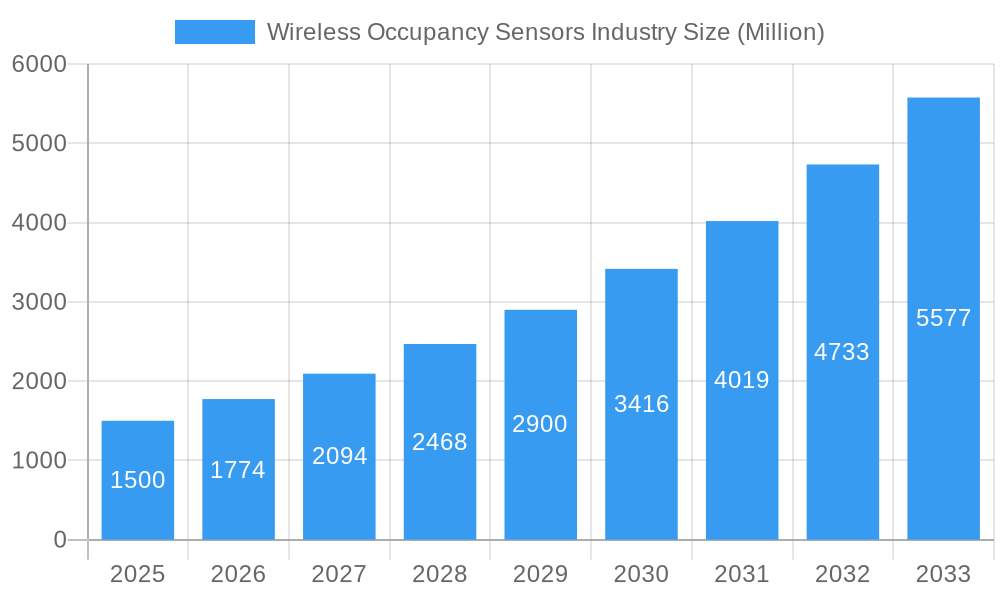
The global Wireless Occupancy Sensors market is projected for substantial growth, expected to reach $1.1 billion by 2025, driven by a Compound Annual Growth Rate (CAGR) of 15.9% from 2025 to 2033. Key growth drivers include the rising demand for energy efficiency in buildings, smart home automation, and enhanced security. The integration of IoT technology facilitates seamless connectivity and data-driven insights for optimizing building operations. Furthermore, government initiatives promoting green buildings and stringent energy conservation regulations are accelerating the adoption of advanced occupancy sensing technologies. The inherent advantages of wireless systems, such as simplified installation, flexibility, and reduced cabling costs, contribute to their widespread adoption across diverse sectors.
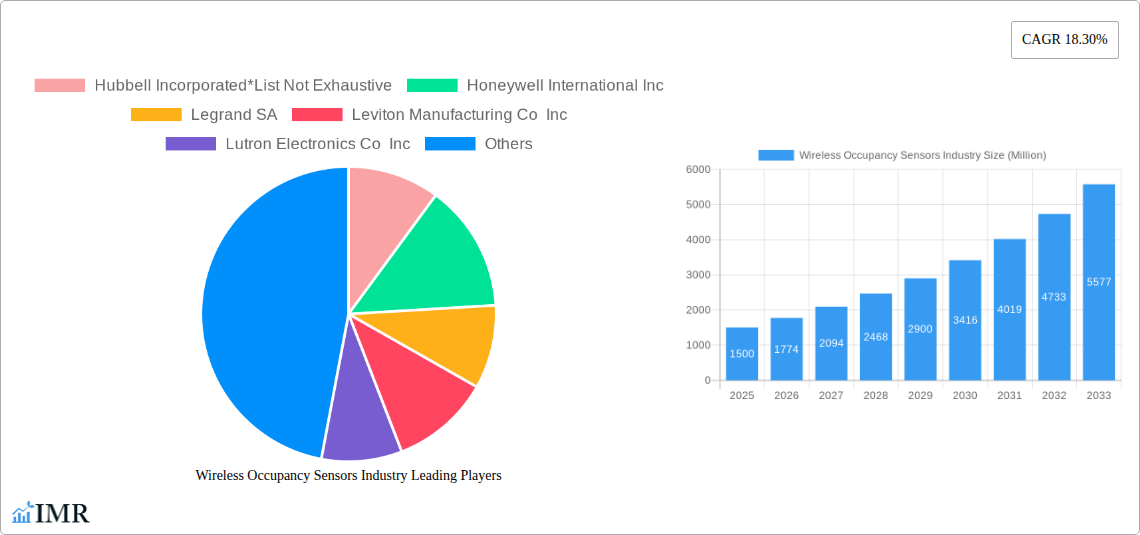
Wireless Occupancy Sensors Industry Market Size (In Billion)
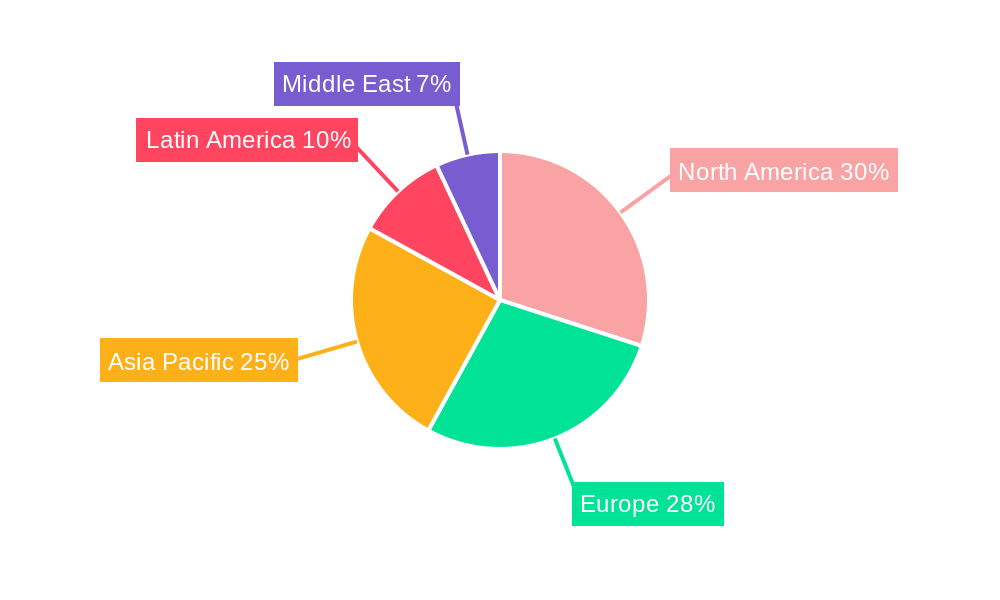
The market is segmented by application into Lighting Control, HVAC, and Security Surveillance. Key market segments include Residential and Commercial Buildings, reflecting the broad applicability of wireless occupancy sensors in creating smarter and more sustainable environments. Prominent end-user industries are Industrial, Aerospace & Defence, Healthcare, and Consumer Electronics, each leveraging the technology for process optimization, safety enhancements, comfort, and energy savings. While North America and Europe currently lead, the Asia Pacific region is anticipated to experience the most significant growth due to rapid urbanization, increasing disposable incomes, and burgeoning smart city infrastructure. Key industry players such as Honeywell International Inc., Johnson Controls Inc., and Schneider Electric are driving innovation and market expansion.
Wireless Occupancy Sensors Industry Company Market Share
Gain comprehensive market insights with this in-depth report on the Wireless Occupancy Sensors market. Analyze key drivers, emerging trends, and competitive landscapes to inform strategic decisions in building automation, smart homes, and energy management. Understand market dynamics, growth trajectories, and regional dominance, focusing on applications in lighting control, HVAC, and security surveillance across residential and commercial buildings. Explore market segmentation, technological innovations, and future opportunities within industrial, aerospace & defence, healthcare, and consumer electronics end-user industries.
Wireless Occupancy Sensors Industry Market Dynamics & Structure
The global wireless occupancy sensors market is characterized by a moderate to high degree of market concentration, with a few key players holding significant market share. Technological innovation is the primary driver, fueled by the increasing demand for energy efficiency, enhanced security, and improved occupant comfort. Regulatory frameworks, such as building energy codes and smart city initiatives, are also playing a crucial role in shaping market adoption. Competitive product substitutes include wired occupancy sensors and manual control systems, but the flexibility and ease of installation of wireless solutions are increasingly favored. End-user demographics are shifting towards a greater acceptance of smart building technologies, particularly among younger generations and businesses seeking operational cost reductions. Mergers and acquisitions (M&A) are a notable trend, with larger companies acquiring innovative startups to expand their product portfolios and market reach. For instance, the historical period (2019-2024) saw approximately 15 M&A deals focused on acquiring AI-powered sensing technologies and advanced connectivity solutions, indicating a strong consolidation drive.
- Market Concentration: Dominated by key players like Honeywell International Inc., Schneider Electric, and Signify (formerly Philips Lighting), with a growing presence of specialized IoT solution providers.
- Technological Innovation Drivers: Advancements in IoT connectivity (Wi-Fi, Bluetooth Mesh, Zigbee), miniaturization of sensors, AI-powered analytics for occupancy prediction, and integration with smart building platforms.
- Regulatory Frameworks: Mandates for energy-efficient buildings, smart city development programs, and growing awareness of occupant health and well-being.
- Competitive Product Substitutes: Wired occupancy sensors, timers, manual switches, and basic motion detectors.
- End-User Demographics: Increasing adoption by millennials and Gen Z in residential settings, and by facility managers and sustainability officers in commercial and industrial sectors.
- M&A Trends: Strategic acquisitions focused on enhancing AI capabilities, expanding geographical reach, and integrating sensor data with broader building management systems.
Wireless Occupancy Sensors Industry Growth Trends & Insights
The wireless occupancy sensors industry is poised for substantial growth, driven by a confluence of technological advancements, evolving consumer preferences, and a global emphasis on sustainability. The market size is projected to expand from an estimated $X.X Billion units in the Base Year 2025 to $XX.X Billion units by the Forecast Period end in 2033, exhibiting a Compound Annual Growth Rate (CAGR) of approximately XX.X%. This robust expansion is underpinned by increasingly sophisticated adoption rates, moving beyond basic lighting control to sophisticated HVAC optimization and advanced security surveillance applications. Technological disruptions, such as the proliferation of low-power wide-area networks (LPWAN) and the integration of edge computing capabilities within sensor devices, are further enhancing performance and enabling new functionalities. Consumer behavior shifts are evident in the growing demand for smart and automated environments that offer convenience, energy savings, and personalized experiences. The rise of the Internet of Things (IoT) ecosystem has normalized the integration of connected devices into daily life, creating a receptive market for wireless occupancy sensors. The penetration of wireless occupancy sensors in commercial buildings is expected to reach XX% by 2030, up from approximately XX% in 2024, highlighting a significant market penetration opportunity. In residential buildings, this figure is projected to climb to XX% by 2030, driven by falling device costs and increasing consumer awareness of smart home benefits. The evolution of sensor accuracy, with advancements in infrared, ultrasonic, and dual-technology sensors, ensures more reliable data for building management systems. Furthermore, the integration of artificial intelligence (AI) and machine learning (ML) algorithms is enabling predictive maintenance, optimized space utilization, and enhanced occupant safety. The pandemic also highlighted the importance of granular occupancy data for managing building capacity and improving air quality, accelerating the adoption of these sensors in various sectors.
Dominant Regions, Countries, or Segments in Wireless Occupancy Sensors Industry
The Commercial Buildings segment, specifically within Lighting Control applications, is currently the dominant force driving growth in the wireless occupancy sensors industry. This dominance is propelled by a combination of economic policies, stringent energy efficiency regulations, and the substantial operational cost savings that wireless occupancy sensors offer to businesses. North America, particularly the United States, stands out as a leading country due to its early adoption of smart building technologies and robust government incentives for energy-efficient infrastructure.
Dominant Segment Analysis:
- Building Type: Commercial Buildings are leading due to mandatory energy codes, corporate sustainability goals, and the high potential for energy savings in large office spaces, retail environments, and educational institutions. The market share of commercial buildings within the overall wireless occupancy sensors market is estimated to be XX% in 2025.
- Application: Lighting Control remains the primary application, accounting for an estimated XX% market share in 2025. This is driven by the direct and measurable impact on electricity consumption. HVAC control is a rapidly growing secondary application, with an estimated XX% market share in 2025, as smart systems begin to integrate occupancy data for optimized climate control. Security Surveillance, with an estimated XX% market share in 2025, is experiencing steady growth, particularly in areas requiring advanced people counting and presence detection.
- End-user Industry: The Industrial sector, with an estimated XX% market share in 2025, is a significant contributor due to its focus on operational efficiency and safety. Healthcare facilities, with an estimated XX% market share in 2025, are increasingly adopting these sensors for patient comfort, infection control, and efficient resource allocation. Aerospace & Defence, with an estimated XX% market share in 2025, utilizes these sensors for specialized applications requiring high reliability and security.
Regional Dominance Drivers:
- North America: Strong emphasis on energy conservation, government incentives (e.g., tax credits), and a high adoption rate of smart home and building technologies. Significant market share is attributed to the United States and Canada.
- Europe: Stringent energy efficiency directives (e.g., EU Green Deal), growing awareness of climate change, and substantial investment in smart city initiatives across countries like Germany, France, and the United Kingdom.
- Asia Pacific: Rapid urbanization, increasing disposable income, and government focus on developing smart infrastructure in countries such as China and India are fueling significant growth.
The growth potential within these dominant segments and regions is substantial, driven by the continuous development of more integrated and intelligent sensor solutions.
Wireless Occupancy Sensors Industry Product Landscape
The product landscape of wireless occupancy sensors is characterized by increasing sophistication and a diverse range of technological implementations. Key innovations include the development of multi-sensor devices that combine passive infrared (PIR), ultrasonic, and even thermal imaging technologies for highly accurate occupancy detection and differentiation of occupant presence versus general motion. Advanced features now include embedded AI for learning occupancy patterns, enabling predictive scheduling and personalized environmental control. Connectivity options are expanding beyond traditional Wi-Fi and Bluetooth to include low-power, long-range protocols like LoRaWAN and NB-IoT, making large-scale deployments in industrial and outdoor environments more feasible. Performance metrics are continually improving with enhanced sensitivity, reduced false triggers, extended battery life for battery-powered units (often exceeding 5 years), and faster response times. Unique selling propositions often revolve around seamless integration with existing building management systems (BMS), enhanced data analytics capabilities for energy management, and user-friendly mobile applications for configuration and monitoring.
Key Drivers, Barriers & Challenges in Wireless Occupancy Sensors Industry
Key Drivers:
- Energy Efficiency Mandates: Government regulations and corporate sustainability goals are the primary catalysts, driving demand for technologies that reduce energy consumption in lighting and HVAC systems.
- Cost Savings: Measurable reductions in operational expenses through optimized energy usage and improved facility management.
- Technological Advancements: Miniaturization, improved sensor accuracy, and the integration of AI/ML are making wireless occupancy sensors more effective and versatile.
- Smart Building & IoT Adoption: The growing prevalence of connected devices and smart infrastructure creates a receptive market for integrated sensor solutions.
- Occupant Comfort & Well-being: Demand for personalized and optimized environments that respond to human presence.
Barriers & Challenges:
- Initial Installation Costs: While decreasing, the upfront investment for large-scale deployments can still be a barrier for some organizations.
- Interoperability Issues: Ensuring seamless integration between sensors from different manufacturers and existing building management systems can be complex.
- Data Security & Privacy Concerns: The collection of occupancy data raises concerns about privacy and the need for robust cybersecurity measures.
- Reliability in Harsh Environments: Ensuring consistent performance in extreme temperatures, dusty conditions, or areas with high electromagnetic interference.
- Lack of Skilled Workforce: A shortage of trained professionals for installation, configuration, and maintenance of complex smart building systems.
- Supply Chain Disruptions: Global supply chain volatility can impact component availability and production timelines. The estimated impact on production schedules due to supply chain issues can range from 5% to 15% delays in extreme cases.
Emerging Opportunities in Wireless Occupancy Sensors Industry
Emerging opportunities in the wireless occupancy sensors industry are vast and diverse. The integration of wireless occupancy sensors with advanced AI and machine learning platforms presents a significant opportunity for predictive space utilization analytics, enabling businesses to optimize office layouts, reduce energy waste from underutilized areas, and enhance employee productivity. The burgeoning smart city initiatives worldwide offer a substantial market for sensors deployed in public spaces, smart street lighting, and traffic management systems, contributing to urban efficiency and sustainability. Furthermore, the growing demand for personalized comfort and health monitoring in smart homes and healthcare facilities opens doors for sensors that can detect not only presence but also subtle changes in temperature, air quality, and even individual activity levels, leading to proactive well-being interventions. The "as-a-service" model for smart building technology, including sensor deployment and data management, is also gaining traction, offering a subscription-based approach that lowers upfront costs for end-users and creates recurring revenue streams for providers.
Growth Accelerators in the Wireless Occupancy Sensors Industry Industry
Several factors are acting as significant growth accelerators for the wireless occupancy sensors industry. Technological breakthroughs in sensor fusion, combining data from multiple sensor types (e.g., PIR, ultrasonic, thermal, and even Wi-Fi sensing), are leading to unprecedented accuracy and granular insights into space utilization and occupant behavior. The increasing development and adoption of open standards and protocols (e.g., Matter) are significantly improving interoperability, simplifying integration, and expanding the ecosystem for wireless occupancy sensors, thereby accelerating market penetration. Strategic partnerships between sensor manufacturers, building management system providers, and software developers are creating comprehensive smart building solutions that offer greater value to end-users. Furthermore, the global push towards net-zero carbon emissions and increasing energy costs are compelling organizations to invest in energy-efficient solutions, with wireless occupancy sensors being a cornerstone of these efforts. The expansion of wireless infrastructure, particularly 5G and LPWAN technologies, is also enabling wider deployment of sensors in previously inaccessible or cost-prohibitive locations.
Key Players Shaping the Wireless Occupancy Sensors Industry Market
- Hubbell Incorporated
- Honeywell International Inc.
- Legrand SA
- Leviton Manufacturing Co Inc.
- Lutron Electronics Co Inc.
- Eaton Corporation PLC
- Johnson Controls Inc.
- Koninklijke Philips NV
- Schneider Electric
- Acuity Brands Inc.
- General Electric Company
Notable Milestones in Wireless Occupancy Sensors Industry Sector
- 2021: Launch of new AI-powered occupancy sensors capable of differentiating between static and moving objects for more accurate space utilization data.
- 2022: Introduction of Matter-compatible wireless occupancy sensors, enhancing interoperability with a wider range of smart home devices.
- 2022: Significant advancements in low-power wide-area network (LPWAN) integration, enabling large-scale deployments in industrial and outdoor applications.
- 2023: Increased adoption of dual-technology sensors (e.g., PIR + Ultrasonic) in commercial spaces to reduce false alarms and improve energy savings.
- 2023: Expansion of wireless occupancy sensing into healthcare for patient monitoring and optimizing room usage.
- 2024: Development of advanced analytics platforms that leverage occupancy data for predictive maintenance and energy demand forecasting.
In-Depth Wireless Occupancy Sensors Industry Market Outlook
The future outlook for the wireless occupancy sensors industry is exceptionally promising, driven by a confluence of accelerating growth factors. Continued advancements in AI and machine learning will unlock deeper insights into space utilization and occupant behavior, paving the way for truly intelligent buildings. The increasing demand for sustainable and energy-efficient solutions, coupled with supportive government policies, will solidify the position of wireless occupancy sensors as essential components of modern infrastructure. The expansion of IoT ecosystems and the ongoing development of robust wireless communication technologies will further broaden deployment possibilities. Strategic collaborations and the emergence of innovative business models, such as "sensors-as-a-service," will democratize access to these technologies and foster widespread adoption across residential, commercial, and industrial sectors. The market is poised for sustained high growth, with significant opportunities for innovation and market expansion in the coming years.
Wireless Occupancy Sensors Industry Segmentation
-
1. Application
- 1.1. Lighting Control
- 1.2. HVAC
- 1.3. Security Surveillance
-
2. Building Type
- 2.1. Residential Buildings
- 2.2. Commercial Buildings
-
3. End-user Industry
- 3.1. Industrial
- 3.2. Aerospace & Defence
- 3.3. Healthcare
- 3.4. Consumer Electronics
- 3.5. Other End-user Industries
Wireless Occupancy Sensors Industry Segmentation By Geography
-
1. North America
- 1.1. United States
- 1.2. Canada
-
2. Europe
- 2.1. United Kingdom
- 2.2. France
- 2.3. Germany
- 2.4. Russia
- 2.5. Rest of Europe
-
3. Asia Pacific
- 3.1. China
- 3.2. Japan
- 3.3. India
- 3.4. Rest of Asia Pacific
-
4. Latin America
- 4.1. Brazil
- 4.2. Argentina
- 4.3. Maxico
- 4.4. Rest of Latin America
- 5. Middle East
-
6. Saudi Arabia
- 6.1. United Arab Emirates
- 6.2. South Africa
- 6.3. Rest of Middle East
Wireless Occupancy Sensors Industry Regional Market Share
Geographic Coverage of Wireless Occupancy Sensors Industry
Wireless Occupancy Sensors Industry REPORT HIGHLIGHTS
| Aspects | Details |
|---|---|
| Study Period | 2020-2034 |
| Base Year | 2025 |
| Estimated Year | 2026 |
| Forecast Period | 2026-2034 |
| Historical Period | 2020-2025 |
| Growth Rate | CAGR of 15.9% from 2020-2034 |
| Segmentation |
|
Table of Contents
- 1. Introduction
- 1.1. Research Scope
- 1.2. Market Segmentation
- 1.3. Research Methodology
- 1.4. Definitions and Assumptions
- 2. Executive Summary
- 2.1. Introduction
- 3. Market Dynamics
- 3.1. Introduction
- 3.2. Market Drivers
- 3.2.1. ; Growing Demand for Green Energy; Growing Demmand for Easily Installable and Interoperable devices
- 3.3. Market Restrains
- 3.3.1. ; False Triggering of Switches
- 3.4. Market Trends
- 3.4.1. Smart City Initiatives to Stimulate the Growth of Wireless Occupancy Sensor Market
- 4. Market Factor Analysis
- 4.1. Porters Five Forces
- 4.2. Supply/Value Chain
- 4.3. PESTEL analysis
- 4.4. Market Entropy
- 4.5. Patent/Trademark Analysis
- 5. Global Wireless Occupancy Sensors Industry Analysis, Insights and Forecast, 2020-2032
- 5.1. Market Analysis, Insights and Forecast - by Application
- 5.1.1. Lighting Control
- 5.1.2. HVAC
- 5.1.3. Security Surveillance
- 5.2. Market Analysis, Insights and Forecast - by Building Type
- 5.2.1. Residential Buildings
- 5.2.2. Commercial Buildings
- 5.3. Market Analysis, Insights and Forecast - by End-user Industry
- 5.3.1. Industrial
- 5.3.2. Aerospace & Defence
- 5.3.3. Healthcare
- 5.3.4. Consumer Electronics
- 5.3.5. Other End-user Industries
- 5.4. Market Analysis, Insights and Forecast - by Region
- 5.4.1. North America
- 5.4.2. Europe
- 5.4.3. Asia Pacific
- 5.4.4. Latin America
- 5.4.5. Middle East
- 5.4.6. Saudi Arabia
- 5.1. Market Analysis, Insights and Forecast - by Application
- 6. North America Wireless Occupancy Sensors Industry Analysis, Insights and Forecast, 2020-2032
- 6.1. Market Analysis, Insights and Forecast - by Application
- 6.1.1. Lighting Control
- 6.1.2. HVAC
- 6.1.3. Security Surveillance
- 6.2. Market Analysis, Insights and Forecast - by Building Type
- 6.2.1. Residential Buildings
- 6.2.2. Commercial Buildings
- 6.3. Market Analysis, Insights and Forecast - by End-user Industry
- 6.3.1. Industrial
- 6.3.2. Aerospace & Defence
- 6.3.3. Healthcare
- 6.3.4. Consumer Electronics
- 6.3.5. Other End-user Industries
- 6.1. Market Analysis, Insights and Forecast - by Application
- 7. Europe Wireless Occupancy Sensors Industry Analysis, Insights and Forecast, 2020-2032
- 7.1. Market Analysis, Insights and Forecast - by Application
- 7.1.1. Lighting Control
- 7.1.2. HVAC
- 7.1.3. Security Surveillance
- 7.2. Market Analysis, Insights and Forecast - by Building Type
- 7.2.1. Residential Buildings
- 7.2.2. Commercial Buildings
- 7.3. Market Analysis, Insights and Forecast - by End-user Industry
- 7.3.1. Industrial
- 7.3.2. Aerospace & Defence
- 7.3.3. Healthcare
- 7.3.4. Consumer Electronics
- 7.3.5. Other End-user Industries
- 7.1. Market Analysis, Insights and Forecast - by Application
- 8. Asia Pacific Wireless Occupancy Sensors Industry Analysis, Insights and Forecast, 2020-2032
- 8.1. Market Analysis, Insights and Forecast - by Application
- 8.1.1. Lighting Control
- 8.1.2. HVAC
- 8.1.3. Security Surveillance
- 8.2. Market Analysis, Insights and Forecast - by Building Type
- 8.2.1. Residential Buildings
- 8.2.2. Commercial Buildings
- 8.3. Market Analysis, Insights and Forecast - by End-user Industry
- 8.3.1. Industrial
- 8.3.2. Aerospace & Defence
- 8.3.3. Healthcare
- 8.3.4. Consumer Electronics
- 8.3.5. Other End-user Industries
- 8.1. Market Analysis, Insights and Forecast - by Application
- 9. Latin America Wireless Occupancy Sensors Industry Analysis, Insights and Forecast, 2020-2032
- 9.1. Market Analysis, Insights and Forecast - by Application
- 9.1.1. Lighting Control
- 9.1.2. HVAC
- 9.1.3. Security Surveillance
- 9.2. Market Analysis, Insights and Forecast - by Building Type
- 9.2.1. Residential Buildings
- 9.2.2. Commercial Buildings
- 9.3. Market Analysis, Insights and Forecast - by End-user Industry
- 9.3.1. Industrial
- 9.3.2. Aerospace & Defence
- 9.3.3. Healthcare
- 9.3.4. Consumer Electronics
- 9.3.5. Other End-user Industries
- 9.1. Market Analysis, Insights and Forecast - by Application
- 10. Middle East Wireless Occupancy Sensors Industry Analysis, Insights and Forecast, 2020-2032
- 10.1. Market Analysis, Insights and Forecast - by Application
- 10.1.1. Lighting Control
- 10.1.2. HVAC
- 10.1.3. Security Surveillance
- 10.2. Market Analysis, Insights and Forecast - by Building Type
- 10.2.1. Residential Buildings
- 10.2.2. Commercial Buildings
- 10.3. Market Analysis, Insights and Forecast - by End-user Industry
- 10.3.1. Industrial
- 10.3.2. Aerospace & Defence
- 10.3.3. Healthcare
- 10.3.4. Consumer Electronics
- 10.3.5. Other End-user Industries
- 10.1. Market Analysis, Insights and Forecast - by Application
- 11. Saudi Arabia Wireless Occupancy Sensors Industry Analysis, Insights and Forecast, 2020-2032
- 11.1. Market Analysis, Insights and Forecast - by Application
- 11.1.1. Lighting Control
- 11.1.2. HVAC
- 11.1.3. Security Surveillance
- 11.2. Market Analysis, Insights and Forecast - by Building Type
- 11.2.1. Residential Buildings
- 11.2.2. Commercial Buildings
- 11.3. Market Analysis, Insights and Forecast - by End-user Industry
- 11.3.1. Industrial
- 11.3.2. Aerospace & Defence
- 11.3.3. Healthcare
- 11.3.4. Consumer Electronics
- 11.3.5. Other End-user Industries
- 11.1. Market Analysis, Insights and Forecast - by Application
- 12. Competitive Analysis
- 12.1. Global Market Share Analysis 2025
- 12.2. Company Profiles
- 12.2.1 Hubbell Incorporated*List Not Exhaustive
- 12.2.1.1. Overview
- 12.2.1.2. Products
- 12.2.1.3. SWOT Analysis
- 12.2.1.4. Recent Developments
- 12.2.1.5. Financials (Based on Availability)
- 12.2.2 Honeywell International Inc
- 12.2.2.1. Overview
- 12.2.2.2. Products
- 12.2.2.3. SWOT Analysis
- 12.2.2.4. Recent Developments
- 12.2.2.5. Financials (Based on Availability)
- 12.2.3 Legrand SA
- 12.2.3.1. Overview
- 12.2.3.2. Products
- 12.2.3.3. SWOT Analysis
- 12.2.3.4. Recent Developments
- 12.2.3.5. Financials (Based on Availability)
- 12.2.4 Leviton Manufacturing Co Inc
- 12.2.4.1. Overview
- 12.2.4.2. Products
- 12.2.4.3. SWOT Analysis
- 12.2.4.4. Recent Developments
- 12.2.4.5. Financials (Based on Availability)
- 12.2.5 Lutron Electronics Co Inc
- 12.2.5.1. Overview
- 12.2.5.2. Products
- 12.2.5.3. SWOT Analysis
- 12.2.5.4. Recent Developments
- 12.2.5.5. Financials (Based on Availability)
- 12.2.6 Eaton Corporation PLC
- 12.2.6.1. Overview
- 12.2.6.2. Products
- 12.2.6.3. SWOT Analysis
- 12.2.6.4. Recent Developments
- 12.2.6.5. Financials (Based on Availability)
- 12.2.7 Johnson Controls Inc
- 12.2.7.1. Overview
- 12.2.7.2. Products
- 12.2.7.3. SWOT Analysis
- 12.2.7.4. Recent Developments
- 12.2.7.5. Financials (Based on Availability)
- 12.2.8 Koninklijke Philips NV
- 12.2.8.1. Overview
- 12.2.8.2. Products
- 12.2.8.3. SWOT Analysis
- 12.2.8.4. Recent Developments
- 12.2.8.5. Financials (Based on Availability)
- 12.2.9 Schneider Electric
- 12.2.9.1. Overview
- 12.2.9.2. Products
- 12.2.9.3. SWOT Analysis
- 12.2.9.4. Recent Developments
- 12.2.9.5. Financials (Based on Availability)
- 12.2.10 Acuity Brands Inc
- 12.2.10.1. Overview
- 12.2.10.2. Products
- 12.2.10.3. SWOT Analysis
- 12.2.10.4. Recent Developments
- 12.2.10.5. Financials (Based on Availability)
- 12.2.11 General Electric Company
- 12.2.11.1. Overview
- 12.2.11.2. Products
- 12.2.11.3. SWOT Analysis
- 12.2.11.4. Recent Developments
- 12.2.11.5. Financials (Based on Availability)
- 12.2.1 Hubbell Incorporated*List Not Exhaustive
List of Figures
- Figure 1: Global Wireless Occupancy Sensors Industry Revenue Breakdown (billion, %) by Region 2025 & 2033
- Figure 2: North America Wireless Occupancy Sensors Industry Revenue (billion), by Application 2025 & 2033
- Figure 3: North America Wireless Occupancy Sensors Industry Revenue Share (%), by Application 2025 & 2033
- Figure 4: North America Wireless Occupancy Sensors Industry Revenue (billion), by Building Type 2025 & 2033
- Figure 5: North America Wireless Occupancy Sensors Industry Revenue Share (%), by Building Type 2025 & 2033
- Figure 6: North America Wireless Occupancy Sensors Industry Revenue (billion), by End-user Industry 2025 & 2033
- Figure 7: North America Wireless Occupancy Sensors Industry Revenue Share (%), by End-user Industry 2025 & 2033
- Figure 8: North America Wireless Occupancy Sensors Industry Revenue (billion), by Country 2025 & 2033
- Figure 9: North America Wireless Occupancy Sensors Industry Revenue Share (%), by Country 2025 & 2033
- Figure 10: Europe Wireless Occupancy Sensors Industry Revenue (billion), by Application 2025 & 2033
- Figure 11: Europe Wireless Occupancy Sensors Industry Revenue Share (%), by Application 2025 & 2033
- Figure 12: Europe Wireless Occupancy Sensors Industry Revenue (billion), by Building Type 2025 & 2033
- Figure 13: Europe Wireless Occupancy Sensors Industry Revenue Share (%), by Building Type 2025 & 2033
- Figure 14: Europe Wireless Occupancy Sensors Industry Revenue (billion), by End-user Industry 2025 & 2033
- Figure 15: Europe Wireless Occupancy Sensors Industry Revenue Share (%), by End-user Industry 2025 & 2033
- Figure 16: Europe Wireless Occupancy Sensors Industry Revenue (billion), by Country 2025 & 2033
- Figure 17: Europe Wireless Occupancy Sensors Industry Revenue Share (%), by Country 2025 & 2033
- Figure 18: Asia Pacific Wireless Occupancy Sensors Industry Revenue (billion), by Application 2025 & 2033
- Figure 19: Asia Pacific Wireless Occupancy Sensors Industry Revenue Share (%), by Application 2025 & 2033
- Figure 20: Asia Pacific Wireless Occupancy Sensors Industry Revenue (billion), by Building Type 2025 & 2033
- Figure 21: Asia Pacific Wireless Occupancy Sensors Industry Revenue Share (%), by Building Type 2025 & 2033
- Figure 22: Asia Pacific Wireless Occupancy Sensors Industry Revenue (billion), by End-user Industry 2025 & 2033
- Figure 23: Asia Pacific Wireless Occupancy Sensors Industry Revenue Share (%), by End-user Industry 2025 & 2033
- Figure 24: Asia Pacific Wireless Occupancy Sensors Industry Revenue (billion), by Country 2025 & 2033
- Figure 25: Asia Pacific Wireless Occupancy Sensors Industry Revenue Share (%), by Country 2025 & 2033
- Figure 26: Latin America Wireless Occupancy Sensors Industry Revenue (billion), by Application 2025 & 2033
- Figure 27: Latin America Wireless Occupancy Sensors Industry Revenue Share (%), by Application 2025 & 2033
- Figure 28: Latin America Wireless Occupancy Sensors Industry Revenue (billion), by Building Type 2025 & 2033
- Figure 29: Latin America Wireless Occupancy Sensors Industry Revenue Share (%), by Building Type 2025 & 2033
- Figure 30: Latin America Wireless Occupancy Sensors Industry Revenue (billion), by End-user Industry 2025 & 2033
- Figure 31: Latin America Wireless Occupancy Sensors Industry Revenue Share (%), by End-user Industry 2025 & 2033
- Figure 32: Latin America Wireless Occupancy Sensors Industry Revenue (billion), by Country 2025 & 2033
- Figure 33: Latin America Wireless Occupancy Sensors Industry Revenue Share (%), by Country 2025 & 2033
- Figure 34: Middle East Wireless Occupancy Sensors Industry Revenue (billion), by Application 2025 & 2033
- Figure 35: Middle East Wireless Occupancy Sensors Industry Revenue Share (%), by Application 2025 & 2033
- Figure 36: Middle East Wireless Occupancy Sensors Industry Revenue (billion), by Building Type 2025 & 2033
- Figure 37: Middle East Wireless Occupancy Sensors Industry Revenue Share (%), by Building Type 2025 & 2033
- Figure 38: Middle East Wireless Occupancy Sensors Industry Revenue (billion), by End-user Industry 2025 & 2033
- Figure 39: Middle East Wireless Occupancy Sensors Industry Revenue Share (%), by End-user Industry 2025 & 2033
- Figure 40: Middle East Wireless Occupancy Sensors Industry Revenue (billion), by Country 2025 & 2033
- Figure 41: Middle East Wireless Occupancy Sensors Industry Revenue Share (%), by Country 2025 & 2033
- Figure 42: Saudi Arabia Wireless Occupancy Sensors Industry Revenue (billion), by Application 2025 & 2033
- Figure 43: Saudi Arabia Wireless Occupancy Sensors Industry Revenue Share (%), by Application 2025 & 2033
- Figure 44: Saudi Arabia Wireless Occupancy Sensors Industry Revenue (billion), by Building Type 2025 & 2033
- Figure 45: Saudi Arabia Wireless Occupancy Sensors Industry Revenue Share (%), by Building Type 2025 & 2033
- Figure 46: Saudi Arabia Wireless Occupancy Sensors Industry Revenue (billion), by End-user Industry 2025 & 2033
- Figure 47: Saudi Arabia Wireless Occupancy Sensors Industry Revenue Share (%), by End-user Industry 2025 & 2033
- Figure 48: Saudi Arabia Wireless Occupancy Sensors Industry Revenue (billion), by Country 2025 & 2033
- Figure 49: Saudi Arabia Wireless Occupancy Sensors Industry Revenue Share (%), by Country 2025 & 2033
List of Tables
- Table 1: Global Wireless Occupancy Sensors Industry Revenue billion Forecast, by Application 2020 & 2033
- Table 2: Global Wireless Occupancy Sensors Industry Revenue billion Forecast, by Building Type 2020 & 2033
- Table 3: Global Wireless Occupancy Sensors Industry Revenue billion Forecast, by End-user Industry 2020 & 2033
- Table 4: Global Wireless Occupancy Sensors Industry Revenue billion Forecast, by Region 2020 & 2033
- Table 5: Global Wireless Occupancy Sensors Industry Revenue billion Forecast, by Application 2020 & 2033
- Table 6: Global Wireless Occupancy Sensors Industry Revenue billion Forecast, by Building Type 2020 & 2033
- Table 7: Global Wireless Occupancy Sensors Industry Revenue billion Forecast, by End-user Industry 2020 & 2033
- Table 8: Global Wireless Occupancy Sensors Industry Revenue billion Forecast, by Country 2020 & 2033
- Table 9: United States Wireless Occupancy Sensors Industry Revenue (billion) Forecast, by Application 2020 & 2033
- Table 10: Canada Wireless Occupancy Sensors Industry Revenue (billion) Forecast, by Application 2020 & 2033
- Table 11: Global Wireless Occupancy Sensors Industry Revenue billion Forecast, by Application 2020 & 2033
- Table 12: Global Wireless Occupancy Sensors Industry Revenue billion Forecast, by Building Type 2020 & 2033
- Table 13: Global Wireless Occupancy Sensors Industry Revenue billion Forecast, by End-user Industry 2020 & 2033
- Table 14: Global Wireless Occupancy Sensors Industry Revenue billion Forecast, by Country 2020 & 2033
- Table 15: United Kingdom Wireless Occupancy Sensors Industry Revenue (billion) Forecast, by Application 2020 & 2033
- Table 16: France Wireless Occupancy Sensors Industry Revenue (billion) Forecast, by Application 2020 & 2033
- Table 17: Germany Wireless Occupancy Sensors Industry Revenue (billion) Forecast, by Application 2020 & 2033
- Table 18: Russia Wireless Occupancy Sensors Industry Revenue (billion) Forecast, by Application 2020 & 2033
- Table 19: Rest of Europe Wireless Occupancy Sensors Industry Revenue (billion) Forecast, by Application 2020 & 2033
- Table 20: Global Wireless Occupancy Sensors Industry Revenue billion Forecast, by Application 2020 & 2033
- Table 21: Global Wireless Occupancy Sensors Industry Revenue billion Forecast, by Building Type 2020 & 2033
- Table 22: Global Wireless Occupancy Sensors Industry Revenue billion Forecast, by End-user Industry 2020 & 2033
- Table 23: Global Wireless Occupancy Sensors Industry Revenue billion Forecast, by Country 2020 & 2033
- Table 24: China Wireless Occupancy Sensors Industry Revenue (billion) Forecast, by Application 2020 & 2033
- Table 25: Japan Wireless Occupancy Sensors Industry Revenue (billion) Forecast, by Application 2020 & 2033
- Table 26: India Wireless Occupancy Sensors Industry Revenue (billion) Forecast, by Application 2020 & 2033
- Table 27: Rest of Asia Pacific Wireless Occupancy Sensors Industry Revenue (billion) Forecast, by Application 2020 & 2033
- Table 28: Global Wireless Occupancy Sensors Industry Revenue billion Forecast, by Application 2020 & 2033
- Table 29: Global Wireless Occupancy Sensors Industry Revenue billion Forecast, by Building Type 2020 & 2033
- Table 30: Global Wireless Occupancy Sensors Industry Revenue billion Forecast, by End-user Industry 2020 & 2033
- Table 31: Global Wireless Occupancy Sensors Industry Revenue billion Forecast, by Country 2020 & 2033
- Table 32: Brazil Wireless Occupancy Sensors Industry Revenue (billion) Forecast, by Application 2020 & 2033
- Table 33: Argentina Wireless Occupancy Sensors Industry Revenue (billion) Forecast, by Application 2020 & 2033
- Table 34: Maxico Wireless Occupancy Sensors Industry Revenue (billion) Forecast, by Application 2020 & 2033
- Table 35: Rest of Latin America Wireless Occupancy Sensors Industry Revenue (billion) Forecast, by Application 2020 & 2033
- Table 36: Global Wireless Occupancy Sensors Industry Revenue billion Forecast, by Application 2020 & 2033
- Table 37: Global Wireless Occupancy Sensors Industry Revenue billion Forecast, by Building Type 2020 & 2033
- Table 38: Global Wireless Occupancy Sensors Industry Revenue billion Forecast, by End-user Industry 2020 & 2033
- Table 39: Global Wireless Occupancy Sensors Industry Revenue billion Forecast, by Country 2020 & 2033
- Table 40: Global Wireless Occupancy Sensors Industry Revenue billion Forecast, by Application 2020 & 2033
- Table 41: Global Wireless Occupancy Sensors Industry Revenue billion Forecast, by Building Type 2020 & 2033
- Table 42: Global Wireless Occupancy Sensors Industry Revenue billion Forecast, by End-user Industry 2020 & 2033
- Table 43: Global Wireless Occupancy Sensors Industry Revenue billion Forecast, by Country 2020 & 2033
- Table 44: United Arab Emirates Wireless Occupancy Sensors Industry Revenue (billion) Forecast, by Application 2020 & 2033
- Table 45: South Africa Wireless Occupancy Sensors Industry Revenue (billion) Forecast, by Application 2020 & 2033
- Table 46: Rest of Middle East Wireless Occupancy Sensors Industry Revenue (billion) Forecast, by Application 2020 & 2033
Frequently Asked Questions
1. What is the projected Compound Annual Growth Rate (CAGR) of the Wireless Occupancy Sensors Industry?
The projected CAGR is approximately 15.9%.
2. Which companies are prominent players in the Wireless Occupancy Sensors Industry?
Key companies in the market include Hubbell Incorporated*List Not Exhaustive, Honeywell International Inc, Legrand SA, Leviton Manufacturing Co Inc, Lutron Electronics Co Inc, Eaton Corporation PLC, Johnson Controls Inc, Koninklijke Philips NV, Schneider Electric, Acuity Brands Inc, General Electric Company.
3. What are the main segments of the Wireless Occupancy Sensors Industry?
The market segments include Application, Building Type, End-user Industry.
4. Can you provide details about the market size?
The market size is estimated to be USD 1.1 billion as of 2022.
5. What are some drivers contributing to market growth?
; Growing Demand for Green Energy; Growing Demmand for Easily Installable and Interoperable devices.
6. What are the notable trends driving market growth?
Smart City Initiatives to Stimulate the Growth of Wireless Occupancy Sensor Market.
7. Are there any restraints impacting market growth?
; False Triggering of Switches.
8. Can you provide examples of recent developments in the market?
N/A
9. What pricing options are available for accessing the report?
Pricing options include single-user, multi-user, and enterprise licenses priced at USD 4750, USD 5250, and USD 8750 respectively.
10. Is the market size provided in terms of value or volume?
The market size is provided in terms of value, measured in billion.
11. Are there any specific market keywords associated with the report?
Yes, the market keyword associated with the report is "Wireless Occupancy Sensors Industry," which aids in identifying and referencing the specific market segment covered.
12. How do I determine which pricing option suits my needs best?
The pricing options vary based on user requirements and access needs. Individual users may opt for single-user licenses, while businesses requiring broader access may choose multi-user or enterprise licenses for cost-effective access to the report.
13. Are there any additional resources or data provided in the Wireless Occupancy Sensors Industry report?
While the report offers comprehensive insights, it's advisable to review the specific contents or supplementary materials provided to ascertain if additional resources or data are available.
14. How can I stay updated on further developments or reports in the Wireless Occupancy Sensors Industry?
To stay informed about further developments, trends, and reports in the Wireless Occupancy Sensors Industry, consider subscribing to industry newsletters, following relevant companies and organizations, or regularly checking reputable industry news sources and publications.
Methodology
Step 1 - Identification of Relevant Samples Size from Population Database


Step 2 - Approaches for Defining Global Market Size (Value, Volume* & Price*)

Note*: In applicable scenarios
Step 3 - Data Sources
Primary Research
- Web Analytics
- Survey Reports
- Research Institute
- Latest Research Reports
- Opinion Leaders
Secondary Research
- Annual Reports
- White Paper
- Latest Press Release
- Industry Association
- Paid Database
- Investor Presentations

Step 4 - Data Triangulation
Involves using different sources of information in order to increase the validity of a study
These sources are likely to be stakeholders in a program - participants, other researchers, program staff, other community members, and so on.
Then we put all data in single framework & apply various statistical tools to find out the dynamic on the market.
During the analysis stage, feedback from the stakeholder groups would be compared to determine areas of agreement as well as areas of divergence