

Key Insights
The global Telecom Cable Market is projected to reach $48.51 billion by 2025, demonstrating a Compound Annual Growth Rate (CAGR) of 2.94%. This growth is driven by the escalating demand for high-speed internet, the rapid deployment of 5G infrastructure, and the continuous surge in data traffic. The expansion of data centers, supporting cloud computing and Big Data, significantly fuels the need for specialized cabling. Enhanced CATV services and upgrades to enterprise and residential networks further bolster market momentum. A notable trend is the increasing adoption of fiber optic cables, favored for their superior bandwidth and transmission capabilities, crucial for emerging technologies like IoT and AI.
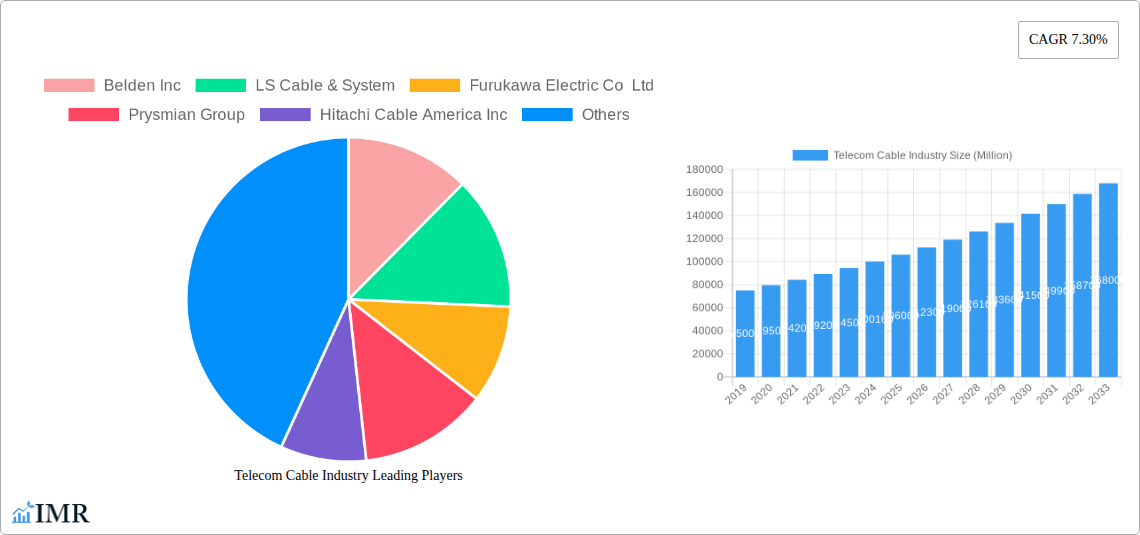
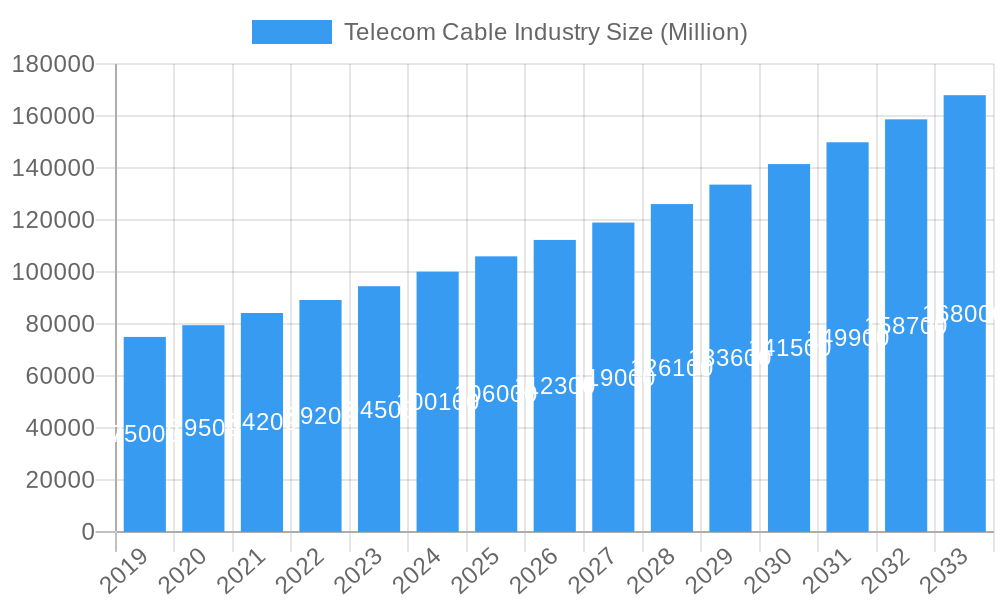
Telecom Cable Industry Market Size (In Billion)
Key market drivers include the proliferation of smart devices, the growing need for efficient data transmission in telecommunications, and government initiatives focused on digital infrastructure development. Challenges such as the substantial upfront investment for fiber optic deployment, potential raw material supply chain disruptions, and complex regulatory environments may impact growth rates. Nevertheless, the market is characterized by innovation in cable technology, prioritizing higher speeds, enhanced reliability, and improved signal integrity. Segments including coaxial, fiber optic, data center, mobile network, twisted pair, and LAN cables are expected to experience growth, with fiber optics and data center cables anticipated to lead technological advancements and expansion.
Telecom Cable Industry Company Market Share
Telecom Cable Industry: Market Analysis, Growth Trends & Future Outlook (2019-2033)
Unlock deep insights into the global Telecom Cable Industry with this comprehensive report. Covering market dynamics, growth trends, regional dominance, and key player strategies, this study provides a critical analysis of the market's evolution from 2019 to 2033. Essential for industry professionals, investors, and strategists seeking to capitalize on the burgeoning demand for advanced connectivity solutions.
This report meticulously examines the telecom cable market size, focusing on critical segments like fiber optic cables, data center cables, and mobile network infrastructure. We analyze the competitive landscape, highlighting leading manufacturers such as Prysmian Group, Belden Inc, and Hengtong Group Co Ltd, and their strategic initiatives. Explore the impact of technological advancements, including the increasing adoption of high-speed internet, 5G deployment, and the evolving needs of cloud computing. Understand the intricate interplay between parent and child markets, identifying key growth drivers and emerging opportunities within this dynamic sector. All values are presented in Million units for clear quantitative assessment.
Telecom Cable Industry Market Dynamics & Structure
The global telecom cable industry exhibits a moderately concentrated market structure, driven by significant capital investment requirements and established technological expertise. Key players like Prysmian Group, LS Cable & System, and Furukawa Electric Co Ltd hold substantial market shares, reflecting their extensive manufacturing capabilities and global distribution networks. Technological innovation acts as a primary driver, with continuous advancements in optical fiber technology and data transmission speeds reshaping market demands. Regulatory frameworks, particularly those promoting broadband expansion and digital infrastructure development, significantly influence market growth. Competitive product substitutes, such as wireless communication technologies, present a dynamic challenge, but the inherent reliability and capacity of wired solutions maintain their dominance in critical applications. End-user demographics are shifting towards a greater demand for high-bandwidth services from both residential and enterprise sectors, fueled by the proliferation of connected devices and the increasing reliance on cloud-based services. Mergers and acquisitions (M&A) are a consistent feature, enabling companies to expand their product portfolios, geographical reach, and technological capabilities. For instance, recent M&A activities have focused on consolidating the supply chain for critical raw materials and integrating advanced manufacturing processes. The barrier to entry for new players remains high due to the need for substantial R&D investment and adherence to stringent industry standards.
- Market Concentration: Moderately concentrated with a few dominant global players.
- Technological Innovation: Continuous advancements in fiber optics and data transmission are key differentiators.
- Regulatory Frameworks: Government initiatives for broadband expansion are significant growth enablers.
- Competitive Product Substitutes: Wireless technologies pose a challenge, but wired solutions remain critical for performance.
- End-User Demographics: Growing demand for high-bandwidth services from diverse sectors.
- M&A Trends: Strategic acquisitions focus on portfolio expansion and technological integration.
- Innovation Barriers: High R&D costs and stringent industry standards limit new entrants.
Telecom Cable Industry Growth Trends & Insights
The telecom cable industry is poised for robust growth, projected to expand at a Compound Annual Growth Rate (CAGR) of approximately 7.8% over the forecast period of 2025–2033. This expansion is primarily fueled by the insatiable global demand for higher bandwidth and faster internet speeds, driven by the increasing adoption of digital technologies across all sectors. The market size, estimated at USD 65,500 Million in 2025, is expected to reach USD 117,800 Million by 2033. Key growth trends include the accelerating deployment of fiber optic cables for broadband internet access, essential for supporting the ever-increasing volume of data traffic generated by streaming services, online gaming, and remote work. The proliferation of data centers globally, catering to cloud computing and big data analytics, further bolsters the demand for high-performance data center cables.
The mobile networks segment is experiencing a significant upswing due to the ongoing rollout of 5G technology, which requires substantial upgrades to existing infrastructure, including new fiber optic backhaul. This technological disruption is a major catalyst, driving investment in advanced cabling solutions that can support the higher frequencies and increased data throughput demanded by 5G. Consumer behavior shifts are also playing a crucial role; as more households and businesses rely on seamless connectivity, the demand for reliable and high-capacity internet is paramount. This translates directly into increased market penetration for fiber optic and advanced LAN cables.
The telecommunication applications segment remains the largest contributor, encompassing the backbone infrastructure for fixed-line and mobile communication networks. Within this, the fiber optic cable segment is anticipated to witness the fastest growth due to its superior bandwidth and performance capabilities compared to traditional copper cables. Adoption rates for fiber-to-the-home (FTTH) initiatives are steadily increasing worldwide, supported by government subsidies and the recognition of its strategic importance for digital economies.
Furthermore, the rise of the Internet of Things (IoT) and the increasing use of smart devices across residential, industrial, and automotive sectors are creating new avenues for growth, necessitating robust and reliable cabling solutions. The shift towards more sustainable and energy-efficient cabling materials is also an emerging trend, influencing product development and manufacturing processes. The historical period (2019–2024) saw steady growth, primarily driven by 4G expansion and initial fiber optic deployments. The base year of 2025 marks a pivotal point, with 5G and intensified broadband initiatives set to accelerate this trajectory significantly. The intricate parent and child market dynamics, where advancements in one area of connectivity directly influence the demand for specific cable types, underscore the interconnected nature of this industry.
Dominant Regions, Countries, or Segments in Telecom Cable Industry
The fiber optic cable segment stands as the undisputed leader and primary growth engine within the global telecom cable industry. Its dominance is intrinsically linked to the ubiquitous demand for high-speed, high-capacity internet across both developed and developing economies. The inherent superiority of fiber optics in terms of bandwidth, speed, and signal integrity over traditional coaxial or twisted pair cables makes it indispensable for modern telecommunication infrastructure. This segment is projected to account for over 50% of the total market revenue during the forecast period. The underlying drivers for this dominance are multifaceted, encompassing technological advancements, robust government initiatives, and evolving consumer behavior.
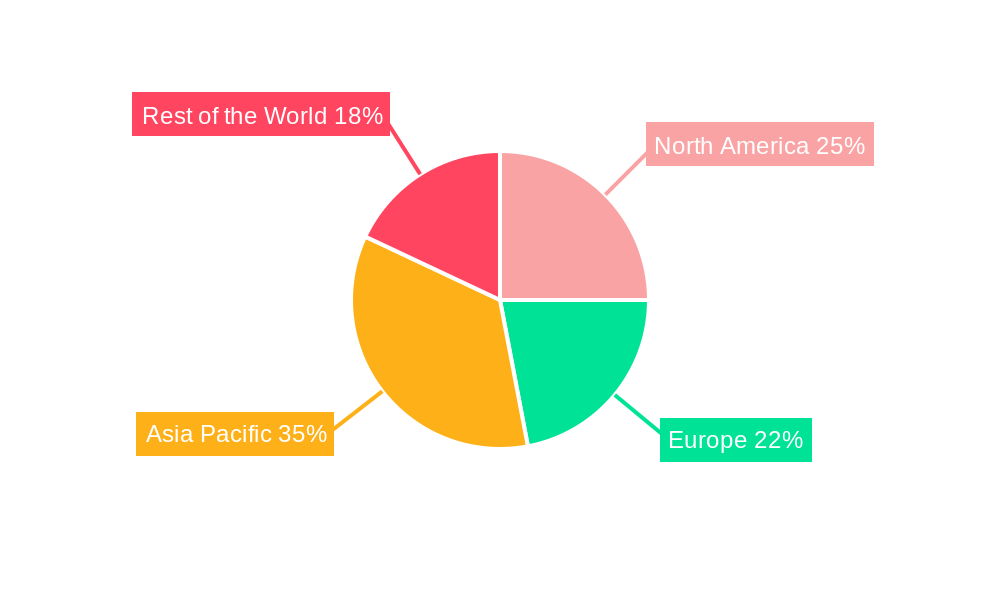
North America and Europe currently lead in the adoption of fiber optic infrastructure, driven by comprehensive broadband deployment programs and significant investments in upgrading legacy networks to support 5G and next-generation services. For instance, the United States, a key market, is experiencing substantial growth fueled by federal and state stimulus packages aimed at bridging the digital divide and expanding high-speed internet access to underserved areas. The recent USD 30 million investment by Prysmian Group to increase optical fiber cable capacity in North America exemplifies the scale of investment in this region.
Asia Pacific, particularly China and India, represents the fastest-growing region for fiber optic cables. This rapid expansion is propelled by massive government investments in national broadband networks, the burgeoning demand for digital services from a large population, and the rapid adoption of 5G technology. China's ongoing push for widespread FTTH coverage and its leadership in 5G network deployment have made it a pivotal market for fiber optic cable manufacturers.
The telecommunication applications segment, as a whole, represents the largest application area, with fiber optics serving as its backbone. Within this, mobile networks are a significant contributor to the growth of fiber optic cables, as 5G base stations require high-capacity fiber optic backhaul to manage the exponential increase in data traffic. The capacity and performance metrics of modern fiber optic cables, offering bandwidths of hundreds of gigabits per second and beyond, are crucial for supporting these applications.
Furthermore, the expansion of Data Centers globally, driven by the growth of cloud computing, big data, and AI, directly fuels the demand for high-density fiber optic cabling solutions within these facilities. The increased need for interconnectivity between servers and storage, as well as between data centers themselves, requires cables that can deliver high bandwidth with minimal latency. The market share for fiber optic cables is expected to continue its upward trajectory, outpacing other cable types due to its inherent scalability and future-proofing capabilities.
- Leading Segment: Fiber Optic Cable.
- Key Application: Telecommunication Applications, supporting mobile networks and broadband.
- Dominant Regions: North America and Asia Pacific are key growth markets.
- Growth Drivers: 5G deployment, FTTH initiatives, data center expansion, government investments.
- Market Share: Fiber optic cables are projected to hold over 50% of the market revenue.
- Performance Metrics: High bandwidth, speed, and low latency are critical for adoption.
Telecom Cable Industry Product Landscape
The telecom cable industry is characterized by a diverse and evolving product landscape driven by relentless innovation. Fiber optic cables remain at the forefront, with advancements in single-mode and multi-mode fiber technologies enabling higher bandwidth and longer transmission distances. Innovations in cable construction, such as bend-insensitive fibers and micro-duct cables, enhance durability and ease of installation in complex environments. Data center cables are witnessing a surge in demand for high-speed interconnects, including advanced copper and fiber optic solutions supporting Ethernet standards up to 400GbE and beyond. Mobile network cables are undergoing transformation with the deployment of 5G, requiring specialized cables that can handle higher frequencies and increased power delivery. Coaxial cables continue to serve the CATV market, but are increasingly being complemented or replaced by fiber optic solutions for higher quality transmission. Twisted pair cables, particularly Category 6A and above, remain essential for LAN and computer network applications where high-speed data transfer within buildings is critical. The focus is on enhancing cable performance metrics like attenuation, signal-to-noise ratio, and durability.
Key Drivers, Barriers & Challenges in Telecom Cable Industry
The telecom cable industry is propelled by several key drivers. The relentless demand for faster internet speeds and higher bandwidth, fueled by the proliferation of streaming services, online gaming, and remote work, is a primary economic driver. Government initiatives promoting digital infrastructure, such as broadband expansion programs and 5G deployment targets, serve as significant policy-driven accelerators. Technological advancements in fiber optics and networking equipment are continuously pushing the boundaries of what’s possible, creating new market opportunities. The increasing adoption of cloud computing and the exponential growth of data centers necessitate robust and high-capacity cabling solutions.
However, the industry faces significant challenges. Supply chain disruptions, particularly those related to raw materials like copper and specialized components, can lead to price volatility and production delays. Regulatory hurdles and complex permitting processes for infrastructure deployment can hinder the pace of network upgrades. Intense competitive pressures among established players and the emergence of new entrants can impact pricing and profit margins. Furthermore, the high upfront investment required for research and development of next-generation cabling technologies and the cost of deploying new infrastructure pose a substantial financial challenge for many companies. The need for skilled labor for installation and maintenance also presents a growing concern.
Emerging Opportunities in Telecom Cable Industry
Emerging opportunities within the telecom cable industry are diverse and promising. The ongoing global expansion of 5G networks presents a substantial opportunity for increased deployment of specialized fiber optic cables and related infrastructure components. The burgeoning Internet of Things (IoT) ecosystem, encompassing smart homes, smart cities, and industrial IoT (IIoT), is creating a growing demand for reliable and high-performance connectivity solutions, including specialized sensor and control cables. The continued growth of cloud computing and big data analytics is driving the expansion and upgrading of data centers, necessitating advanced high-speed interconnects and fiber optic cabling. Untapped markets in developing regions, where the rollout of basic broadband and mobile infrastructure is still in its nascent stages, offer significant growth potential. Furthermore, the development of innovative cabling materials and manufacturing processes focused on sustainability and reduced environmental impact presents an opportunity for differentiation and market leadership.
Growth Accelerators in the Telecom Cable Industry Industry
Several key catalysts are accelerating long-term growth in the telecom cable industry. Technological breakthroughs, particularly in optical fiber technology, such as advancements in fiber density and transmission capacity, are critical growth accelerators. Strategic partnerships and collaborations between cable manufacturers, telecommunication service providers, and technology companies are crucial for driving innovation and facilitating large-scale network deployments. Market expansion strategies, including focusing on emerging economies and niche applications like healthcare and industrial automation, are opening up new revenue streams. The increasing government support and investment in digital infrastructure development globally, recognizing its importance for economic competitiveness and social development, continues to be a major growth accelerator. The rising demand for bandwidth-intensive applications and services, driven by changing consumer habits and business needs, ensures a sustained market expansion trajectory.
Key Players Shaping the Telecom Cable Industry Market
- Belden Inc
- LS Cable & System
- Furukawa Electric Co Ltd
- Prysmian Group
- Hitachi Cable America Inc
- Fujikura Ltd
- Leoni AG
- Commscope Inc
- Hengtong Group Co Ltd
- Sumitomo Electric Industries Ltd
Notable Milestones in Telecom Cable Industry Sector
- April 2021: Hitachi Cable America completed the roll-out of CableSuite as an innovative IT platform called CableERP. It is the complete ERP solution for wire and cable manufacturers, based on the advanced Microsoft Dynamics D365. It comes with all features that are needed for this specific industry.
- May 2022: Prysmian Group, the energy and telecom cable systems industry provider, strengthens its commitment to meet the increasing demand for optical fiber broadband connectivity driven by the Federal and State governments' stimulus packages. The Company announced it is investing an additional USD 30 million to the USD 85 million already announced last year to increase optical fiber cable capacity and capability in plants in North America.
In-Depth Telecom Cable Industry Market Outlook
The future market outlook for the telecom cable industry is exceptionally bright, driven by the irreversible global trend towards digitalization and hyper-connectivity. Growth accelerators such as the widespread adoption of 5G, the exponential rise of data centers, and the continuous expansion of fiber-to-the-home (FTTH) initiatives will continue to fuel demand for high-performance cabling solutions. Strategic opportunities lie in the untapped markets of developing regions and the increasing need for specialized cables in emerging applications like the Internet of Things (IoT) and edge computing. Companies that focus on innovation in advanced fiber optics, sustainable manufacturing practices, and robust supply chain management are best positioned to capitalize on this expansive growth. The industry’s trajectory is firmly set towards higher bandwidth, greater efficiency, and more pervasive connectivity, making it a vital sector for global economic and social progress.
Telecom Cable Industry Segmentation
-
1. Type
- 1.1. Coaxial Cable
- 1.2. Fiber Optic
- 1.3. Data Center Cables
- 1.4. Mobile Networks
- 1.5. Twisted Pair Cable
- 1.6. LAN Cables
-
2. Application
- 2.1. Telecommunication applications
- 2.2. Data Centers
- 2.3. CATV
- 2.4. Computer Network
- 2.5. Others
Telecom Cable Industry Segmentation By Geography
-
1. North America
- 1.1. United States
- 1.2. Canada
- 1.3. Mexico
-
2. Europe
- 2.1. Germany
- 2.2. France
- 2.3. Uk
- 2.4. Rest of Europe
-
3. Asia Pacific
- 3.1. Japan
- 3.2. China
- 3.3. India
- 3.4. Rest of Asia Pacific
- 4. Rest of the World
Telecom Cable Industry Regional Market Share
Geographic Coverage of Telecom Cable Industry
Telecom Cable Industry REPORT HIGHLIGHTS
| Aspects | Details |
|---|---|
| Study Period | 2020-2034 |
| Base Year | 2025 |
| Estimated Year | 2026 |
| Forecast Period | 2026-2034 |
| Historical Period | 2020-2025 |
| Growth Rate | CAGR of 2.94% from 2020-2034 |
| Segmentation |
|
Table of Contents
- 1. Introduction
- 1.1. Research Scope
- 1.2. Market Segmentation
- 1.3. Research Objective
- 1.4. Definitions and Assumptions
- 2. Executive Summary
- 2.1. Market Snapshot
- 3. Market Dynamics
- 3.1. Market Drivers
- 3.2. Market Restrains
- 3.3. Market Trends
- 3.4. Market Opportunities
- 4. Market Factor Analysis
- 4.1. Porters Five Forces
- 4.1.1. Bargaining Power of Suppliers
- 4.1.2. Bargaining Power of Buyers
- 4.1.3. Threat of New Entrants
- 4.1.4. Threat of Substitutes
- 4.1.5. Competitive Rivalry
- 4.2. PESTEL analysis
- 4.3. BCG Analysis
- 4.3.1. Stars (High Growth, High Market Share)
- 4.3.2. Cash Cows (Low Growth, High Market Share)
- 4.3.3. Question Mark (High Growth, Low Market Share)
- 4.3.4. Dogs (Low Growth, Low Market Share)
- 4.4. Ansoff Matrix Analysis
- 4.5. Supply Chain Analysis
- 4.6. Regulatory Landscape
- 4.7. Current Market Potential and Opportunity Assessment (TAM–SAM–SOM Framework)
- 4.8. IMR Analyst Note
- 4.1. Porters Five Forces
- 5. Market Analysis, Insights and Forecast 2021-2033
- 5.1. Market Analysis, Insights and Forecast - by Type
- 5.1.1. Coaxial Cable
- 5.1.2. Fiber Optic
- 5.1.3. Data Center Cables
- 5.1.4. Mobile Networks
- 5.1.5. Twisted Pair Cable
- 5.1.6. LAN Cables
- 5.2. Market Analysis, Insights and Forecast - by Application
- 5.2.1. Telecommunication applications
- 5.2.2. Data Centers
- 5.2.3. CATV
- 5.2.4. Computer Network
- 5.2.5. Others
- 5.3. Market Analysis, Insights and Forecast - by Region
- 5.3.1. North America
- 5.3.2. Europe
- 5.3.3. Asia Pacific
- 5.3.4. Rest of the World
- 5.1. Market Analysis, Insights and Forecast - by Type
- 6. Global Telecom Cable Industry Analysis, Insights and Forecast, 2021-2033
- 6.1. Market Analysis, Insights and Forecast - by Type
- 6.1.1. Coaxial Cable
- 6.1.2. Fiber Optic
- 6.1.3. Data Center Cables
- 6.1.4. Mobile Networks
- 6.1.5. Twisted Pair Cable
- 6.1.6. LAN Cables
- 6.2. Market Analysis, Insights and Forecast - by Application
- 6.2.1. Telecommunication applications
- 6.2.2. Data Centers
- 6.2.3. CATV
- 6.2.4. Computer Network
- 6.2.5. Others
- 6.1. Market Analysis, Insights and Forecast - by Type
- 7. North America Telecom Cable Industry Analysis, Insights and Forecast, 2020-2032
- 7.1. Market Analysis, Insights and Forecast - by Type
- 7.1.1. Coaxial Cable
- 7.1.2. Fiber Optic
- 7.1.3. Data Center Cables
- 7.1.4. Mobile Networks
- 7.1.5. Twisted Pair Cable
- 7.1.6. LAN Cables
- 7.2. Market Analysis, Insights and Forecast - by Application
- 7.2.1. Telecommunication applications
- 7.2.2. Data Centers
- 7.2.3. CATV
- 7.2.4. Computer Network
- 7.2.5. Others
- 7.1. Market Analysis, Insights and Forecast - by Type
- 8. Europe Telecom Cable Industry Analysis, Insights and Forecast, 2020-2032
- 8.1. Market Analysis, Insights and Forecast - by Type
- 8.1.1. Coaxial Cable
- 8.1.2. Fiber Optic
- 8.1.3. Data Center Cables
- 8.1.4. Mobile Networks
- 8.1.5. Twisted Pair Cable
- 8.1.6. LAN Cables
- 8.2. Market Analysis, Insights and Forecast - by Application
- 8.2.1. Telecommunication applications
- 8.2.2. Data Centers
- 8.2.3. CATV
- 8.2.4. Computer Network
- 8.2.5. Others
- 8.1. Market Analysis, Insights and Forecast - by Type
- 9. Asia Pacific Telecom Cable Industry Analysis, Insights and Forecast, 2020-2032
- 9.1. Market Analysis, Insights and Forecast - by Type
- 9.1.1. Coaxial Cable
- 9.1.2. Fiber Optic
- 9.1.3. Data Center Cables
- 9.1.4. Mobile Networks
- 9.1.5. Twisted Pair Cable
- 9.1.6. LAN Cables
- 9.2. Market Analysis, Insights and Forecast - by Application
- 9.2.1. Telecommunication applications
- 9.2.2. Data Centers
- 9.2.3. CATV
- 9.2.4. Computer Network
- 9.2.5. Others
- 9.1. Market Analysis, Insights and Forecast - by Type
- 10. Rest of the World Telecom Cable Industry Analysis, Insights and Forecast, 2020-2032
- 10.1. Market Analysis, Insights and Forecast - by Type
- 10.1.1. Coaxial Cable
- 10.1.2. Fiber Optic
- 10.1.3. Data Center Cables
- 10.1.4. Mobile Networks
- 10.1.5. Twisted Pair Cable
- 10.1.6. LAN Cables
- 10.2. Market Analysis, Insights and Forecast - by Application
- 10.2.1. Telecommunication applications
- 10.2.2. Data Centers
- 10.2.3. CATV
- 10.2.4. Computer Network
- 10.2.5. Others
- 10.1. Market Analysis, Insights and Forecast - by Type
- 11. Competitive Analysis
- 11.1. Company Profiles
- 11.1.1 Belden Inc
- 11.1.1.1. Company Overview
- 11.1.1.2. Products
- 11.1.1.3. Company Financials
- 11.1.1.4. SWOT Analysis
- 11.1.2 LS Cable & System
- 11.1.2.1. Company Overview
- 11.1.2.2. Products
- 11.1.2.3. Company Financials
- 11.1.2.4. SWOT Analysis
- 11.1.3 Furukawa Electric Co Ltd
- 11.1.3.1. Company Overview
- 11.1.3.2. Products
- 11.1.3.3. Company Financials
- 11.1.3.4. SWOT Analysis
- 11.1.4 Prysmian Group
- 11.1.4.1. Company Overview
- 11.1.4.2. Products
- 11.1.4.3. Company Financials
- 11.1.4.4. SWOT Analysis
- 11.1.5 Hitachi Cable America Inc
- 11.1.5.1. Company Overview
- 11.1.5.2. Products
- 11.1.5.3. Company Financials
- 11.1.5.4. SWOT Analysis
- 11.1.6 Fujikura Ltd
- 11.1.6.1. Company Overview
- 11.1.6.2. Products
- 11.1.6.3. Company Financials
- 11.1.6.4. SWOT Analysis
- 11.1.7 Leoni AG
- 11.1.7.1. Company Overview
- 11.1.7.2. Products
- 11.1.7.3. Company Financials
- 11.1.7.4. SWOT Analysis
- 11.1.8 Commscope Inc
- 11.1.8.1. Company Overview
- 11.1.8.2. Products
- 11.1.8.3. Company Financials
- 11.1.8.4. SWOT Analysis
- 11.1.9 Hengtong Group Co Ltd
- 11.1.9.1. Company Overview
- 11.1.9.2. Products
- 11.1.9.3. Company Financials
- 11.1.9.4. SWOT Analysis
- 11.1.10 Sumitomo Electric Industries Ltd
- 11.1.10.1. Company Overview
- 11.1.10.2. Products
- 11.1.10.3. Company Financials
- 11.1.10.4. SWOT Analysis
- 11.1.1 Belden Inc
- 11.2. Market Entropy
- 11.2.1 Company's Key Areas Served
- 11.2.2 Recent Developments
- 11.3. Company Market Share Analysis 2025
- 11.3.1 Top 5 Companies Market Share Analysis
- 11.3.2 Top 3 Companies Market Share Analysis
- 11.4. List of Potential Customers
- 12. Research Methodology
List of Figures
- Figure 1: Global Telecom Cable Industry Revenue Breakdown (billion, %) by Region 2025 & 2033
- Figure 2: North America Telecom Cable Industry Revenue (billion), by Type 2025 & 2033
- Figure 3: North America Telecom Cable Industry Revenue Share (%), by Type 2025 & 2033
- Figure 4: North America Telecom Cable Industry Revenue (billion), by Application 2025 & 2033
- Figure 5: North America Telecom Cable Industry Revenue Share (%), by Application 2025 & 2033
- Figure 6: North America Telecom Cable Industry Revenue (billion), by Country 2025 & 2033
- Figure 7: North America Telecom Cable Industry Revenue Share (%), by Country 2025 & 2033
- Figure 8: Europe Telecom Cable Industry Revenue (billion), by Type 2025 & 2033
- Figure 9: Europe Telecom Cable Industry Revenue Share (%), by Type 2025 & 2033
- Figure 10: Europe Telecom Cable Industry Revenue (billion), by Application 2025 & 2033
- Figure 11: Europe Telecom Cable Industry Revenue Share (%), by Application 2025 & 2033
- Figure 12: Europe Telecom Cable Industry Revenue (billion), by Country 2025 & 2033
- Figure 13: Europe Telecom Cable Industry Revenue Share (%), by Country 2025 & 2033
- Figure 14: Asia Pacific Telecom Cable Industry Revenue (billion), by Type 2025 & 2033
- Figure 15: Asia Pacific Telecom Cable Industry Revenue Share (%), by Type 2025 & 2033
- Figure 16: Asia Pacific Telecom Cable Industry Revenue (billion), by Application 2025 & 2033
- Figure 17: Asia Pacific Telecom Cable Industry Revenue Share (%), by Application 2025 & 2033
- Figure 18: Asia Pacific Telecom Cable Industry Revenue (billion), by Country 2025 & 2033
- Figure 19: Asia Pacific Telecom Cable Industry Revenue Share (%), by Country 2025 & 2033
- Figure 20: Rest of the World Telecom Cable Industry Revenue (billion), by Type 2025 & 2033
- Figure 21: Rest of the World Telecom Cable Industry Revenue Share (%), by Type 2025 & 2033
- Figure 22: Rest of the World Telecom Cable Industry Revenue (billion), by Application 2025 & 2033
- Figure 23: Rest of the World Telecom Cable Industry Revenue Share (%), by Application 2025 & 2033
- Figure 24: Rest of the World Telecom Cable Industry Revenue (billion), by Country 2025 & 2033
- Figure 25: Rest of the World Telecom Cable Industry Revenue Share (%), by Country 2025 & 2033
List of Tables
- Table 1: Global Telecom Cable Industry Revenue billion Forecast, by Type 2020 & 2033
- Table 2: Global Telecom Cable Industry Revenue billion Forecast, by Application 2020 & 2033
- Table 3: Global Telecom Cable Industry Revenue billion Forecast, by Region 2020 & 2033
- Table 4: Global Telecom Cable Industry Revenue billion Forecast, by Type 2020 & 2033
- Table 5: Global Telecom Cable Industry Revenue billion Forecast, by Application 2020 & 2033
- Table 6: Global Telecom Cable Industry Revenue billion Forecast, by Country 2020 & 2033
- Table 7: United States Telecom Cable Industry Revenue (billion) Forecast, by Application 2020 & 2033
- Table 8: Canada Telecom Cable Industry Revenue (billion) Forecast, by Application 2020 & 2033
- Table 9: Mexico Telecom Cable Industry Revenue (billion) Forecast, by Application 2020 & 2033
- Table 10: Global Telecom Cable Industry Revenue billion Forecast, by Type 2020 & 2033
- Table 11: Global Telecom Cable Industry Revenue billion Forecast, by Application 2020 & 2033
- Table 12: Global Telecom Cable Industry Revenue billion Forecast, by Country 2020 & 2033
- Table 13: Germany Telecom Cable Industry Revenue (billion) Forecast, by Application 2020 & 2033
- Table 14: France Telecom Cable Industry Revenue (billion) Forecast, by Application 2020 & 2033
- Table 15: Uk Telecom Cable Industry Revenue (billion) Forecast, by Application 2020 & 2033
- Table 16: Rest of Europe Telecom Cable Industry Revenue (billion) Forecast, by Application 2020 & 2033
- Table 17: Global Telecom Cable Industry Revenue billion Forecast, by Type 2020 & 2033
- Table 18: Global Telecom Cable Industry Revenue billion Forecast, by Application 2020 & 2033
- Table 19: Global Telecom Cable Industry Revenue billion Forecast, by Country 2020 & 2033
- Table 20: Japan Telecom Cable Industry Revenue (billion) Forecast, by Application 2020 & 2033
- Table 21: China Telecom Cable Industry Revenue (billion) Forecast, by Application 2020 & 2033
- Table 22: India Telecom Cable Industry Revenue (billion) Forecast, by Application 2020 & 2033
- Table 23: Rest of Asia Pacific Telecom Cable Industry Revenue (billion) Forecast, by Application 2020 & 2033
- Table 24: Global Telecom Cable Industry Revenue billion Forecast, by Type 2020 & 2033
- Table 25: Global Telecom Cable Industry Revenue billion Forecast, by Application 2020 & 2033
- Table 26: Global Telecom Cable Industry Revenue billion Forecast, by Country 2020 & 2033
Frequently Asked Questions
1. What is the projected Compound Annual Growth Rate (CAGR) of the Telecom Cable Industry?
The projected CAGR is approximately 2.94%.
2. Which companies are prominent players in the Telecom Cable Industry?
Key companies in the market include Belden Inc, LS Cable & System, Furukawa Electric Co Ltd, Prysmian Group, Hitachi Cable America Inc, Fujikura Ltd, Leoni AG, Commscope Inc, Hengtong Group Co Ltd, Sumitomo Electric Industries Ltd.
3. What are the main segments of the Telecom Cable Industry?
The market segments include Type, Application.
4. Can you provide details about the market size?
The market size is estimated to be USD 48.51 billion as of 2022.
5. What are some drivers contributing to market growth?
Rise in the use of Internet and increasing acceptance of smartphones; Increased demand for Internet of Things (IoT).
6. What are the notable trends driving market growth?
Rising Internet Penetration and Adoption of Smartphones.
7. Are there any restraints impacting market growth?
High cost of operation and maintenance of Telecom Cable.
8. Can you provide examples of recent developments in the market?
April 2021 - Hitachi Cable America completed the roll-out of CableSuite as an innovative IT platform called CableERP. It is the complete ERP solution for wire and cable manufacturers, based on the advanced Microsoft Dynamics D365. It comes with all features that are needed for this specific industry.
9. What pricing options are available for accessing the report?
Pricing options include single-user, multi-user, and enterprise licenses priced at USD 4750, USD 5250, and USD 8750 respectively.
10. Is the market size provided in terms of value or volume?
The market size is provided in terms of value, measured in billion.
11. Are there any specific market keywords associated with the report?
Yes, the market keyword associated with the report is "Telecom Cable Industry," which aids in identifying and referencing the specific market segment covered.
12. How do I determine which pricing option suits my needs best?
The pricing options vary based on user requirements and access needs. Individual users may opt for single-user licenses, while businesses requiring broader access may choose multi-user or enterprise licenses for cost-effective access to the report.
13. Are there any additional resources or data provided in the Telecom Cable Industry report?
While the report offers comprehensive insights, it's advisable to review the specific contents or supplementary materials provided to ascertain if additional resources or data are available.
14. How can I stay updated on further developments or reports in the Telecom Cable Industry?
To stay informed about further developments, trends, and reports in the Telecom Cable Industry, consider subscribing to industry newsletters, following relevant companies and organizations, or regularly checking reputable industry news sources and publications.
Methodology
Step 1 - Identification of Relevant Samples Size from Population Database


Step 2 - Approaches for Defining Global Market Size (Value, Volume* & Price*)

Note*: In applicable scenarios
Step 3 - Data Sources
Primary Research
- Web Analytics
- Survey Reports
- Research Institute
- Latest Research Reports
- Opinion Leaders
Secondary Research
- Annual Reports
- White Paper
- Latest Press Release
- Industry Association
- Paid Database
- Investor Presentations

Step 4 - Data Triangulation
Involves using different sources of information in order to increase the validity of a study
These sources are likely to be stakeholders in a program - participants, other researchers, program staff, other community members, and so on.
Then we put all data in single framework & apply various statistical tools to find out the dynamic on the market.
During the analysis stage, feedback from the stakeholder groups would be compared to determine areas of agreement as well as areas of divergence