

Key Insights
The Asia-Pacific (APAC) plastic caps and closures market is poised for significant expansion, driven by robust growth in the food & beverage, pharmaceutical, and personal care sectors. The market is projected to exhibit a Compound Annual Growth Rate (CAGR) of 5.52%. This expansion is attributed to escalating consumer demand, rising disposable incomes, and the increasing prevalence of packaged goods. Plastic caps and closures are favored for their cost-effectiveness, user-friendliness, and essential role in product protection and tamper evidence. China and India are primary growth engines, characterized by high consumption and strong manufacturing capabilities.
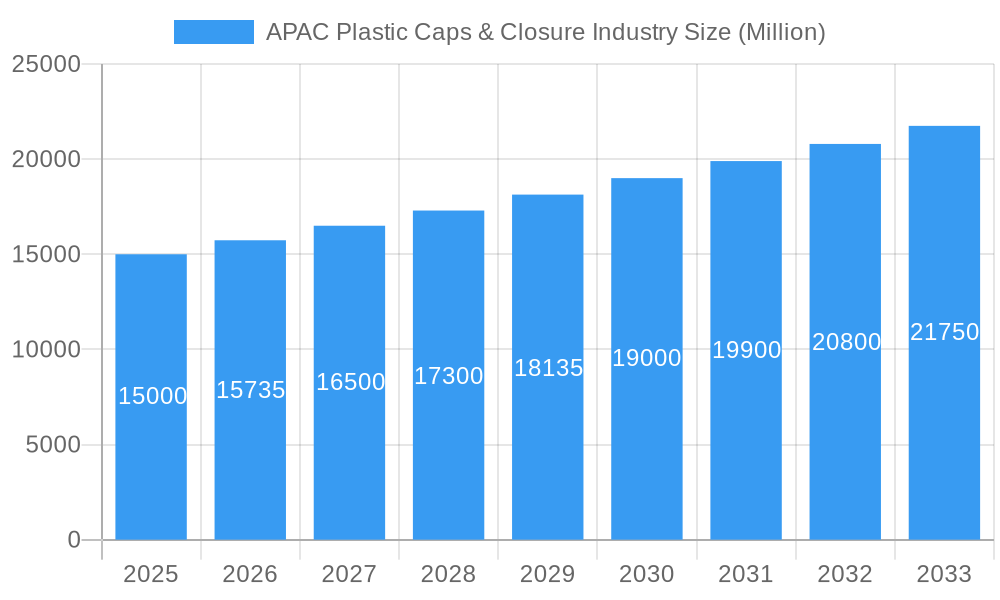
APAC Plastic Caps & Closure Industry Market Size (In Billion)
Environmental concerns are driving a shift towards sustainable alternatives, including biodegradable and recyclable options. Manufacturers are actively investing in eco-friendly packaging innovations. Key material segments include PET, PP, LDPE, and HDPE, chosen for their application suitability and economic benefits. The burgeoning e-commerce sector further amplifies demand for enhanced packaging and product protection during transit.
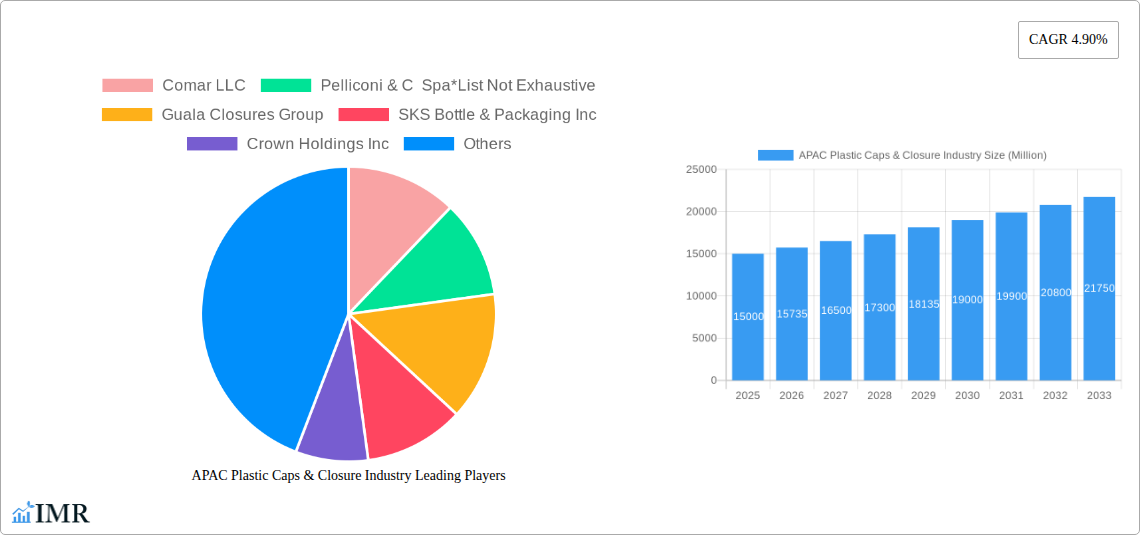
APAC Plastic Caps & Closure Industry Company Market Share
Growth projections vary across APAC sub-regions. While China and India are expected to retain leadership, mature markets like Japan and South Korea may experience moderate growth. Southeast Asia presents a substantial opportunity due to its expanding middle class and consumer base. The competitive landscape features both multinational corporations and regional players, who are pursuing strategic alliances, mergers, acquisitions, and product innovation to secure market share and adapt to evolving consumer preferences and regulatory frameworks. The market size is estimated at 85.2 billion in the base year 2025, with continued growth anticipated throughout the forecast period, subject to economic conditions and the adoption of sustainable packaging initiatives.
APAC Plastic Caps & Closure Industry Market Report: 2019-2033
This comprehensive report provides an in-depth analysis of the Asia-Pacific (APAC) plastic caps and closure industry, covering the period 2019-2033. It offers invaluable insights into market dynamics, growth trends, key players, and future opportunities, equipping businesses with the knowledge needed to navigate this dynamic sector. The report segments the market by material (PET, PP, LDPE, HDPE, and other materials), end-user industry (beverage, food, pharmaceutical, cosmetics, household chemicals, and others), and country (China, India, Japan, and Rest of APAC). The market size is presented in Million Units.
APAC Plastic Caps & Closure Industry Market Dynamics & Structure
This section analyzes the competitive landscape, technological advancements, regulatory environment, and market trends within the APAC plastic caps and closures industry. We delve into market concentration, examining the market share held by key players like Comar LLC, Guala Closures Group, and Crown Holdings Inc, among others. The report also explores the impact of mergers and acquisitions (M&A) activities, such as the June 2020 acquisition of Albea Group's dispensing business by Silgan Holdings Inc. for $900 million.
- Market Concentration: Analysis of market share distribution amongst major players and identification of dominant players. (e.g., Top 5 players hold xx% of the market share in 2024)
- Technological Innovation: Examination of advancements in materials science, manufacturing processes, and closure designs, impacting sustainability and functionality.
- Regulatory Landscape: Assessment of environmental regulations and their influence on material selection and manufacturing practices. (e.g., impact of plastic reduction policies on market growth)
- Competitive Substitutes: Evaluation of alternative packaging solutions and their potential impact on market demand. (e.g., growth of sustainable alternatives like paper closures)
- End-User Demographics: Analysis of consumer preferences and their impact on packaging choices across various end-use sectors. (e.g., changing consumer preference for eco-friendly packaging)
- M&A Activity: Analysis of recent mergers, acquisitions, and joint ventures, assessing their impact on market consolidation and competition. (e.g., xx M&A deals recorded between 2019 and 2024)
APAC Plastic Caps & Closure Industry Growth Trends & Insights
This section examines the historical and projected growth of the APAC plastic caps and closures market. We analyze market size evolution from 2019 to 2024, using data to quantify the Compound Annual Growth Rate (CAGR) and project growth to 2033. The analysis incorporates factors influencing market expansion such as evolving consumer preferences, technological disruptions, and economic growth in key APAC markets.
- Market Size Evolution (Million Units): 2019: xx, 2020: xx, 2021: xx, 2022: xx, 2023: xx, 2024: xx, 2025: xx (Base Year), 2033: xx (Forecast Year)
- CAGR (2019-2024): xx%
- Projected CAGR (2025-2033): xx%
- Market Penetration: Analysis of market penetration across different segments and countries. (e.g., penetration of sustainable closures in the beverage sector)
Dominant Regions, Countries, or Segments in APAC Plastic Caps & Closure Industry
This section identifies the leading regions, countries, and segments driving market growth. We analyze the market share and growth potential of each segment based on material type and end-user industry, highlighting factors contributing to their dominance. The analysis covers China, India, Japan, and the Rest of APAC, examining economic factors, infrastructure development, and regulatory policies impacting growth.
- China: Analysis of market size, growth drivers, and key challenges within the Chinese market. (e.g., dominance in specific closure types or end-user industries)
- India: Similar analysis for the Indian market, focusing on growth potential and specific market segments. (e.g., rising demand for closures in the food and beverage sectors)
- Japan: Analysis of the Japanese market, including its unique characteristics and challenges. (e.g., emphasis on high-quality and specialized closures)
- Rest of APAC: Aggregate analysis of smaller markets within the APAC region, including ASEAN countries, Australia, etc. (e.g., opportunities in emerging economies with rising consumerism)
- Dominant Material: Identification of the leading material (e.g., PET) and reasons for its dominance. (e.g., cost-effectiveness, recyclability)
- Dominant End-User Industry: Identification of the largest end-user segment (e.g., Beverage) and reasons for its market share. (e.g., high volume consumption of bottled water and beverages)
APAC Plastic Caps & Closure Industry Product Landscape
This section explores the various types of plastic caps and closures available in the APAC market. It focuses on product innovations, applications, and performance metrics, highlighting technological advancements in materials and designs (e.g., tamper-evident closures, child-resistant closures, closures with improved barrier properties).
Key Drivers, Barriers & Challenges in APAC Plastic Caps & Closure Industry
This section identifies the key factors driving market growth and the challenges hindering its expansion.
Key Drivers:
- Increasing demand from the food and beverage sector.
- Growing demand for convenient packaging solutions.
- Advancements in material technology leading to improved closure performance and sustainability.
- Favorable government policies promoting packaging innovations.
Key Challenges and Restraints:
- Fluctuations in raw material prices.
- Stringent environmental regulations concerning plastic waste.
- Intense competition from both domestic and international players. (e.g., pricing pressures)
- Supply chain disruptions (e.g., impact of geopolitical events on raw material availability).
Emerging Opportunities in APAC Plastic Caps & Closure Industry
This section explores emerging trends and opportunities, including untapped markets, innovative applications, and changing consumer preferences. It focuses on sustainable packaging solutions, specialized closures for niche applications, and the increasing demand for closures with enhanced functionality and improved recyclability.
Growth Accelerators in the APAC Plastic Caps & Closure Industry
The long-term growth of the APAC plastic caps and closure industry will be fueled by continued technological innovation, strategic partnerships, and market expansion into new geographical areas. The focus on sustainable solutions and increasing consumer demand for convenience packaging will further drive growth.
Key Players Shaping the APAC Plastic Caps & Closure Industry Market
- Comar LLC
- Pelliconi & C Spa
- Guala Closures Group
- SKS Bottle & Packaging Inc
- Crown Holdings Inc
- AptarGroup Inc
- Albea Group
- Coral Products PLC
- Evergreen Packaging Inc
- Nippon closures Co Ltd
- BERICAP GmbH & Co KG
- Tetra Pak International SA
- Berry Global Inc
- O Berk Company LLC
- Silgan Holdings Inc
- Closure Systems International
- MJS Packaging
- Amcor Ltd
Notable Milestones in APAC Plastic Caps & Closure Industry Sector
- June 2020: Silgan Holdings Inc. acquired the dispensing business of the Albea Group for $900 million. This significantly impacted market consolidation and strengthened Silgan's position in the sustainable packaging segment.
In-Depth APAC Plastic Caps & Closure Industry Market Outlook
The APAC plastic caps and closure market presents significant long-term growth potential, driven by factors such as rising consumer demand, technological advancements in sustainable packaging materials, and the increasing focus on enhancing product safety and convenience. Strategic partnerships and expansion into new markets will further enhance market dynamics and open up new avenues for growth and innovation.
APAC Plastic Caps & Closure Industry Segmentation
-
1. Material
- 1.1. PET
- 1.2. PP
- 1.3. LDPE and HDPE
- 1.4. Other Materials
-
2. End-user Industry
- 2.1. Beverage
- 2.2. Food
- 2.3. Pharmaceutical and Healthcare
- 2.4. Cosmetics and Toiletries
- 2.5. Househol
- 2.6. Other En
APAC Plastic Caps & Closure Industry Segmentation By Geography
-
1. North America
- 1.1. United States
- 1.2. Canada
- 1.3. Mexico
-
2. South America
- 2.1. Brazil
- 2.2. Argentina
- 2.3. Rest of South America
-
3. Europe
- 3.1. United Kingdom
- 3.2. Germany
- 3.3. France
- 3.4. Italy
- 3.5. Spain
- 3.6. Russia
- 3.7. Benelux
- 3.8. Nordics
- 3.9. Rest of Europe
-
4. Middle East & Africa
- 4.1. Turkey
- 4.2. Israel
- 4.3. GCC
- 4.4. North Africa
- 4.5. South Africa
- 4.6. Rest of Middle East & Africa
-
5. Asia Pacific
- 5.1. China
- 5.2. India
- 5.3. Japan
- 5.4. South Korea
- 5.5. ASEAN
- 5.6. Oceania
- 5.7. Rest of Asia Pacific
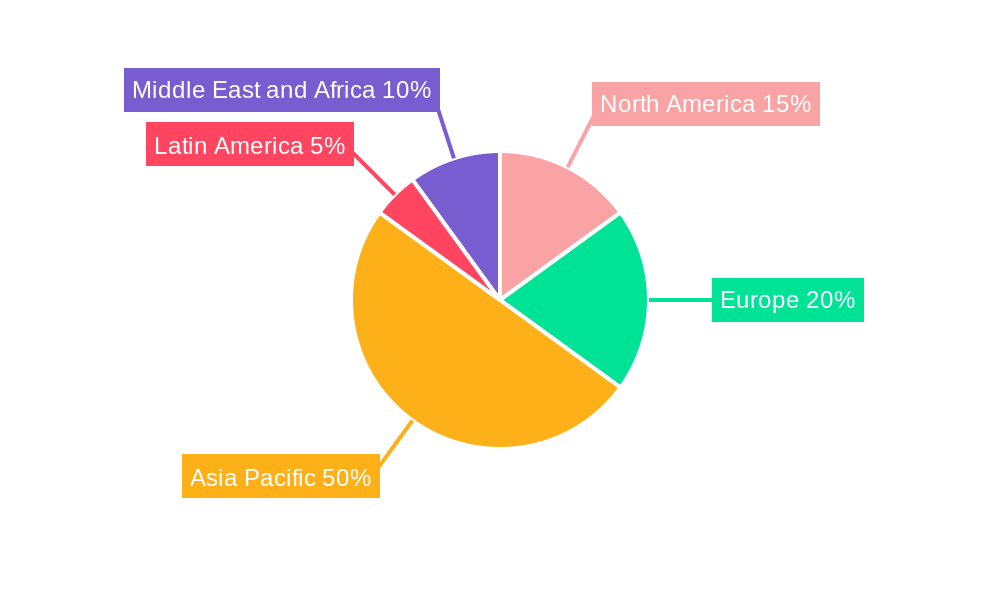
APAC Plastic Caps & Closure Industry Regional Market Share
Geographic Coverage of APAC Plastic Caps & Closure Industry
APAC Plastic Caps & Closure Industry REPORT HIGHLIGHTS
| Aspects | Details |
|---|---|
| Study Period | 2020-2034 |
| Base Year | 2025 |
| Estimated Year | 2026 |
| Forecast Period | 2026-2034 |
| Historical Period | 2020-2025 |
| Growth Rate | CAGR of 5.52% from 2020-2034 |
| Segmentation |
|
Table of Contents
- 1. Introduction
- 1.1. Research Scope
- 1.2. Market Segmentation
- 1.3. Research Methodology
- 1.4. Definitions and Assumptions
- 2. Executive Summary
- 2.1. Introduction
- 3. Market Dynamics
- 3.1. Introduction
- 3.2. Market Drivers
- 3.2.1. Growing Consumption of Single Serve Beverages; Advent of Innovative Products
- 3.3. Market Restrains
- 3.3.1. Regulations on Usage of Pet Bottles/Caps in Pharmaceutical Drugs and Food Packaging
- 3.4. Market Trends
- 3.4.1. PET is Expected to Witness Significant Growth
- 4. Market Factor Analysis
- 4.1. Porters Five Forces
- 4.2. Supply/Value Chain
- 4.3. PESTEL analysis
- 4.4. Market Entropy
- 4.5. Patent/Trademark Analysis
- 5. Global APAC Plastic Caps & Closure Industry Analysis, Insights and Forecast, 2020-2032
- 5.1. Market Analysis, Insights and Forecast - by Material
- 5.1.1. PET
- 5.1.2. PP
- 5.1.3. LDPE and HDPE
- 5.1.4. Other Materials
- 5.2. Market Analysis, Insights and Forecast - by End-user Industry
- 5.2.1. Beverage
- 5.2.2. Food
- 5.2.3. Pharmaceutical and Healthcare
- 5.2.4. Cosmetics and Toiletries
- 5.2.5. Househol
- 5.2.6. Other En
- 5.3. Market Analysis, Insights and Forecast - by Region
- 5.3.1. North America
- 5.3.2. South America
- 5.3.3. Europe
- 5.3.4. Middle East & Africa
- 5.3.5. Asia Pacific
- 5.1. Market Analysis, Insights and Forecast - by Material
- 6. North America APAC Plastic Caps & Closure Industry Analysis, Insights and Forecast, 2020-2032
- 6.1. Market Analysis, Insights and Forecast - by Material
- 6.1.1. PET
- 6.1.2. PP
- 6.1.3. LDPE and HDPE
- 6.1.4. Other Materials
- 6.2. Market Analysis, Insights and Forecast - by End-user Industry
- 6.2.1. Beverage
- 6.2.2. Food
- 6.2.3. Pharmaceutical and Healthcare
- 6.2.4. Cosmetics and Toiletries
- 6.2.5. Househol
- 6.2.6. Other En
- 6.1. Market Analysis, Insights and Forecast - by Material
- 7. South America APAC Plastic Caps & Closure Industry Analysis, Insights and Forecast, 2020-2032
- 7.1. Market Analysis, Insights and Forecast - by Material
- 7.1.1. PET
- 7.1.2. PP
- 7.1.3. LDPE and HDPE
- 7.1.4. Other Materials
- 7.2. Market Analysis, Insights and Forecast - by End-user Industry
- 7.2.1. Beverage
- 7.2.2. Food
- 7.2.3. Pharmaceutical and Healthcare
- 7.2.4. Cosmetics and Toiletries
- 7.2.5. Househol
- 7.2.6. Other En
- 7.1. Market Analysis, Insights and Forecast - by Material
- 8. Europe APAC Plastic Caps & Closure Industry Analysis, Insights and Forecast, 2020-2032
- 8.1. Market Analysis, Insights and Forecast - by Material
- 8.1.1. PET
- 8.1.2. PP
- 8.1.3. LDPE and HDPE
- 8.1.4. Other Materials
- 8.2. Market Analysis, Insights and Forecast - by End-user Industry
- 8.2.1. Beverage
- 8.2.2. Food
- 8.2.3. Pharmaceutical and Healthcare
- 8.2.4. Cosmetics and Toiletries
- 8.2.5. Househol
- 8.2.6. Other En
- 8.1. Market Analysis, Insights and Forecast - by Material
- 9. Middle East & Africa APAC Plastic Caps & Closure Industry Analysis, Insights and Forecast, 2020-2032
- 9.1. Market Analysis, Insights and Forecast - by Material
- 9.1.1. PET
- 9.1.2. PP
- 9.1.3. LDPE and HDPE
- 9.1.4. Other Materials
- 9.2. Market Analysis, Insights and Forecast - by End-user Industry
- 9.2.1. Beverage
- 9.2.2. Food
- 9.2.3. Pharmaceutical and Healthcare
- 9.2.4. Cosmetics and Toiletries
- 9.2.5. Househol
- 9.2.6. Other En
- 9.1. Market Analysis, Insights and Forecast - by Material
- 10. Asia Pacific APAC Plastic Caps & Closure Industry Analysis, Insights and Forecast, 2020-2032
- 10.1. Market Analysis, Insights and Forecast - by Material
- 10.1.1. PET
- 10.1.2. PP
- 10.1.3. LDPE and HDPE
- 10.1.4. Other Materials
- 10.2. Market Analysis, Insights and Forecast - by End-user Industry
- 10.2.1. Beverage
- 10.2.2. Food
- 10.2.3. Pharmaceutical and Healthcare
- 10.2.4. Cosmetics and Toiletries
- 10.2.5. Househol
- 10.2.6. Other En
- 10.1. Market Analysis, Insights and Forecast - by Material
- 11. Competitive Analysis
- 11.1. Global Market Share Analysis 2025
- 11.2. Company Profiles
- 11.2.1 Comar LLC
- 11.2.1.1. Overview
- 11.2.1.2. Products
- 11.2.1.3. SWOT Analysis
- 11.2.1.4. Recent Developments
- 11.2.1.5. Financials (Based on Availability)
- 11.2.2 Pelliconi & C Spa*List Not Exhaustive
- 11.2.2.1. Overview
- 11.2.2.2. Products
- 11.2.2.3. SWOT Analysis
- 11.2.2.4. Recent Developments
- 11.2.2.5. Financials (Based on Availability)
- 11.2.3 Guala Closures Group
- 11.2.3.1. Overview
- 11.2.3.2. Products
- 11.2.3.3. SWOT Analysis
- 11.2.3.4. Recent Developments
- 11.2.3.5. Financials (Based on Availability)
- 11.2.4 SKS Bottle & Packaging Inc
- 11.2.4.1. Overview
- 11.2.4.2. Products
- 11.2.4.3. SWOT Analysis
- 11.2.4.4. Recent Developments
- 11.2.4.5. Financials (Based on Availability)
- 11.2.5 Crown Holdings Inc
- 11.2.5.1. Overview
- 11.2.5.2. Products
- 11.2.5.3. SWOT Analysis
- 11.2.5.4. Recent Developments
- 11.2.5.5. Financials (Based on Availability)
- 11.2.6 AptarGroup Inc
- 11.2.6.1. Overview
- 11.2.6.2. Products
- 11.2.6.3. SWOT Analysis
- 11.2.6.4. Recent Developments
- 11.2.6.5. Financials (Based on Availability)
- 11.2.7 Albea Group
- 11.2.7.1. Overview
- 11.2.7.2. Products
- 11.2.7.3. SWOT Analysis
- 11.2.7.4. Recent Developments
- 11.2.7.5. Financials (Based on Availability)
- 11.2.8 Coral Products PLC
- 11.2.8.1. Overview
- 11.2.8.2. Products
- 11.2.8.3. SWOT Analysis
- 11.2.8.4. Recent Developments
- 11.2.8.5. Financials (Based on Availability)
- 11.2.9 Evergreen Packaging Inc
- 11.2.9.1. Overview
- 11.2.9.2. Products
- 11.2.9.3. SWOT Analysis
- 11.2.9.4. Recent Developments
- 11.2.9.5. Financials (Based on Availability)
- 11.2.10 Nippon closures Co Ltd
- 11.2.10.1. Overview
- 11.2.10.2. Products
- 11.2.10.3. SWOT Analysis
- 11.2.10.4. Recent Developments
- 11.2.10.5. Financials (Based on Availability)
- 11.2.11 BERICAP GmbH & Co KG
- 11.2.11.1. Overview
- 11.2.11.2. Products
- 11.2.11.3. SWOT Analysis
- 11.2.11.4. Recent Developments
- 11.2.11.5. Financials (Based on Availability)
- 11.2.12 Tetra Pak International SA
- 11.2.12.1. Overview
- 11.2.12.2. Products
- 11.2.12.3. SWOT Analysis
- 11.2.12.4. Recent Developments
- 11.2.12.5. Financials (Based on Availability)
- 11.2.13 Berry Global Inc
- 11.2.13.1. Overview
- 11.2.13.2. Products
- 11.2.13.3. SWOT Analysis
- 11.2.13.4. Recent Developments
- 11.2.13.5. Financials (Based on Availability)
- 11.2.14 O Berk Company LLC
- 11.2.14.1. Overview
- 11.2.14.2. Products
- 11.2.14.3. SWOT Analysis
- 11.2.14.4. Recent Developments
- 11.2.14.5. Financials (Based on Availability)
- 11.2.15 Silgan Holdings Inc
- 11.2.15.1. Overview
- 11.2.15.2. Products
- 11.2.15.3. SWOT Analysis
- 11.2.15.4. Recent Developments
- 11.2.15.5. Financials (Based on Availability)
- 11.2.16 Closure Systems International
- 11.2.16.1. Overview
- 11.2.16.2. Products
- 11.2.16.3. SWOT Analysis
- 11.2.16.4. Recent Developments
- 11.2.16.5. Financials (Based on Availability)
- 11.2.17 MJS Packaging
- 11.2.17.1. Overview
- 11.2.17.2. Products
- 11.2.17.3. SWOT Analysis
- 11.2.17.4. Recent Developments
- 11.2.17.5. Financials (Based on Availability)
- 11.2.18 Amcor Ltd
- 11.2.18.1. Overview
- 11.2.18.2. Products
- 11.2.18.3. SWOT Analysis
- 11.2.18.4. Recent Developments
- 11.2.18.5. Financials (Based on Availability)
- 11.2.1 Comar LLC
List of Figures
- Figure 1: Global APAC Plastic Caps & Closure Industry Revenue Breakdown (billion, %) by Region 2025 & 2033
- Figure 2: North America APAC Plastic Caps & Closure Industry Revenue (billion), by Material 2025 & 2033
- Figure 3: North America APAC Plastic Caps & Closure Industry Revenue Share (%), by Material 2025 & 2033
- Figure 4: North America APAC Plastic Caps & Closure Industry Revenue (billion), by End-user Industry 2025 & 2033
- Figure 5: North America APAC Plastic Caps & Closure Industry Revenue Share (%), by End-user Industry 2025 & 2033
- Figure 6: North America APAC Plastic Caps & Closure Industry Revenue (billion), by Country 2025 & 2033
- Figure 7: North America APAC Plastic Caps & Closure Industry Revenue Share (%), by Country 2025 & 2033
- Figure 8: South America APAC Plastic Caps & Closure Industry Revenue (billion), by Material 2025 & 2033
- Figure 9: South America APAC Plastic Caps & Closure Industry Revenue Share (%), by Material 2025 & 2033
- Figure 10: South America APAC Plastic Caps & Closure Industry Revenue (billion), by End-user Industry 2025 & 2033
- Figure 11: South America APAC Plastic Caps & Closure Industry Revenue Share (%), by End-user Industry 2025 & 2033
- Figure 12: South America APAC Plastic Caps & Closure Industry Revenue (billion), by Country 2025 & 2033
- Figure 13: South America APAC Plastic Caps & Closure Industry Revenue Share (%), by Country 2025 & 2033
- Figure 14: Europe APAC Plastic Caps & Closure Industry Revenue (billion), by Material 2025 & 2033
- Figure 15: Europe APAC Plastic Caps & Closure Industry Revenue Share (%), by Material 2025 & 2033
- Figure 16: Europe APAC Plastic Caps & Closure Industry Revenue (billion), by End-user Industry 2025 & 2033
- Figure 17: Europe APAC Plastic Caps & Closure Industry Revenue Share (%), by End-user Industry 2025 & 2033
- Figure 18: Europe APAC Plastic Caps & Closure Industry Revenue (billion), by Country 2025 & 2033
- Figure 19: Europe APAC Plastic Caps & Closure Industry Revenue Share (%), by Country 2025 & 2033
- Figure 20: Middle East & Africa APAC Plastic Caps & Closure Industry Revenue (billion), by Material 2025 & 2033
- Figure 21: Middle East & Africa APAC Plastic Caps & Closure Industry Revenue Share (%), by Material 2025 & 2033
- Figure 22: Middle East & Africa APAC Plastic Caps & Closure Industry Revenue (billion), by End-user Industry 2025 & 2033
- Figure 23: Middle East & Africa APAC Plastic Caps & Closure Industry Revenue Share (%), by End-user Industry 2025 & 2033
- Figure 24: Middle East & Africa APAC Plastic Caps & Closure Industry Revenue (billion), by Country 2025 & 2033
- Figure 25: Middle East & Africa APAC Plastic Caps & Closure Industry Revenue Share (%), by Country 2025 & 2033
- Figure 26: Asia Pacific APAC Plastic Caps & Closure Industry Revenue (billion), by Material 2025 & 2033
- Figure 27: Asia Pacific APAC Plastic Caps & Closure Industry Revenue Share (%), by Material 2025 & 2033
- Figure 28: Asia Pacific APAC Plastic Caps & Closure Industry Revenue (billion), by End-user Industry 2025 & 2033
- Figure 29: Asia Pacific APAC Plastic Caps & Closure Industry Revenue Share (%), by End-user Industry 2025 & 2033
- Figure 30: Asia Pacific APAC Plastic Caps & Closure Industry Revenue (billion), by Country 2025 & 2033
- Figure 31: Asia Pacific APAC Plastic Caps & Closure Industry Revenue Share (%), by Country 2025 & 2033
List of Tables
- Table 1: Global APAC Plastic Caps & Closure Industry Revenue billion Forecast, by Material 2020 & 2033
- Table 2: Global APAC Plastic Caps & Closure Industry Revenue billion Forecast, by End-user Industry 2020 & 2033
- Table 3: Global APAC Plastic Caps & Closure Industry Revenue billion Forecast, by Region 2020 & 2033
- Table 4: Global APAC Plastic Caps & Closure Industry Revenue billion Forecast, by Material 2020 & 2033
- Table 5: Global APAC Plastic Caps & Closure Industry Revenue billion Forecast, by End-user Industry 2020 & 2033
- Table 6: Global APAC Plastic Caps & Closure Industry Revenue billion Forecast, by Country 2020 & 2033
- Table 7: United States APAC Plastic Caps & Closure Industry Revenue (billion) Forecast, by Application 2020 & 2033
- Table 8: Canada APAC Plastic Caps & Closure Industry Revenue (billion) Forecast, by Application 2020 & 2033
- Table 9: Mexico APAC Plastic Caps & Closure Industry Revenue (billion) Forecast, by Application 2020 & 2033
- Table 10: Global APAC Plastic Caps & Closure Industry Revenue billion Forecast, by Material 2020 & 2033
- Table 11: Global APAC Plastic Caps & Closure Industry Revenue billion Forecast, by End-user Industry 2020 & 2033
- Table 12: Global APAC Plastic Caps & Closure Industry Revenue billion Forecast, by Country 2020 & 2033
- Table 13: Brazil APAC Plastic Caps & Closure Industry Revenue (billion) Forecast, by Application 2020 & 2033
- Table 14: Argentina APAC Plastic Caps & Closure Industry Revenue (billion) Forecast, by Application 2020 & 2033
- Table 15: Rest of South America APAC Plastic Caps & Closure Industry Revenue (billion) Forecast, by Application 2020 & 2033
- Table 16: Global APAC Plastic Caps & Closure Industry Revenue billion Forecast, by Material 2020 & 2033
- Table 17: Global APAC Plastic Caps & Closure Industry Revenue billion Forecast, by End-user Industry 2020 & 2033
- Table 18: Global APAC Plastic Caps & Closure Industry Revenue billion Forecast, by Country 2020 & 2033
- Table 19: United Kingdom APAC Plastic Caps & Closure Industry Revenue (billion) Forecast, by Application 2020 & 2033
- Table 20: Germany APAC Plastic Caps & Closure Industry Revenue (billion) Forecast, by Application 2020 & 2033
- Table 21: France APAC Plastic Caps & Closure Industry Revenue (billion) Forecast, by Application 2020 & 2033
- Table 22: Italy APAC Plastic Caps & Closure Industry Revenue (billion) Forecast, by Application 2020 & 2033
- Table 23: Spain APAC Plastic Caps & Closure Industry Revenue (billion) Forecast, by Application 2020 & 2033
- Table 24: Russia APAC Plastic Caps & Closure Industry Revenue (billion) Forecast, by Application 2020 & 2033
- Table 25: Benelux APAC Plastic Caps & Closure Industry Revenue (billion) Forecast, by Application 2020 & 2033
- Table 26: Nordics APAC Plastic Caps & Closure Industry Revenue (billion) Forecast, by Application 2020 & 2033
- Table 27: Rest of Europe APAC Plastic Caps & Closure Industry Revenue (billion) Forecast, by Application 2020 & 2033
- Table 28: Global APAC Plastic Caps & Closure Industry Revenue billion Forecast, by Material 2020 & 2033
- Table 29: Global APAC Plastic Caps & Closure Industry Revenue billion Forecast, by End-user Industry 2020 & 2033
- Table 30: Global APAC Plastic Caps & Closure Industry Revenue billion Forecast, by Country 2020 & 2033
- Table 31: Turkey APAC Plastic Caps & Closure Industry Revenue (billion) Forecast, by Application 2020 & 2033
- Table 32: Israel APAC Plastic Caps & Closure Industry Revenue (billion) Forecast, by Application 2020 & 2033
- Table 33: GCC APAC Plastic Caps & Closure Industry Revenue (billion) Forecast, by Application 2020 & 2033
- Table 34: North Africa APAC Plastic Caps & Closure Industry Revenue (billion) Forecast, by Application 2020 & 2033
- Table 35: South Africa APAC Plastic Caps & Closure Industry Revenue (billion) Forecast, by Application 2020 & 2033
- Table 36: Rest of Middle East & Africa APAC Plastic Caps & Closure Industry Revenue (billion) Forecast, by Application 2020 & 2033
- Table 37: Global APAC Plastic Caps & Closure Industry Revenue billion Forecast, by Material 2020 & 2033
- Table 38: Global APAC Plastic Caps & Closure Industry Revenue billion Forecast, by End-user Industry 2020 & 2033
- Table 39: Global APAC Plastic Caps & Closure Industry Revenue billion Forecast, by Country 2020 & 2033
- Table 40: China APAC Plastic Caps & Closure Industry Revenue (billion) Forecast, by Application 2020 & 2033
- Table 41: India APAC Plastic Caps & Closure Industry Revenue (billion) Forecast, by Application 2020 & 2033
- Table 42: Japan APAC Plastic Caps & Closure Industry Revenue (billion) Forecast, by Application 2020 & 2033
- Table 43: South Korea APAC Plastic Caps & Closure Industry Revenue (billion) Forecast, by Application 2020 & 2033
- Table 44: ASEAN APAC Plastic Caps & Closure Industry Revenue (billion) Forecast, by Application 2020 & 2033
- Table 45: Oceania APAC Plastic Caps & Closure Industry Revenue (billion) Forecast, by Application 2020 & 2033
- Table 46: Rest of Asia Pacific APAC Plastic Caps & Closure Industry Revenue (billion) Forecast, by Application 2020 & 2033
Frequently Asked Questions
1. What is the projected Compound Annual Growth Rate (CAGR) of the APAC Plastic Caps & Closure Industry?
The projected CAGR is approximately 5.52%.
2. Which companies are prominent players in the APAC Plastic Caps & Closure Industry?
Key companies in the market include Comar LLC, Pelliconi & C Spa*List Not Exhaustive, Guala Closures Group, SKS Bottle & Packaging Inc, Crown Holdings Inc, AptarGroup Inc, Albea Group, Coral Products PLC, Evergreen Packaging Inc, Nippon closures Co Ltd, BERICAP GmbH & Co KG, Tetra Pak International SA, Berry Global Inc, O Berk Company LLC, Silgan Holdings Inc, Closure Systems International, MJS Packaging, Amcor Ltd.
3. What are the main segments of the APAC Plastic Caps & Closure Industry?
The market segments include Material, End-user Industry.
4. Can you provide details about the market size?
The market size is estimated to be USD 85.2 billion as of 2022.
5. What are some drivers contributing to market growth?
Growing Consumption of Single Serve Beverages; Advent of Innovative Products.
6. What are the notable trends driving market growth?
PET is Expected to Witness Significant Growth.
7. Are there any restraints impacting market growth?
Regulations on Usage of Pet Bottles/Caps in Pharmaceutical Drugs and Food Packaging.
8. Can you provide examples of recent developments in the market?
June 2020 - Silgan Holdings Inc., a leading supplier of sustainable rigid packaging solutions for consumer goods products, acquired the dispensing business of the Albea Group for $900 million.
9. What pricing options are available for accessing the report?
Pricing options include single-user, multi-user, and enterprise licenses priced at USD 4750, USD 4950, and USD 6800 respectively.
10. Is the market size provided in terms of value or volume?
The market size is provided in terms of value, measured in billion.
11. Are there any specific market keywords associated with the report?
Yes, the market keyword associated with the report is "APAC Plastic Caps & Closure Industry," which aids in identifying and referencing the specific market segment covered.
12. How do I determine which pricing option suits my needs best?
The pricing options vary based on user requirements and access needs. Individual users may opt for single-user licenses, while businesses requiring broader access may choose multi-user or enterprise licenses for cost-effective access to the report.
13. Are there any additional resources or data provided in the APAC Plastic Caps & Closure Industry report?
While the report offers comprehensive insights, it's advisable to review the specific contents or supplementary materials provided to ascertain if additional resources or data are available.
14. How can I stay updated on further developments or reports in the APAC Plastic Caps & Closure Industry?
To stay informed about further developments, trends, and reports in the APAC Plastic Caps & Closure Industry, consider subscribing to industry newsletters, following relevant companies and organizations, or regularly checking reputable industry news sources and publications.
Methodology
Step 1 - Identification of Relevant Samples Size from Population Database


Step 2 - Approaches for Defining Global Market Size (Value, Volume* & Price*)

Note*: In applicable scenarios
Step 3 - Data Sources
Primary Research
- Web Analytics
- Survey Reports
- Research Institute
- Latest Research Reports
- Opinion Leaders
Secondary Research
- Annual Reports
- White Paper
- Latest Press Release
- Industry Association
- Paid Database
- Investor Presentations

Step 4 - Data Triangulation
Involves using different sources of information in order to increase the validity of a study
These sources are likely to be stakeholders in a program - participants, other researchers, program staff, other community members, and so on.
Then we put all data in single framework & apply various statistical tools to find out the dynamic on the market.
During the analysis stage, feedback from the stakeholder groups would be compared to determine areas of agreement as well as areas of divergence