

Key Insights
The global beer can market is projected for robust expansion, with an estimated CAGR of 5.3%. This growth is propelled by the surging popularity of craft beers and ready-to-drink (RTD) beverages, alongside the inherent advantages of aluminum cans, including their lightweight, recyclable, and quality-preserving properties. Consumer demand for convenient and portable packaging further fuels market dynamics. The aluminum segment currently leads, but the steel/tin segment is expected to see modest growth driven by cost-efficiency. Leading industry players are prioritizing sustainable packaging innovations, such as increased recycled aluminum content, to address environmental concerns. Asia-Pacific is anticipated to be a key growth driver due to rising disposable incomes and evolving consumption habits, while North America and Europe will experience steady expansion fueled by premiumization and product innovation. Potential market restraints include fluctuations in raw material prices and increasing regulatory oversight on packaging waste.
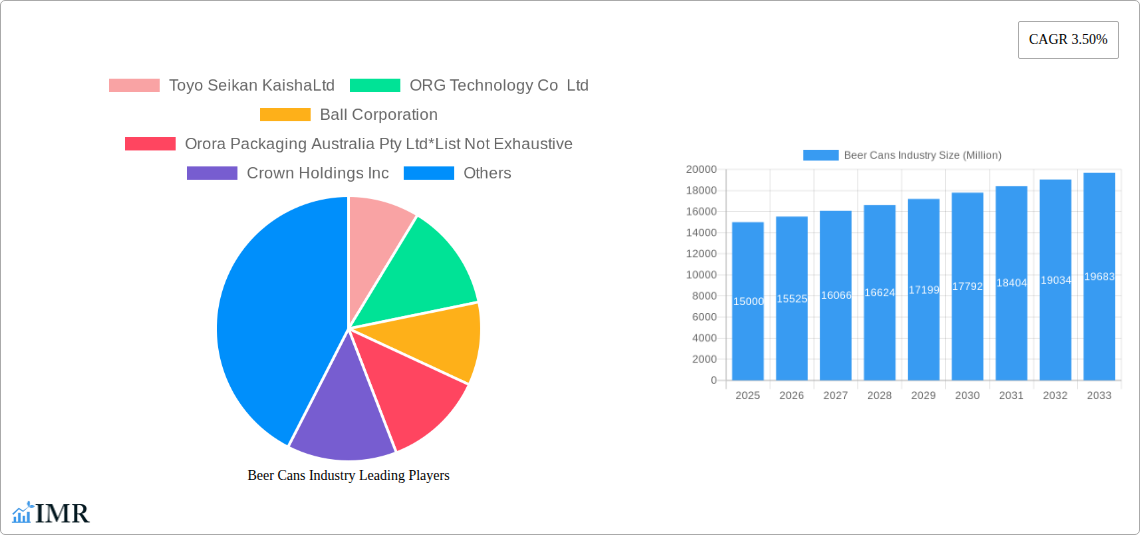
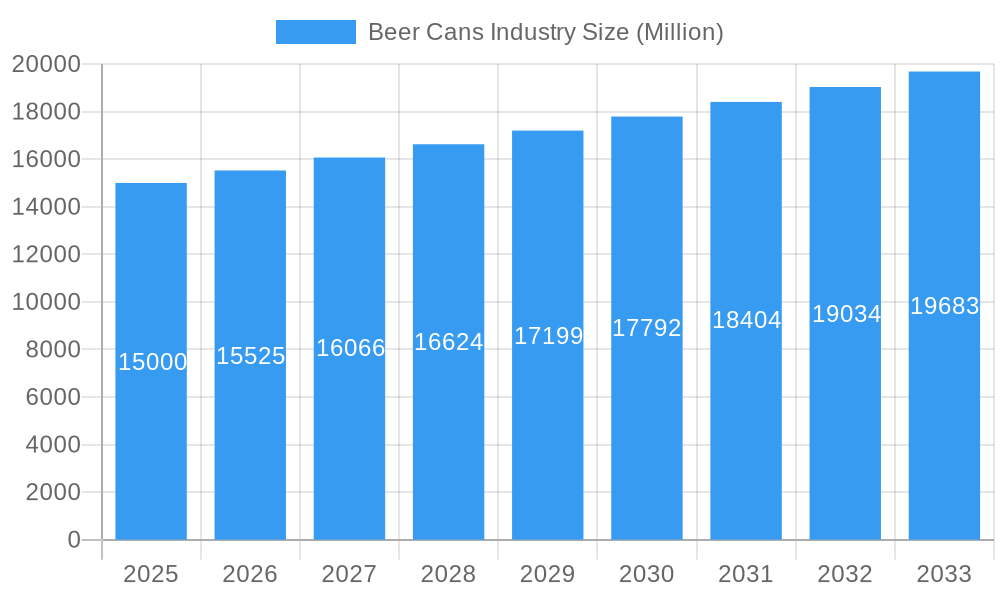
Beer Cans Industry Market Size (In Billion)
The long-term outlook for the beer can market remains highly positive, supported by sustained global beer consumption and the intrinsic benefits of canned packaging. Market segmentation by product type (aluminum, steel/tin) and geographic region offers a detailed view of market trends, enabling strategic business planning. The competitive environment features both established global corporations and regional manufacturers, fostering continuous innovation in pricing, product differentiation, and sustainable solutions. Future growth will be shaped by technological advancements in can production, evolving consumer preferences, and dynamic environmental regulations. The estimated market size for 2025 is 65.9 billion, based on a 2025 base year projection and informed by historical CAGR data.
Beer Cans Industry Company Market Share
Beer Cans Industry Market Report: 2019-2033
This comprehensive report provides an in-depth analysis of the global beer cans industry, encompassing market dynamics, growth trends, competitive landscape, and future outlook. The study covers the period 2019-2033, with 2025 as the base year and forecast period extending to 2033. The report segments the market by product type (Aluminum Can, Steel/Tin Can) and analyzes key players such as Toyo Seikan Kaisha Ltd, ORG Technology Co Ltd, Ball Corporation, Orora Packaging Australia Pty Ltd, Crown Holdings Inc, Shenzhen Xin Yuheng Can Co Ltd, Kaufman Container, Daiwa Can Co, and Can-Pack S.A. This report is invaluable for industry professionals, investors, and strategic decision-makers seeking a clear understanding of this dynamic market.
Beer Cans Industry Market Dynamics & Structure
The beer cans market is characterized by moderate concentration, with a few major players holding significant market share. Technological innovation, primarily focused on lightweighting and sustainability, is a key driver. Stringent regulatory frameworks regarding material recyclability and environmental impact influence manufacturing practices and product design. Aluminum cans hold a dominant market share due to their lightweight nature, recyclability, and superior barrier properties compared to steel/tin cans. The market is witnessing increased M&A activity, with companies consolidating to enhance their market position and gain access to new technologies.
- Market Concentration: Moderately concentrated, with top 5 players holding approximately xx% market share (2024).
- Technological Innovation: Focus on lightweighting, improved recyclability, and sustainable material sourcing.
- Regulatory Framework: Increasingly stringent environmental regulations driving adoption of sustainable practices.
- Competitive Substitutes: Glass bottles, plastic bottles, and pouches pose competitive threats.
- End-User Demographics: Primarily driven by the beer and beverage industry, with growth influenced by evolving consumer preferences.
- M&A Trends: xx M&A deals recorded between 2019-2024, with a projected xx increase by 2033, primarily driven by consolidation and expansion strategies.
Beer Cans Industry Growth Trends & Insights
The global beer cans market experienced significant growth during the historical period (2019-2024), driven by factors such as increasing beer consumption, growing demand for convenient packaging, and advancements in can manufacturing technology. The market size reached xx Million units in 2024 and is projected to expand at a Compound Annual Growth Rate (CAGR) of xx% during the forecast period (2025-2033), reaching xx Million units by 2033. Technological disruptions, such as the adoption of lightweighting techniques and improved recycling technologies, are further driving market expansion. Shifting consumer preferences towards sustainable and eco-friendly packaging solutions are also positively impacting market growth. The market penetration of aluminum cans is expected to increase, driven by their sustainability benefits. The adoption of advanced can printing technologies is enhancing product differentiation and creating new market opportunities.
Dominant Regions, Countries, or Segments in Beer Cans Industry
North America and Europe currently dominate the beer cans market, driven by high beer consumption and a well-established infrastructure for can manufacturing and recycling. However, Asia-Pacific is projected to exhibit significant growth during the forecast period, driven by rising disposable incomes and expanding beer consumption in emerging economies like China and India. Aluminum cans constitute the largest segment by product type, owing to their recyclability and lightweight nature.
- Key Drivers (North America & Europe): Established infrastructure, high beer consumption, stringent recycling regulations, and strong consumer demand for convenience.
- Key Drivers (Asia-Pacific): Rapid economic growth, rising disposable incomes, increasing beer consumption, and expanding manufacturing capabilities.
- Aluminum Can Dominance: Superior recyclability, lightweight design, and strong barrier properties contribute to its larger market share (xx% in 2024). Market share is projected to remain above xx% throughout the forecast period.
- Steel/Tin Can: Remains a smaller segment, primarily utilized for specialty or niche beer products. Market share is expected to remain at approximately xx% throughout the forecast period.
Beer Cans Industry Product Landscape
The beer can market offers a range of products with varying sizes, shapes, and designs, catering to diverse consumer preferences. Innovations focus on lightweighting to reduce material usage and environmental impact, enhanced printing techniques to improve branding and aesthetics, and the development of innovative can coatings for extended shelf life and improved protection of the beverage. Unique selling propositions include superior recyclability, convenient portability, and tamper-evident features. Technological advancements include the application of advanced printing technologies, such as high-definition printing and embossing, to create visually appealing and engaging designs.
Key Drivers, Barriers & Challenges in Beer Cans Industry
Key Drivers:
- Growing demand for convenient and portable packaging.
- Increasing beer consumption globally.
- Technological advancements in can manufacturing and design.
- Growing focus on sustainable packaging solutions.
Key Challenges:
- Fluctuations in raw material prices (aluminum and steel).
- Stringent environmental regulations and sustainability concerns.
- Intense competition from alternative packaging solutions (e.g., glass bottles, plastic bottles).
- Supply chain disruptions impacting raw material availability and timely delivery. This led to a xx% increase in production costs in 2022.
Emerging Opportunities in Beer Cans Industry
- Expansion into emerging markets with high growth potential.
- Development of eco-friendly and sustainable can coatings and materials.
- Innovation in can design and functionality, such as integrated opening mechanisms.
- Customization and personalization options for improved branding.
- Development of new can sizes and formats to cater to evolving consumer preferences.
Growth Accelerators in the Beer Cans Industry Industry
Technological advancements, such as the development of lightweight, high-strength cans and improved recycling technologies, are key growth catalysts. Strategic partnerships between can manufacturers and beer companies are facilitating innovation and market penetration. Expansion into new markets and growing demand for sustainable packaging solutions will further propel industry growth.
Key Players Shaping the Beer Cans Industry Market
- Toyo Seikan Kaisha Ltd
- ORG Technology Co Ltd
- Ball Corporation
- Orora Packaging Australia Pty Ltd
- Crown Holdings Inc
- Shenzhen Xin Yuheng Can Co Ltd
- Kaufman Container
- Daiwa Can Co
- Can-Pack S.A
Notable Milestones in Beer Cans Industry Sector
- September 2022: Crown Holdings, Inc. announced a 4% global average reduction in standard 12 oz. can weight, improving recyclability and reducing GHG emissions.
- October 2022: Ball Corporation expanded its infinitely recyclable aluminum cup portfolio with two new smaller sizes (9-ounce and 12-ounce), with 90% recycled content.
In-Depth Beer Cans Industry Market Outlook
The beer cans market is poised for sustained growth, driven by continuous innovation in can design and manufacturing, increased focus on sustainability, and expansion into new markets. Strategic partnerships and investments in R&D will further drive market expansion. The increasing adoption of lightweighting techniques and improved recycling processes will contribute to a more environmentally sustainable industry. The market is expected to witness increased consolidation as companies seek to enhance their market position and expand their product offerings.
Beer Cans Industry Segmentation
-
1. Product Type
- 1.1. Aluminum Can
- 1.2. Steel/Tin Can
Beer Cans Industry Segmentation By Geography
-
1. North America
- 1.1. United States
- 1.2. Canada
-
2. Europe
- 2.1. Germany
- 2.2. France
- 2.3. United Kingdom
- 2.4. Spain
- 2.5. Rest of Europe
-
3. Asia Pacific
- 3.1. China
- 3.2. Japan
- 3.3. India
- 3.4. Australia
- 3.5. Rest of Asia Pacific
-
4. Latin America
- 4.1. Brazil
- 4.2. Rest of Latin America
- 5. Middle East
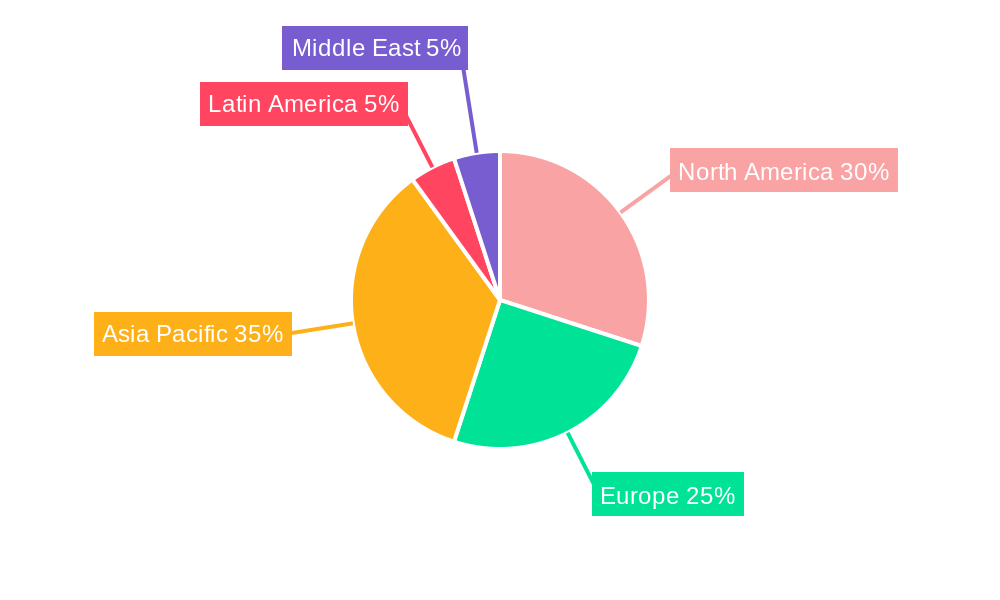
Beer Cans Industry Regional Market Share
Geographic Coverage of Beer Cans Industry
Beer Cans Industry REPORT HIGHLIGHTS
| Aspects | Details |
|---|---|
| Study Period | 2020-2034 |
| Base Year | 2025 |
| Estimated Year | 2026 |
| Forecast Period | 2026-2034 |
| Historical Period | 2020-2025 |
| Growth Rate | CAGR of 5.3% from 2020-2034 |
| Segmentation |
|
Table of Contents
- 1. Introduction
- 1.1. Research Scope
- 1.2. Market Segmentation
- 1.3. Research Objective
- 1.4. Definitions and Assumptions
- 2. Executive Summary
- 2.1. Market Snapshot
- 3. Market Dynamics
- 3.1. Market Drivers
- 3.2. Market Restrains
- 3.3. Market Trends
- 3.4. Market Opportunities
- 4. Market Factor Analysis
- 4.1. Porters Five Forces
- 4.1.1. Bargaining Power of Suppliers
- 4.1.2. Bargaining Power of Buyers
- 4.1.3. Threat of New Entrants
- 4.1.4. Threat of Substitutes
- 4.1.5. Competitive Rivalry
- 4.2. PESTEL analysis
- 4.3. BCG Analysis
- 4.3.1. Stars (High Growth, High Market Share)
- 4.3.2. Cash Cows (Low Growth, High Market Share)
- 4.3.3. Question Mark (High Growth, Low Market Share)
- 4.3.4. Dogs (Low Growth, Low Market Share)
- 4.4. Ansoff Matrix Analysis
- 4.5. Supply Chain Analysis
- 4.6. Regulatory Landscape
- 4.7. Current Market Potential and Opportunity Assessment (TAM–SAM–SOM Framework)
- 4.8. IMR Analyst Note
- 4.1. Porters Five Forces
- 5. Market Analysis, Insights and Forecast 2021-2033
- 5.1. Market Analysis, Insights and Forecast - by Product Type
- 5.1.1. Aluminum Can
- 5.1.2. Steel/Tin Can
- 5.2. Market Analysis, Insights and Forecast - by Region
- 5.2.1. North America
- 5.2.2. Europe
- 5.2.3. Asia Pacific
- 5.2.4. Latin America
- 5.2.5. Middle East
- 5.1. Market Analysis, Insights and Forecast - by Product Type
- 6. Global Beer Cans Industry Analysis, Insights and Forecast, 2021-2033
- 6.1. Market Analysis, Insights and Forecast - by Product Type
- 6.1.1. Aluminum Can
- 6.1.2. Steel/Tin Can
- 6.1. Market Analysis, Insights and Forecast - by Product Type
- 7. North America Beer Cans Industry Analysis, Insights and Forecast, 2020-2032
- 7.1. Market Analysis, Insights and Forecast - by Product Type
- 7.1.1. Aluminum Can
- 7.1.2. Steel/Tin Can
- 7.1. Market Analysis, Insights and Forecast - by Product Type
- 8. Europe Beer Cans Industry Analysis, Insights and Forecast, 2020-2032
- 8.1. Market Analysis, Insights and Forecast - by Product Type
- 8.1.1. Aluminum Can
- 8.1.2. Steel/Tin Can
- 8.1. Market Analysis, Insights and Forecast - by Product Type
- 9. Asia Pacific Beer Cans Industry Analysis, Insights and Forecast, 2020-2032
- 9.1. Market Analysis, Insights and Forecast - by Product Type
- 9.1.1. Aluminum Can
- 9.1.2. Steel/Tin Can
- 9.1. Market Analysis, Insights and Forecast - by Product Type
- 10. Latin America Beer Cans Industry Analysis, Insights and Forecast, 2020-2032
- 10.1. Market Analysis, Insights and Forecast - by Product Type
- 10.1.1. Aluminum Can
- 10.1.2. Steel/Tin Can
- 10.1. Market Analysis, Insights and Forecast - by Product Type
- 11. Middle East Beer Cans Industry Analysis, Insights and Forecast, 2020-2032
- 11.1. Market Analysis, Insights and Forecast - by Product Type
- 11.1.1. Aluminum Can
- 11.1.2. Steel/Tin Can
- 11.1. Market Analysis, Insights and Forecast - by Product Type
- 12. Competitive Analysis
- 12.1. Company Profiles
- 12.1.1 Toyo Seikan KaishaLtd
- 12.1.1.1. Company Overview
- 12.1.1.2. Products
- 12.1.1.3. Company Financials
- 12.1.1.4. SWOT Analysis
- 12.1.2 ORG Technology Co Ltd
- 12.1.2.1. Company Overview
- 12.1.2.2. Products
- 12.1.2.3. Company Financials
- 12.1.2.4. SWOT Analysis
- 12.1.3 Ball Corporation
- 12.1.3.1. Company Overview
- 12.1.3.2. Products
- 12.1.3.3. Company Financials
- 12.1.3.4. SWOT Analysis
- 12.1.4 Orora Packaging Australia Pty Ltd*List Not Exhaustive
- 12.1.4.1. Company Overview
- 12.1.4.2. Products
- 12.1.4.3. Company Financials
- 12.1.4.4. SWOT Analysis
- 12.1.5 Crown Holdings Inc
- 12.1.5.1. Company Overview
- 12.1.5.2. Products
- 12.1.5.3. Company Financials
- 12.1.5.4. SWOT Analysis
- 12.1.6 Shenzhen Xin Yuheng Can Co Ltd
- 12.1.6.1. Company Overview
- 12.1.6.2. Products
- 12.1.6.3. Company Financials
- 12.1.6.4. SWOT Analysis
- 12.1.7 Kaufman Container
- 12.1.7.1. Company Overview
- 12.1.7.2. Products
- 12.1.7.3. Company Financials
- 12.1.7.4. SWOT Analysis
- 12.1.8 Daiwa Can Co
- 12.1.8.1. Company Overview
- 12.1.8.2. Products
- 12.1.8.3. Company Financials
- 12.1.8.4. SWOT Analysis
- 12.1.9 Can-Pack S A
- 12.1.9.1. Company Overview
- 12.1.9.2. Products
- 12.1.9.3. Company Financials
- 12.1.9.4. SWOT Analysis
- 12.1.1 Toyo Seikan KaishaLtd
- 12.2. Market Entropy
- 12.2.1 Company's Key Areas Served
- 12.2.2 Recent Developments
- 12.3. Company Market Share Analysis 2025
- 12.3.1 Top 5 Companies Market Share Analysis
- 12.3.2 Top 3 Companies Market Share Analysis
- 12.4. List of Potential Customers
- 13. Research Methodology
List of Figures
- Figure 1: Global Beer Cans Industry Revenue Breakdown (billion, %) by Region 2025 & 2033
- Figure 2: North America Beer Cans Industry Revenue (billion), by Product Type 2025 & 2033
- Figure 3: North America Beer Cans Industry Revenue Share (%), by Product Type 2025 & 2033
- Figure 4: North America Beer Cans Industry Revenue (billion), by Country 2025 & 2033
- Figure 5: North America Beer Cans Industry Revenue Share (%), by Country 2025 & 2033
- Figure 6: Europe Beer Cans Industry Revenue (billion), by Product Type 2025 & 2033
- Figure 7: Europe Beer Cans Industry Revenue Share (%), by Product Type 2025 & 2033
- Figure 8: Europe Beer Cans Industry Revenue (billion), by Country 2025 & 2033
- Figure 9: Europe Beer Cans Industry Revenue Share (%), by Country 2025 & 2033
- Figure 10: Asia Pacific Beer Cans Industry Revenue (billion), by Product Type 2025 & 2033
- Figure 11: Asia Pacific Beer Cans Industry Revenue Share (%), by Product Type 2025 & 2033
- Figure 12: Asia Pacific Beer Cans Industry Revenue (billion), by Country 2025 & 2033
- Figure 13: Asia Pacific Beer Cans Industry Revenue Share (%), by Country 2025 & 2033
- Figure 14: Latin America Beer Cans Industry Revenue (billion), by Product Type 2025 & 2033
- Figure 15: Latin America Beer Cans Industry Revenue Share (%), by Product Type 2025 & 2033
- Figure 16: Latin America Beer Cans Industry Revenue (billion), by Country 2025 & 2033
- Figure 17: Latin America Beer Cans Industry Revenue Share (%), by Country 2025 & 2033
- Figure 18: Middle East Beer Cans Industry Revenue (billion), by Product Type 2025 & 2033
- Figure 19: Middle East Beer Cans Industry Revenue Share (%), by Product Type 2025 & 2033
- Figure 20: Middle East Beer Cans Industry Revenue (billion), by Country 2025 & 2033
- Figure 21: Middle East Beer Cans Industry Revenue Share (%), by Country 2025 & 2033
List of Tables
- Table 1: Global Beer Cans Industry Revenue billion Forecast, by Product Type 2020 & 2033
- Table 2: Global Beer Cans Industry Revenue billion Forecast, by Region 2020 & 2033
- Table 3: Global Beer Cans Industry Revenue billion Forecast, by Product Type 2020 & 2033
- Table 4: Global Beer Cans Industry Revenue billion Forecast, by Country 2020 & 2033
- Table 5: United States Beer Cans Industry Revenue (billion) Forecast, by Application 2020 & 2033
- Table 6: Canada Beer Cans Industry Revenue (billion) Forecast, by Application 2020 & 2033
- Table 7: Global Beer Cans Industry Revenue billion Forecast, by Product Type 2020 & 2033
- Table 8: Global Beer Cans Industry Revenue billion Forecast, by Country 2020 & 2033
- Table 9: Germany Beer Cans Industry Revenue (billion) Forecast, by Application 2020 & 2033
- Table 10: France Beer Cans Industry Revenue (billion) Forecast, by Application 2020 & 2033
- Table 11: United Kingdom Beer Cans Industry Revenue (billion) Forecast, by Application 2020 & 2033
- Table 12: Spain Beer Cans Industry Revenue (billion) Forecast, by Application 2020 & 2033
- Table 13: Rest of Europe Beer Cans Industry Revenue (billion) Forecast, by Application 2020 & 2033
- Table 14: Global Beer Cans Industry Revenue billion Forecast, by Product Type 2020 & 2033
- Table 15: Global Beer Cans Industry Revenue billion Forecast, by Country 2020 & 2033
- Table 16: China Beer Cans Industry Revenue (billion) Forecast, by Application 2020 & 2033
- Table 17: Japan Beer Cans Industry Revenue (billion) Forecast, by Application 2020 & 2033
- Table 18: India Beer Cans Industry Revenue (billion) Forecast, by Application 2020 & 2033
- Table 19: Australia Beer Cans Industry Revenue (billion) Forecast, by Application 2020 & 2033
- Table 20: Rest of Asia Pacific Beer Cans Industry Revenue (billion) Forecast, by Application 2020 & 2033
- Table 21: Global Beer Cans Industry Revenue billion Forecast, by Product Type 2020 & 2033
- Table 22: Global Beer Cans Industry Revenue billion Forecast, by Country 2020 & 2033
- Table 23: Brazil Beer Cans Industry Revenue (billion) Forecast, by Application 2020 & 2033
- Table 24: Rest of Latin America Beer Cans Industry Revenue (billion) Forecast, by Application 2020 & 2033
- Table 25: Global Beer Cans Industry Revenue billion Forecast, by Product Type 2020 & 2033
- Table 26: Global Beer Cans Industry Revenue billion Forecast, by Country 2020 & 2033
Frequently Asked Questions
1. What is the projected Compound Annual Growth Rate (CAGR) of the Beer Cans Industry?
The projected CAGR is approximately 5.3%.
2. Which companies are prominent players in the Beer Cans Industry?
Key companies in the market include Toyo Seikan KaishaLtd, ORG Technology Co Ltd, Ball Corporation, Orora Packaging Australia Pty Ltd*List Not Exhaustive, Crown Holdings Inc, Shenzhen Xin Yuheng Can Co Ltd, Kaufman Container, Daiwa Can Co, Can-Pack S A.
3. What are the main segments of the Beer Cans Industry?
The market segments include Product Type.
4. Can you provide details about the market size?
The market size is estimated to be USD 65.9 billion as of 2022.
5. What are some drivers contributing to market growth?
Growing Consumption of Craft Beer Across Various Regions; Recreational and Environmental Benefits.
6. What are the notable trends driving market growth?
Aluminium is Expected to Hold the Largest Market Share.
7. Are there any restraints impacting market growth?
Changing Consumer Preferences.
8. Can you provide examples of recent developments in the market?
October 2022 - Ball Corporation announced the portfolio expansion of its infinitely recyclable ball aluminum cup with the launch of two new, smaller sizes (9-ounce and 12-ounce cup sizes). The Ball Aluminum Cup available for food service customers is now composed of 90% recycled content, making it the cup with the highest recycled content rate of any beverage packaging in its category.
9. What pricing options are available for accessing the report?
Pricing options include single-user, multi-user, and enterprise licenses priced at USD 4750, USD 5250, and USD 8750 respectively.
10. Is the market size provided in terms of value or volume?
The market size is provided in terms of value, measured in billion.
11. Are there any specific market keywords associated with the report?
Yes, the market keyword associated with the report is "Beer Cans Industry," which aids in identifying and referencing the specific market segment covered.
12. How do I determine which pricing option suits my needs best?
The pricing options vary based on user requirements and access needs. Individual users may opt for single-user licenses, while businesses requiring broader access may choose multi-user or enterprise licenses for cost-effective access to the report.
13. Are there any additional resources or data provided in the Beer Cans Industry report?
While the report offers comprehensive insights, it's advisable to review the specific contents or supplementary materials provided to ascertain if additional resources or data are available.
14. How can I stay updated on further developments or reports in the Beer Cans Industry?
To stay informed about further developments, trends, and reports in the Beer Cans Industry, consider subscribing to industry newsletters, following relevant companies and organizations, or regularly checking reputable industry news sources and publications.
Methodology
Step 1 - Identification of Relevant Samples Size from Population Database


Step 2 - Approaches for Defining Global Market Size (Value, Volume* & Price*)

Note*: In applicable scenarios
Step 3 - Data Sources
Primary Research
- Web Analytics
- Survey Reports
- Research Institute
- Latest Research Reports
- Opinion Leaders
Secondary Research
- Annual Reports
- White Paper
- Latest Press Release
- Industry Association
- Paid Database
- Investor Presentations

Step 4 - Data Triangulation
Involves using different sources of information in order to increase the validity of a study
These sources are likely to be stakeholders in a program - participants, other researchers, program staff, other community members, and so on.
Then we put all data in single framework & apply various statistical tools to find out the dynamic on the market.
During the analysis stage, feedback from the stakeholder groups would be compared to determine areas of agreement as well as areas of divergence