

Key Insights
The biodegradable trash bag market is experiencing robust growth, driven by increasing environmental awareness and stringent government regulations aimed at reducing plastic waste. The market, currently valued at approximately $2.5 billion in 2025, is projected to expand at a Compound Annual Growth Rate (CAGR) of 8% between 2025 and 2033, reaching an estimated value of $4.8 billion by 2033. This growth is fueled by several key factors, including the rising consumer preference for eco-friendly alternatives to conventional plastic bags, the increasing availability of biodegradable materials like cornstarch and plant-based polymers, and advancements in manufacturing technologies leading to improved product performance and affordability. Furthermore, the growing adoption of composting programs and the rise of sustainable living practices are significantly contributing to the market's expansion. Leading companies like Hefty, Glad, and Berry Global are actively investing in research and development to enhance product quality and expand their market reach, further fueling competition and innovation.
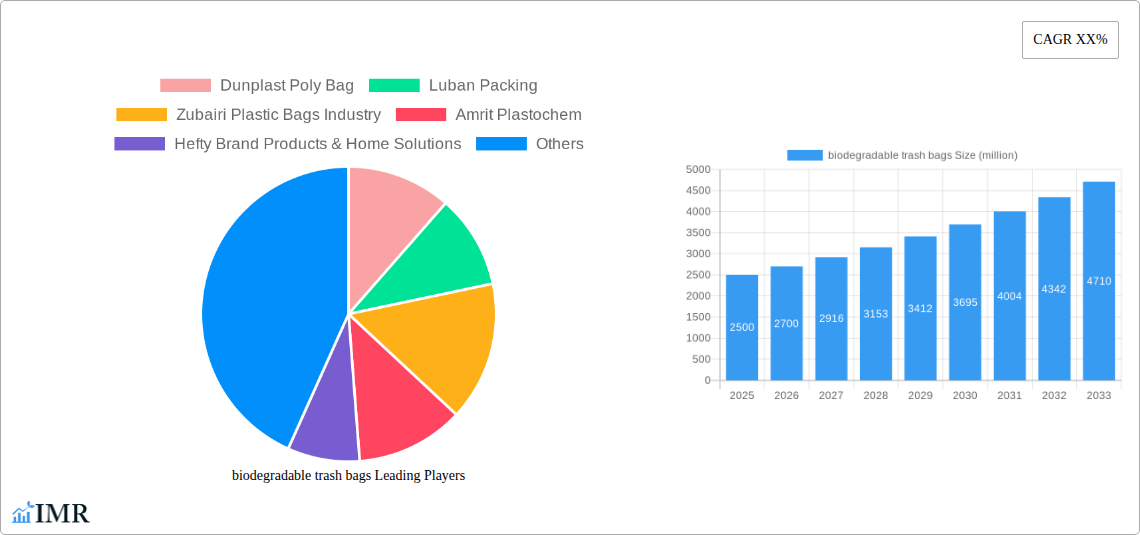
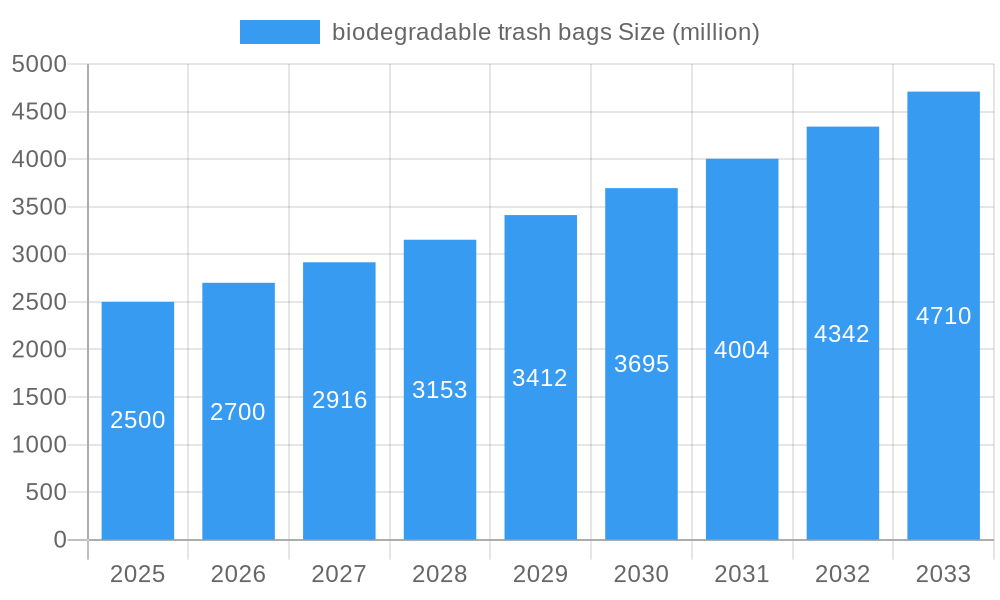
biodegradable trash bags Market Size (In Billion)
However, challenges remain. The higher cost of biodegradable bags compared to conventional plastic bags is a significant restraint, hindering widespread adoption, especially in price-sensitive markets. Furthermore, inconsistencies in the composting infrastructure across different regions create limitations in the effective disposal and degradation of these bags. Despite these hurdles, the long-term outlook for the biodegradable trash bag market remains positive, with ongoing technological advancements, rising environmental consciousness, and supportive government policies expected to drive sustained growth in the coming years. Segmentation analysis reveals strong growth in the industrial segment, driven by large-scale waste management companies adopting sustainable practices. Regional analysis suggests that North America and Europe are currently leading the market, but growth in Asia Pacific is expected to accelerate significantly due to rising environmental concerns and increasing disposable incomes in developing economies.
biodegradable trash bags Company Market Share
Biodegradable Trash Bags Market Report: 2019-2033
This comprehensive report provides a detailed analysis of the biodegradable trash bags market, offering invaluable insights for industry professionals, investors, and strategic decision-makers. Covering the period from 2019 to 2033, with a focus on 2025, this report dissects market dynamics, growth trends, regional dominance, product landscapes, and key players shaping this rapidly evolving sector. The report utilizes data measured in million units.
Keywords: Biodegradable trash bags, compostable trash bags, eco-friendly trash bags, sustainable packaging, waste management, green technology, market analysis, market trends, industry growth, Dunplast Poly Bag, Luban Packing, Zubairi Plastic Bags Industry, Amrit Plastochem, Hefty, Glad, Pack-It BV, Inteplast Group, Polykar Industries, Polyethics Industries, Mapco, Novolex, Berry Global, NOVPLASTA. Parent Market: Packaging Market; Child Market: Sustainable Packaging Market.
Biodegradable Trash Bags Market Dynamics & Structure
The biodegradable trash bags market is characterized by moderate concentration, with several key players holding significant market share, but a multitude of smaller regional players also contributing significantly. Technological innovation, driven by advancements in biopolymer production and film extrusion, is a crucial driver, alongside increasing regulatory pressure toward reducing plastic waste. Competition from conventional plastic bags remains a challenge, but the growing consumer preference for sustainable alternatives is counterbalancing this. The market shows a strong tendency towards consolidation, as evidenced by the xx M&A deals observed in the historical period (2019-2024), with a projected increase to xx million deals during the forecast period (2025-2033). End-user demographics indicate a high demand from environmentally conscious consumers, particularly in developed nations.
- Market Concentration: Moderately concentrated, with top 5 players holding approximately xx% market share in 2025.
- Technological Innovation: Focus on improved biodegradability, compostability, strength, and cost reduction.
- Regulatory Framework: Increasingly stringent regulations on plastic waste in various regions, driving adoption of biodegradable alternatives.
- Competitive Substitutes: Conventional plastic bags, reusable bags, and other waste disposal solutions.
- End-User Demographics: Growing adoption among environmentally conscious consumers and businesses.
- M&A Trends: xx M&A deals (2019-2024), projected xx million deals (2025-2033), driven by expansion and technology acquisition.
Biodegradable Trash Bags Growth Trends & Insights
The biodegradable trash bags market experienced significant growth between 2019 and 2024, with a Compound Annual Growth Rate (CAGR) of xx%. Market size in 2025 is estimated at xx million units. This growth is primarily driven by rising consumer awareness of environmental issues, coupled with supportive government policies and increasing availability of biodegradable materials. Technological advancements have resulted in more durable and cost-effective products, further enhancing market penetration. The shift towards sustainable consumption patterns fuels the adoption rate, currently estimated at xx% in 2025 and projected to reach xx% by 2033. The market shows signs of strong future growth due to the increasing demand for sustainable and eco-friendly packaging solutions from businesses and households. This trend will continue to grow, and a CAGR of xx% is predicted for the 2025-2033 forecast period. Technological disruption, such as advancements in bio-based polymers and improved compostability, continues to positively influence market growth.
Dominant Regions, Countries, or Segments in Biodegradable Trash Bags
North America currently holds the largest market share in biodegradable trash bags, followed by Europe. This dominance stems from several factors: strong environmental regulations, high consumer awareness, and robust infrastructure for waste management. Asia Pacific demonstrates significant growth potential, driven by rapid economic development, increasing urbanization, and rising disposable incomes. Specific countries like the US, Canada, Germany, and Japan are leading the market in terms of both consumption and innovation. Government initiatives and subsidies for sustainable products further stimulate market growth in these regions.
- Key Drivers in North America: Strict environmental regulations, high consumer awareness of sustainability, developed waste management infrastructure.
- Key Drivers in Europe: Stringent environmental policies, strong consumer demand for eco-friendly products, substantial government investments in green technologies.
- Growth Potential in Asia Pacific: Rapid economic growth, rising middle class, increasing urbanization, supportive government policies.
- Market Share: North America holds xx% in 2025, with Europe at xx% and Asia Pacific at xx%. Growth projections for Asia Pacific indicate xx% market share by 2033.
Biodegradable Trash Bags Product Landscape
The biodegradable trash bags market presents a diverse product landscape, encompassing various materials, sizes, and functionalities. Innovations center on enhancing biodegradability rates, improving strength and durability, and offering compostable options. This includes advancements in oxo-biodegradable, PLA, and PHA based bags, alongside the development of innovative bag designs for improved performance and reduced environmental impact. Unique selling propositions include certifications and labeling showcasing compostability and biodegradability, catering to the growing demand for transparency and authenticity in sustainable products. Furthermore, advancements are focusing on reducing production costs to make these products more economically competitive with conventional alternatives.
Key Drivers, Barriers & Challenges in Biodegradable Trash Bags
Key Drivers:
- Growing environmental consciousness among consumers and businesses.
- Stringent government regulations and policies promoting sustainable waste management.
- Technological advancements leading to more cost-effective and efficient production.
- Increased availability of readily compostable bio-based materials.
Challenges & Restraints:
- Higher production costs compared to conventional plastic bags, limiting widespread adoption.
- Limitations in the biodegradability and compostability of some products under varying conditions.
- Inconsistent infrastructure for the collection and processing of compostable waste.
- Concerns regarding the potential environmental impact of certain bio-based materials, depending on their production methods. The impact of these factors is estimated to reduce market growth by approximately xx% by 2033.
Emerging Opportunities in Biodegradable Trash Bags
Significant opportunities exist in expanding into untapped markets, particularly in developing economies experiencing rapid urbanization and increasing waste generation. The development of innovative applications, like biodegradable liners for food waste bins and specialized bags for medical waste, presents a substantial growth avenue. Furthermore, catering to evolving consumer preferences through product differentiation and customization, such as offering scented or high-capacity bags, can unlock new market segments.
Growth Accelerators in the Biodegradable Trash Bags Industry
Strategic partnerships between raw material suppliers, manufacturers, and waste management companies are accelerating market growth. Technological breakthroughs, particularly in biopolymer synthesis and advanced composting technologies, are reducing production costs and improving product performance. Government incentives and subsidies supporting the adoption of sustainable packaging solutions are also crucial growth catalysts. Market expansion into new geographic regions and diversification of product offerings further fuels the industry's expansion.
Key Players Shaping the Biodegradable Trash Bags Market
- Dunplast Poly Bag
- Luban Packing
- Zubairi Plastic Bags Industry
- Amrit Plastochem
- Hefty Brand Products & Home Solutions
- The Glad Products Company
- Pack-It BV
- Inteplast Group
- Polykar Industries
- Polyethics Industries
- Mapco (Pvt)
- Novolex
- Berry Global
- NOVPLASTA
Notable Milestones in Biodegradable Trash Bags Sector
- 2020: Increased governmental regulations in several European countries regarding plastic bag usage.
- 2021: Launch of several new compostable trash bag lines by major players, utilizing innovative bio-based polymers.
- 2022: Significant investments in research and development of improved bio-based materials.
- 2023: Several mergers and acquisitions within the industry, leading to market consolidation.
- 2024: Introduction of new product certifications and standards to ensure authentic biodegradability.
In-Depth Biodegradable Trash Bags Market Outlook
The biodegradable trash bags market is poised for robust growth throughout the forecast period (2025-2033), driven by increasing environmental awareness, stringent regulations, and technological advancements. The market presents significant opportunities for companies focused on innovation, sustainability, and strategic partnerships across the value chain. Focusing on enhancing biodegradability, expanding product offerings, and targeting untapped markets will be crucial for achieving long-term success in this dynamic sector. The increasing demand for sustainable solutions, coupled with continuous technological improvement, indicates a promising future for biodegradable trash bags.
biodegradable trash bags Segmentation
-
1. Application
- 1.1. E-commerce
- 1.2. Convenience Stores
- 1.3. Supermarkets/hypermarkets
- 1.4. Specialty Stores
-
2. Types
- 2.1. Low Density Polyethylene
- 2.2. Linear Low Density Polyethylene
- 2.3. Bio-Degradable Polyethylene
- 2.4. High Density Polyethylene
biodegradable trash bags Segmentation By Geography
-
1. North America
- 1.1. United States
- 1.2. Canada
- 1.3. Mexico
-
2. South America
- 2.1. Brazil
- 2.2. Argentina
- 2.3. Rest of South America
-
3. Europe
- 3.1. United Kingdom
- 3.2. Germany
- 3.3. France
- 3.4. Italy
- 3.5. Spain
- 3.6. Russia
- 3.7. Benelux
- 3.8. Nordics
- 3.9. Rest of Europe
-
4. Middle East & Africa
- 4.1. Turkey
- 4.2. Israel
- 4.3. GCC
- 4.4. North Africa
- 4.5. South Africa
- 4.6. Rest of Middle East & Africa
-
5. Asia Pacific
- 5.1. China
- 5.2. India
- 5.3. Japan
- 5.4. South Korea
- 5.5. ASEAN
- 5.6. Oceania
- 5.7. Rest of Asia Pacific

biodegradable trash bags Regional Market Share
Geographic Coverage of biodegradable trash bags
biodegradable trash bags REPORT HIGHLIGHTS
| Aspects | Details |
|---|---|
| Study Period | 2020-2034 |
| Base Year | 2025 |
| Estimated Year | 2026 |
| Forecast Period | 2026-2034 |
| Historical Period | 2020-2025 |
| Growth Rate | CAGR of 7.47% from 2020-2034 |
| Segmentation |
|
Table of Contents
- 1. Introduction
- 1.1. Research Scope
- 1.2. Market Segmentation
- 1.3. Research Methodology
- 1.4. Definitions and Assumptions
- 2. Executive Summary
- 2.1. Introduction
- 3. Market Dynamics
- 3.1. Introduction
- 3.2. Market Drivers
- 3.3. Market Restrains
- 3.4. Market Trends
- 4. Market Factor Analysis
- 4.1. Porters Five Forces
- 4.2. Supply/Value Chain
- 4.3. PESTEL analysis
- 4.4. Market Entropy
- 4.5. Patent/Trademark Analysis
- 5. Global biodegradable trash bags Analysis, Insights and Forecast, 2020-2032
- 5.1. Market Analysis, Insights and Forecast - by Application
- 5.1.1. E-commerce
- 5.1.2. Convenience Stores
- 5.1.3. Supermarkets/hypermarkets
- 5.1.4. Specialty Stores
- 5.2. Market Analysis, Insights and Forecast - by Types
- 5.2.1. Low Density Polyethylene
- 5.2.2. Linear Low Density Polyethylene
- 5.2.3. Bio-Degradable Polyethylene
- 5.2.4. High Density Polyethylene
- 5.3. Market Analysis, Insights and Forecast - by Region
- 5.3.1. North America
- 5.3.2. South America
- 5.3.3. Europe
- 5.3.4. Middle East & Africa
- 5.3.5. Asia Pacific
- 5.1. Market Analysis, Insights and Forecast - by Application
- 6. North America biodegradable trash bags Analysis, Insights and Forecast, 2020-2032
- 6.1. Market Analysis, Insights and Forecast - by Application
- 6.1.1. E-commerce
- 6.1.2. Convenience Stores
- 6.1.3. Supermarkets/hypermarkets
- 6.1.4. Specialty Stores
- 6.2. Market Analysis, Insights and Forecast - by Types
- 6.2.1. Low Density Polyethylene
- 6.2.2. Linear Low Density Polyethylene
- 6.2.3. Bio-Degradable Polyethylene
- 6.2.4. High Density Polyethylene
- 6.1. Market Analysis, Insights and Forecast - by Application
- 7. South America biodegradable trash bags Analysis, Insights and Forecast, 2020-2032
- 7.1. Market Analysis, Insights and Forecast - by Application
- 7.1.1. E-commerce
- 7.1.2. Convenience Stores
- 7.1.3. Supermarkets/hypermarkets
- 7.1.4. Specialty Stores
- 7.2. Market Analysis, Insights and Forecast - by Types
- 7.2.1. Low Density Polyethylene
- 7.2.2. Linear Low Density Polyethylene
- 7.2.3. Bio-Degradable Polyethylene
- 7.2.4. High Density Polyethylene
- 7.1. Market Analysis, Insights and Forecast - by Application
- 8. Europe biodegradable trash bags Analysis, Insights and Forecast, 2020-2032
- 8.1. Market Analysis, Insights and Forecast - by Application
- 8.1.1. E-commerce
- 8.1.2. Convenience Stores
- 8.1.3. Supermarkets/hypermarkets
- 8.1.4. Specialty Stores
- 8.2. Market Analysis, Insights and Forecast - by Types
- 8.2.1. Low Density Polyethylene
- 8.2.2. Linear Low Density Polyethylene
- 8.2.3. Bio-Degradable Polyethylene
- 8.2.4. High Density Polyethylene
- 8.1. Market Analysis, Insights and Forecast - by Application
- 9. Middle East & Africa biodegradable trash bags Analysis, Insights and Forecast, 2020-2032
- 9.1. Market Analysis, Insights and Forecast - by Application
- 9.1.1. E-commerce
- 9.1.2. Convenience Stores
- 9.1.3. Supermarkets/hypermarkets
- 9.1.4. Specialty Stores
- 9.2. Market Analysis, Insights and Forecast - by Types
- 9.2.1. Low Density Polyethylene
- 9.2.2. Linear Low Density Polyethylene
- 9.2.3. Bio-Degradable Polyethylene
- 9.2.4. High Density Polyethylene
- 9.1. Market Analysis, Insights and Forecast - by Application
- 10. Asia Pacific biodegradable trash bags Analysis, Insights and Forecast, 2020-2032
- 10.1. Market Analysis, Insights and Forecast - by Application
- 10.1.1. E-commerce
- 10.1.2. Convenience Stores
- 10.1.3. Supermarkets/hypermarkets
- 10.1.4. Specialty Stores
- 10.2. Market Analysis, Insights and Forecast - by Types
- 10.2.1. Low Density Polyethylene
- 10.2.2. Linear Low Density Polyethylene
- 10.2.3. Bio-Degradable Polyethylene
- 10.2.4. High Density Polyethylene
- 10.1. Market Analysis, Insights and Forecast - by Application
- 11. Competitive Analysis
- 11.1. Global Market Share Analysis 2025
- 11.2. Company Profiles
- 11.2.1 Dunplast Poly Bag
- 11.2.1.1. Overview
- 11.2.1.2. Products
- 11.2.1.3. SWOT Analysis
- 11.2.1.4. Recent Developments
- 11.2.1.5. Financials (Based on Availability)
- 11.2.2 Luban Packing
- 11.2.2.1. Overview
- 11.2.2.2. Products
- 11.2.2.3. SWOT Analysis
- 11.2.2.4. Recent Developments
- 11.2.2.5. Financials (Based on Availability)
- 11.2.3 Zubairi Plastic Bags Industry
- 11.2.3.1. Overview
- 11.2.3.2. Products
- 11.2.3.3. SWOT Analysis
- 11.2.3.4. Recent Developments
- 11.2.3.5. Financials (Based on Availability)
- 11.2.4 Amrit Plastochem
- 11.2.4.1. Overview
- 11.2.4.2. Products
- 11.2.4.3. SWOT Analysis
- 11.2.4.4. Recent Developments
- 11.2.4.5. Financials (Based on Availability)
- 11.2.5 Hefty Brand Products & Home Solutions
- 11.2.5.1. Overview
- 11.2.5.2. Products
- 11.2.5.3. SWOT Analysis
- 11.2.5.4. Recent Developments
- 11.2.5.5. Financials (Based on Availability)
- 11.2.6 The Glad Products Company
- 11.2.6.1. Overview
- 11.2.6.2. Products
- 11.2.6.3. SWOT Analysis
- 11.2.6.4. Recent Developments
- 11.2.6.5. Financials (Based on Availability)
- 11.2.7 Pack-It BV
- 11.2.7.1. Overview
- 11.2.7.2. Products
- 11.2.7.3. SWOT Analysis
- 11.2.7.4. Recent Developments
- 11.2.7.5. Financials (Based on Availability)
- 11.2.8 Inteplast Group
- 11.2.8.1. Overview
- 11.2.8.2. Products
- 11.2.8.3. SWOT Analysis
- 11.2.8.4. Recent Developments
- 11.2.8.5. Financials (Based on Availability)
- 11.2.9 Polykar Industries
- 11.2.9.1. Overview
- 11.2.9.2. Products
- 11.2.9.3. SWOT Analysis
- 11.2.9.4. Recent Developments
- 11.2.9.5. Financials (Based on Availability)
- 11.2.10 Polyethics Industries
- 11.2.10.1. Overview
- 11.2.10.2. Products
- 11.2.10.3. SWOT Analysis
- 11.2.10.4. Recent Developments
- 11.2.10.5. Financials (Based on Availability)
- 11.2.11 Mapco (Pvt)
- 11.2.11.1. Overview
- 11.2.11.2. Products
- 11.2.11.3. SWOT Analysis
- 11.2.11.4. Recent Developments
- 11.2.11.5. Financials (Based on Availability)
- 11.2.12 Novolex
- 11.2.12.1. Overview
- 11.2.12.2. Products
- 11.2.12.3. SWOT Analysis
- 11.2.12.4. Recent Developments
- 11.2.12.5. Financials (Based on Availability)
- 11.2.13 Berry Global
- 11.2.13.1. Overview
- 11.2.13.2. Products
- 11.2.13.3. SWOT Analysis
- 11.2.13.4. Recent Developments
- 11.2.13.5. Financials (Based on Availability)
- 11.2.14 NOVPLASTA
- 11.2.14.1. Overview
- 11.2.14.2. Products
- 11.2.14.3. SWOT Analysis
- 11.2.14.4. Recent Developments
- 11.2.14.5. Financials (Based on Availability)
- 11.2.1 Dunplast Poly Bag
List of Figures
- Figure 1: Global biodegradable trash bags Revenue Breakdown (undefined, %) by Region 2025 & 2033
- Figure 2: Global biodegradable trash bags Volume Breakdown (K, %) by Region 2025 & 2033
- Figure 3: North America biodegradable trash bags Revenue (undefined), by Application 2025 & 2033
- Figure 4: North America biodegradable trash bags Volume (K), by Application 2025 & 2033
- Figure 5: North America biodegradable trash bags Revenue Share (%), by Application 2025 & 2033
- Figure 6: North America biodegradable trash bags Volume Share (%), by Application 2025 & 2033
- Figure 7: North America biodegradable trash bags Revenue (undefined), by Types 2025 & 2033
- Figure 8: North America biodegradable trash bags Volume (K), by Types 2025 & 2033
- Figure 9: North America biodegradable trash bags Revenue Share (%), by Types 2025 & 2033
- Figure 10: North America biodegradable trash bags Volume Share (%), by Types 2025 & 2033
- Figure 11: North America biodegradable trash bags Revenue (undefined), by Country 2025 & 2033
- Figure 12: North America biodegradable trash bags Volume (K), by Country 2025 & 2033
- Figure 13: North America biodegradable trash bags Revenue Share (%), by Country 2025 & 2033
- Figure 14: North America biodegradable trash bags Volume Share (%), by Country 2025 & 2033
- Figure 15: South America biodegradable trash bags Revenue (undefined), by Application 2025 & 2033
- Figure 16: South America biodegradable trash bags Volume (K), by Application 2025 & 2033
- Figure 17: South America biodegradable trash bags Revenue Share (%), by Application 2025 & 2033
- Figure 18: South America biodegradable trash bags Volume Share (%), by Application 2025 & 2033
- Figure 19: South America biodegradable trash bags Revenue (undefined), by Types 2025 & 2033
- Figure 20: South America biodegradable trash bags Volume (K), by Types 2025 & 2033
- Figure 21: South America biodegradable trash bags Revenue Share (%), by Types 2025 & 2033
- Figure 22: South America biodegradable trash bags Volume Share (%), by Types 2025 & 2033
- Figure 23: South America biodegradable trash bags Revenue (undefined), by Country 2025 & 2033
- Figure 24: South America biodegradable trash bags Volume (K), by Country 2025 & 2033
- Figure 25: South America biodegradable trash bags Revenue Share (%), by Country 2025 & 2033
- Figure 26: South America biodegradable trash bags Volume Share (%), by Country 2025 & 2033
- Figure 27: Europe biodegradable trash bags Revenue (undefined), by Application 2025 & 2033
- Figure 28: Europe biodegradable trash bags Volume (K), by Application 2025 & 2033
- Figure 29: Europe biodegradable trash bags Revenue Share (%), by Application 2025 & 2033
- Figure 30: Europe biodegradable trash bags Volume Share (%), by Application 2025 & 2033
- Figure 31: Europe biodegradable trash bags Revenue (undefined), by Types 2025 & 2033
- Figure 32: Europe biodegradable trash bags Volume (K), by Types 2025 & 2033
- Figure 33: Europe biodegradable trash bags Revenue Share (%), by Types 2025 & 2033
- Figure 34: Europe biodegradable trash bags Volume Share (%), by Types 2025 & 2033
- Figure 35: Europe biodegradable trash bags Revenue (undefined), by Country 2025 & 2033
- Figure 36: Europe biodegradable trash bags Volume (K), by Country 2025 & 2033
- Figure 37: Europe biodegradable trash bags Revenue Share (%), by Country 2025 & 2033
- Figure 38: Europe biodegradable trash bags Volume Share (%), by Country 2025 & 2033
- Figure 39: Middle East & Africa biodegradable trash bags Revenue (undefined), by Application 2025 & 2033
- Figure 40: Middle East & Africa biodegradable trash bags Volume (K), by Application 2025 & 2033
- Figure 41: Middle East & Africa biodegradable trash bags Revenue Share (%), by Application 2025 & 2033
- Figure 42: Middle East & Africa biodegradable trash bags Volume Share (%), by Application 2025 & 2033
- Figure 43: Middle East & Africa biodegradable trash bags Revenue (undefined), by Types 2025 & 2033
- Figure 44: Middle East & Africa biodegradable trash bags Volume (K), by Types 2025 & 2033
- Figure 45: Middle East & Africa biodegradable trash bags Revenue Share (%), by Types 2025 & 2033
- Figure 46: Middle East & Africa biodegradable trash bags Volume Share (%), by Types 2025 & 2033
- Figure 47: Middle East & Africa biodegradable trash bags Revenue (undefined), by Country 2025 & 2033
- Figure 48: Middle East & Africa biodegradable trash bags Volume (K), by Country 2025 & 2033
- Figure 49: Middle East & Africa biodegradable trash bags Revenue Share (%), by Country 2025 & 2033
- Figure 50: Middle East & Africa biodegradable trash bags Volume Share (%), by Country 2025 & 2033
- Figure 51: Asia Pacific biodegradable trash bags Revenue (undefined), by Application 2025 & 2033
- Figure 52: Asia Pacific biodegradable trash bags Volume (K), by Application 2025 & 2033
- Figure 53: Asia Pacific biodegradable trash bags Revenue Share (%), by Application 2025 & 2033
- Figure 54: Asia Pacific biodegradable trash bags Volume Share (%), by Application 2025 & 2033
- Figure 55: Asia Pacific biodegradable trash bags Revenue (undefined), by Types 2025 & 2033
- Figure 56: Asia Pacific biodegradable trash bags Volume (K), by Types 2025 & 2033
- Figure 57: Asia Pacific biodegradable trash bags Revenue Share (%), by Types 2025 & 2033
- Figure 58: Asia Pacific biodegradable trash bags Volume Share (%), by Types 2025 & 2033
- Figure 59: Asia Pacific biodegradable trash bags Revenue (undefined), by Country 2025 & 2033
- Figure 60: Asia Pacific biodegradable trash bags Volume (K), by Country 2025 & 2033
- Figure 61: Asia Pacific biodegradable trash bags Revenue Share (%), by Country 2025 & 2033
- Figure 62: Asia Pacific biodegradable trash bags Volume Share (%), by Country 2025 & 2033
List of Tables
- Table 1: Global biodegradable trash bags Revenue undefined Forecast, by Application 2020 & 2033
- Table 2: Global biodegradable trash bags Volume K Forecast, by Application 2020 & 2033
- Table 3: Global biodegradable trash bags Revenue undefined Forecast, by Types 2020 & 2033
- Table 4: Global biodegradable trash bags Volume K Forecast, by Types 2020 & 2033
- Table 5: Global biodegradable trash bags Revenue undefined Forecast, by Region 2020 & 2033
- Table 6: Global biodegradable trash bags Volume K Forecast, by Region 2020 & 2033
- Table 7: Global biodegradable trash bags Revenue undefined Forecast, by Application 2020 & 2033
- Table 8: Global biodegradable trash bags Volume K Forecast, by Application 2020 & 2033
- Table 9: Global biodegradable trash bags Revenue undefined Forecast, by Types 2020 & 2033
- Table 10: Global biodegradable trash bags Volume K Forecast, by Types 2020 & 2033
- Table 11: Global biodegradable trash bags Revenue undefined Forecast, by Country 2020 & 2033
- Table 12: Global biodegradable trash bags Volume K Forecast, by Country 2020 & 2033
- Table 13: United States biodegradable trash bags Revenue (undefined) Forecast, by Application 2020 & 2033
- Table 14: United States biodegradable trash bags Volume (K) Forecast, by Application 2020 & 2033
- Table 15: Canada biodegradable trash bags Revenue (undefined) Forecast, by Application 2020 & 2033
- Table 16: Canada biodegradable trash bags Volume (K) Forecast, by Application 2020 & 2033
- Table 17: Mexico biodegradable trash bags Revenue (undefined) Forecast, by Application 2020 & 2033
- Table 18: Mexico biodegradable trash bags Volume (K) Forecast, by Application 2020 & 2033
- Table 19: Global biodegradable trash bags Revenue undefined Forecast, by Application 2020 & 2033
- Table 20: Global biodegradable trash bags Volume K Forecast, by Application 2020 & 2033
- Table 21: Global biodegradable trash bags Revenue undefined Forecast, by Types 2020 & 2033
- Table 22: Global biodegradable trash bags Volume K Forecast, by Types 2020 & 2033
- Table 23: Global biodegradable trash bags Revenue undefined Forecast, by Country 2020 & 2033
- Table 24: Global biodegradable trash bags Volume K Forecast, by Country 2020 & 2033
- Table 25: Brazil biodegradable trash bags Revenue (undefined) Forecast, by Application 2020 & 2033
- Table 26: Brazil biodegradable trash bags Volume (K) Forecast, by Application 2020 & 2033
- Table 27: Argentina biodegradable trash bags Revenue (undefined) Forecast, by Application 2020 & 2033
- Table 28: Argentina biodegradable trash bags Volume (K) Forecast, by Application 2020 & 2033
- Table 29: Rest of South America biodegradable trash bags Revenue (undefined) Forecast, by Application 2020 & 2033
- Table 30: Rest of South America biodegradable trash bags Volume (K) Forecast, by Application 2020 & 2033
- Table 31: Global biodegradable trash bags Revenue undefined Forecast, by Application 2020 & 2033
- Table 32: Global biodegradable trash bags Volume K Forecast, by Application 2020 & 2033
- Table 33: Global biodegradable trash bags Revenue undefined Forecast, by Types 2020 & 2033
- Table 34: Global biodegradable trash bags Volume K Forecast, by Types 2020 & 2033
- Table 35: Global biodegradable trash bags Revenue undefined Forecast, by Country 2020 & 2033
- Table 36: Global biodegradable trash bags Volume K Forecast, by Country 2020 & 2033
- Table 37: United Kingdom biodegradable trash bags Revenue (undefined) Forecast, by Application 2020 & 2033
- Table 38: United Kingdom biodegradable trash bags Volume (K) Forecast, by Application 2020 & 2033
- Table 39: Germany biodegradable trash bags Revenue (undefined) Forecast, by Application 2020 & 2033
- Table 40: Germany biodegradable trash bags Volume (K) Forecast, by Application 2020 & 2033
- Table 41: France biodegradable trash bags Revenue (undefined) Forecast, by Application 2020 & 2033
- Table 42: France biodegradable trash bags Volume (K) Forecast, by Application 2020 & 2033
- Table 43: Italy biodegradable trash bags Revenue (undefined) Forecast, by Application 2020 & 2033
- Table 44: Italy biodegradable trash bags Volume (K) Forecast, by Application 2020 & 2033
- Table 45: Spain biodegradable trash bags Revenue (undefined) Forecast, by Application 2020 & 2033
- Table 46: Spain biodegradable trash bags Volume (K) Forecast, by Application 2020 & 2033
- Table 47: Russia biodegradable trash bags Revenue (undefined) Forecast, by Application 2020 & 2033
- Table 48: Russia biodegradable trash bags Volume (K) Forecast, by Application 2020 & 2033
- Table 49: Benelux biodegradable trash bags Revenue (undefined) Forecast, by Application 2020 & 2033
- Table 50: Benelux biodegradable trash bags Volume (K) Forecast, by Application 2020 & 2033
- Table 51: Nordics biodegradable trash bags Revenue (undefined) Forecast, by Application 2020 & 2033
- Table 52: Nordics biodegradable trash bags Volume (K) Forecast, by Application 2020 & 2033
- Table 53: Rest of Europe biodegradable trash bags Revenue (undefined) Forecast, by Application 2020 & 2033
- Table 54: Rest of Europe biodegradable trash bags Volume (K) Forecast, by Application 2020 & 2033
- Table 55: Global biodegradable trash bags Revenue undefined Forecast, by Application 2020 & 2033
- Table 56: Global biodegradable trash bags Volume K Forecast, by Application 2020 & 2033
- Table 57: Global biodegradable trash bags Revenue undefined Forecast, by Types 2020 & 2033
- Table 58: Global biodegradable trash bags Volume K Forecast, by Types 2020 & 2033
- Table 59: Global biodegradable trash bags Revenue undefined Forecast, by Country 2020 & 2033
- Table 60: Global biodegradable trash bags Volume K Forecast, by Country 2020 & 2033
- Table 61: Turkey biodegradable trash bags Revenue (undefined) Forecast, by Application 2020 & 2033
- Table 62: Turkey biodegradable trash bags Volume (K) Forecast, by Application 2020 & 2033
- Table 63: Israel biodegradable trash bags Revenue (undefined) Forecast, by Application 2020 & 2033
- Table 64: Israel biodegradable trash bags Volume (K) Forecast, by Application 2020 & 2033
- Table 65: GCC biodegradable trash bags Revenue (undefined) Forecast, by Application 2020 & 2033
- Table 66: GCC biodegradable trash bags Volume (K) Forecast, by Application 2020 & 2033
- Table 67: North Africa biodegradable trash bags Revenue (undefined) Forecast, by Application 2020 & 2033
- Table 68: North Africa biodegradable trash bags Volume (K) Forecast, by Application 2020 & 2033
- Table 69: South Africa biodegradable trash bags Revenue (undefined) Forecast, by Application 2020 & 2033
- Table 70: South Africa biodegradable trash bags Volume (K) Forecast, by Application 2020 & 2033
- Table 71: Rest of Middle East & Africa biodegradable trash bags Revenue (undefined) Forecast, by Application 2020 & 2033
- Table 72: Rest of Middle East & Africa biodegradable trash bags Volume (K) Forecast, by Application 2020 & 2033
- Table 73: Global biodegradable trash bags Revenue undefined Forecast, by Application 2020 & 2033
- Table 74: Global biodegradable trash bags Volume K Forecast, by Application 2020 & 2033
- Table 75: Global biodegradable trash bags Revenue undefined Forecast, by Types 2020 & 2033
- Table 76: Global biodegradable trash bags Volume K Forecast, by Types 2020 & 2033
- Table 77: Global biodegradable trash bags Revenue undefined Forecast, by Country 2020 & 2033
- Table 78: Global biodegradable trash bags Volume K Forecast, by Country 2020 & 2033
- Table 79: China biodegradable trash bags Revenue (undefined) Forecast, by Application 2020 & 2033
- Table 80: China biodegradable trash bags Volume (K) Forecast, by Application 2020 & 2033
- Table 81: India biodegradable trash bags Revenue (undefined) Forecast, by Application 2020 & 2033
- Table 82: India biodegradable trash bags Volume (K) Forecast, by Application 2020 & 2033
- Table 83: Japan biodegradable trash bags Revenue (undefined) Forecast, by Application 2020 & 2033
- Table 84: Japan biodegradable trash bags Volume (K) Forecast, by Application 2020 & 2033
- Table 85: South Korea biodegradable trash bags Revenue (undefined) Forecast, by Application 2020 & 2033
- Table 86: South Korea biodegradable trash bags Volume (K) Forecast, by Application 2020 & 2033
- Table 87: ASEAN biodegradable trash bags Revenue (undefined) Forecast, by Application 2020 & 2033
- Table 88: ASEAN biodegradable trash bags Volume (K) Forecast, by Application 2020 & 2033
- Table 89: Oceania biodegradable trash bags Revenue (undefined) Forecast, by Application 2020 & 2033
- Table 90: Oceania biodegradable trash bags Volume (K) Forecast, by Application 2020 & 2033
- Table 91: Rest of Asia Pacific biodegradable trash bags Revenue (undefined) Forecast, by Application 2020 & 2033
- Table 92: Rest of Asia Pacific biodegradable trash bags Volume (K) Forecast, by Application 2020 & 2033
Frequently Asked Questions
1. What is the projected Compound Annual Growth Rate (CAGR) of the biodegradable trash bags?
The projected CAGR is approximately 7.47%.
2. Which companies are prominent players in the biodegradable trash bags?
Key companies in the market include Dunplast Poly Bag, Luban Packing, Zubairi Plastic Bags Industry, Amrit Plastochem, Hefty Brand Products & Home Solutions, The Glad Products Company, Pack-It BV, Inteplast Group, Polykar Industries, Polyethics Industries, Mapco (Pvt), Novolex, Berry Global, NOVPLASTA.
3. What are the main segments of the biodegradable trash bags?
The market segments include Application, Types.
4. Can you provide details about the market size?
The market size is estimated to be USD XXX N/A as of 2022.
5. What are some drivers contributing to market growth?
N/A
6. What are the notable trends driving market growth?
N/A
7. Are there any restraints impacting market growth?
N/A
8. Can you provide examples of recent developments in the market?
N/A
9. What pricing options are available for accessing the report?
Pricing options include single-user, multi-user, and enterprise licenses priced at USD 4350.00, USD 6525.00, and USD 8700.00 respectively.
10. Is the market size provided in terms of value or volume?
The market size is provided in terms of value, measured in N/A and volume, measured in K.
11. Are there any specific market keywords associated with the report?
Yes, the market keyword associated with the report is "biodegradable trash bags," which aids in identifying and referencing the specific market segment covered.
12. How do I determine which pricing option suits my needs best?
The pricing options vary based on user requirements and access needs. Individual users may opt for single-user licenses, while businesses requiring broader access may choose multi-user or enterprise licenses for cost-effective access to the report.
13. Are there any additional resources or data provided in the biodegradable trash bags report?
While the report offers comprehensive insights, it's advisable to review the specific contents or supplementary materials provided to ascertain if additional resources or data are available.
14. How can I stay updated on further developments or reports in the biodegradable trash bags?
To stay informed about further developments, trends, and reports in the biodegradable trash bags, consider subscribing to industry newsletters, following relevant companies and organizations, or regularly checking reputable industry news sources and publications.
Methodology
Step 1 - Identification of Relevant Samples Size from Population Database


Step 2 - Approaches for Defining Global Market Size (Value, Volume* & Price*)

Note*: In applicable scenarios
Step 3 - Data Sources
Primary Research
- Web Analytics
- Survey Reports
- Research Institute
- Latest Research Reports
- Opinion Leaders
Secondary Research
- Annual Reports
- White Paper
- Latest Press Release
- Industry Association
- Paid Database
- Investor Presentations

Step 4 - Data Triangulation
Involves using different sources of information in order to increase the validity of a study
These sources are likely to be stakeholders in a program - participants, other researchers, program staff, other community members, and so on.
Then we put all data in single framework & apply various statistical tools to find out the dynamic on the market.
During the analysis stage, feedback from the stakeholder groups would be compared to determine areas of agreement as well as areas of divergence