

Key Insights
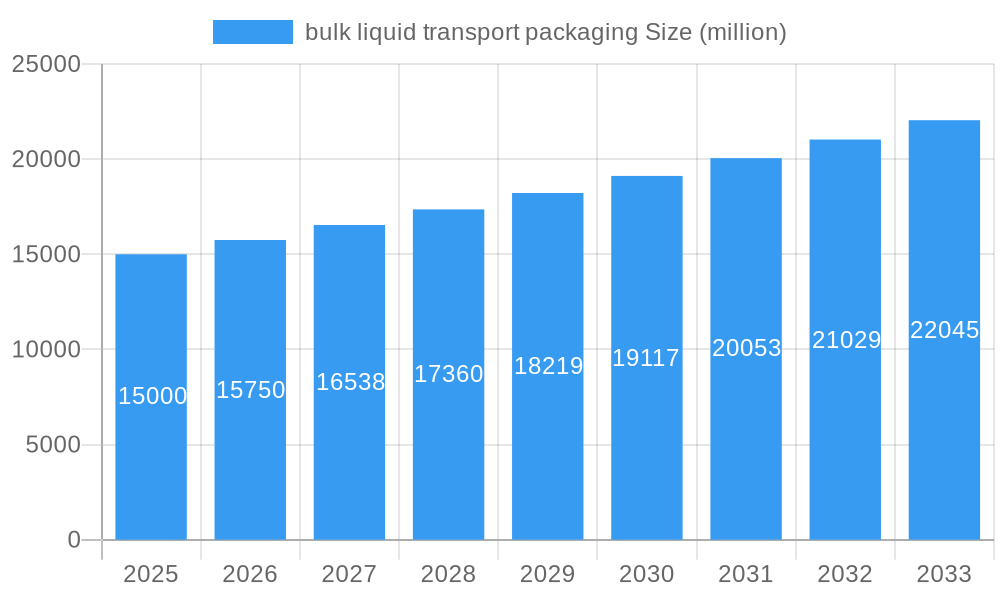
The global bulk liquid transport packaging market is poised for substantial expansion, driven by escalating demand for secure and efficient liquid logistics across diverse industries. Key growth catalysts include the increasing adoption of cost-effective and reusable Flexible Intermediate Bulk Containers (FIBCs) and Intermediate Bulk Containers (IBCs). Stringent regulations governing hazardous material transport further mandate the utilization of advanced packaging solutions. Significant market contributions originate from the food & beverage, chemical, and pharmaceutical sectors, necessitating specialized packaging to preserve product integrity. The burgeoning e-commerce landscape also fuels demand for robust liquid delivery systems. The market size was estimated at $3.7 billion in the base year 2025. With a projected Compound Annual Growth Rate (CAGR) of 4.23%, the market is anticipated to reach approximately $5.5 billion by 2033. Potential restraints include raw material price volatility and environmental sustainability concerns.
bulk liquid transport packaging Market Size (In Billion)
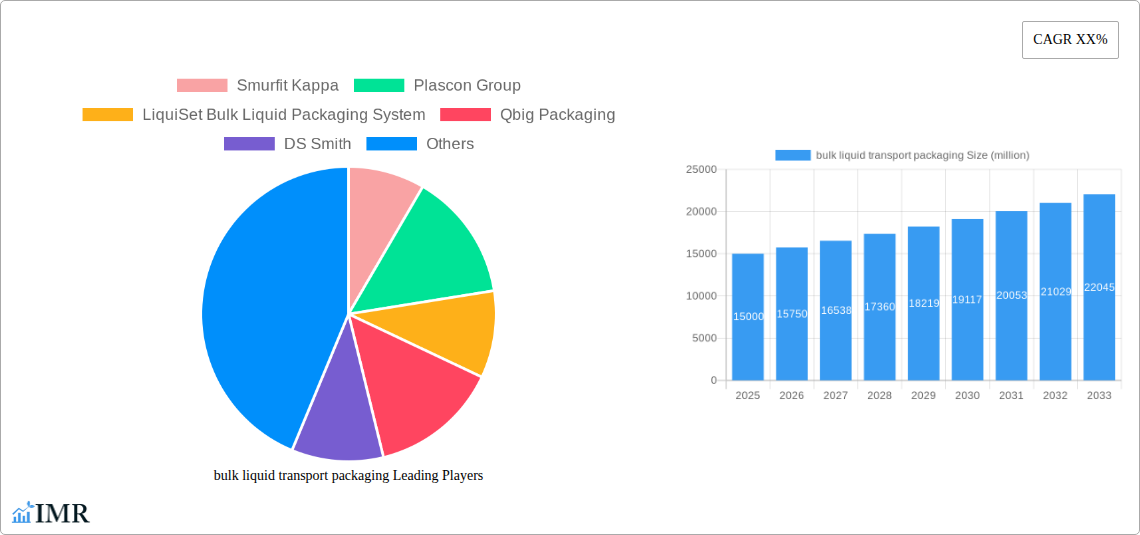
The competitive arena features major global corporations and specialized manufacturers. Leading entities like Smurfit Kappa, DS Smith, and International Paper dominate through extensive distribution and technological prowess. Niche players such as LiquiSet and Qbig Packaging differentiate through specialized applications and innovative solutions. While North America and Europe currently lead, the Asia-Pacific and Latin America regions are expected to exhibit considerable growth, fueled by industrialization and infrastructure development. A key strategic imperative for companies is the development and adoption of sustainable and eco-friendly packaging materials, including recycled and biodegradable options, to align with environmental consciousness and consumer preferences.
bulk liquid transport packaging Company Market Share
Bulk Liquid Transport Packaging Market Report: 2019-2033
This comprehensive report provides a detailed analysis of the bulk liquid transport packaging market, encompassing market dynamics, growth trends, regional dominance, product landscape, key players, and future outlook. The study period covers 2019-2033, with a base year of 2025 and a forecast period of 2025-2033. The report offers invaluable insights for industry professionals, investors, and stakeholders seeking to understand and capitalize on the opportunities within this dynamic sector. The parent market is considered to be the overall packaging industry, while the child market is specifically bulk liquid transport packaging.
Bulk Liquid Transport Packaging Market Dynamics & Structure
This section analyzes the market concentration, technological advancements, regulatory landscape, competitive substitutes, end-user demographics, and merger & acquisition (M&A) activity within the bulk liquid transport packaging market. The market is moderately concentrated, with a few major players holding significant market share. Technological innovation, driven by sustainability concerns and efficiency improvements, is a key driver.
- Market Concentration: The top 5 players hold approximately xx% of the market share in 2025 (Estimated).
- Technological Innovation: Advancements in materials science (e.g., lighter, stronger materials) and design (e.g., improved stacking and handling) are major drivers. Barriers to innovation include high R&D costs and regulatory approvals.
- Regulatory Frameworks: Stringent environmental regulations and safety standards influence packaging design and material selection. Compliance costs contribute to overall market prices.
- Competitive Substitutes: Alternative bulk liquid transport methods, such as tankers and pipelines, pose a competitive threat, particularly for long distances.
- End-User Demographics: The key end-users include the chemical, food and beverage, and pharmaceutical industries, with varying packaging requirements.
- M&A Trends: Consolidation is expected to continue, driven by economies of scale and expansion into new markets. The volume of M&A deals is projected to reach xx million units by 2033.
Bulk Liquid Transport Packaging Growth Trends & Insights
The bulk liquid transport packaging market experienced substantial growth during the historical period (2019-2024) and is expected to continue its expansion throughout the forecast period (2025-2033). This growth is primarily driven by increasing demand from various end-use sectors, coupled with technological advancements and favorable regulatory changes. Market size evolution exhibits a steady CAGR of xx% during 2025-2033. The rising adoption of sustainable packaging solutions further contributes to market expansion. Shifts in consumer preference towards eco-friendly products create additional demand for recyclable and biodegradable materials. Technological disruptions, such as the implementation of smart packaging and improved logistics solutions, also impact market dynamics positively. Market penetration is predicted to reach xx% by 2033, indicating significant growth potential.
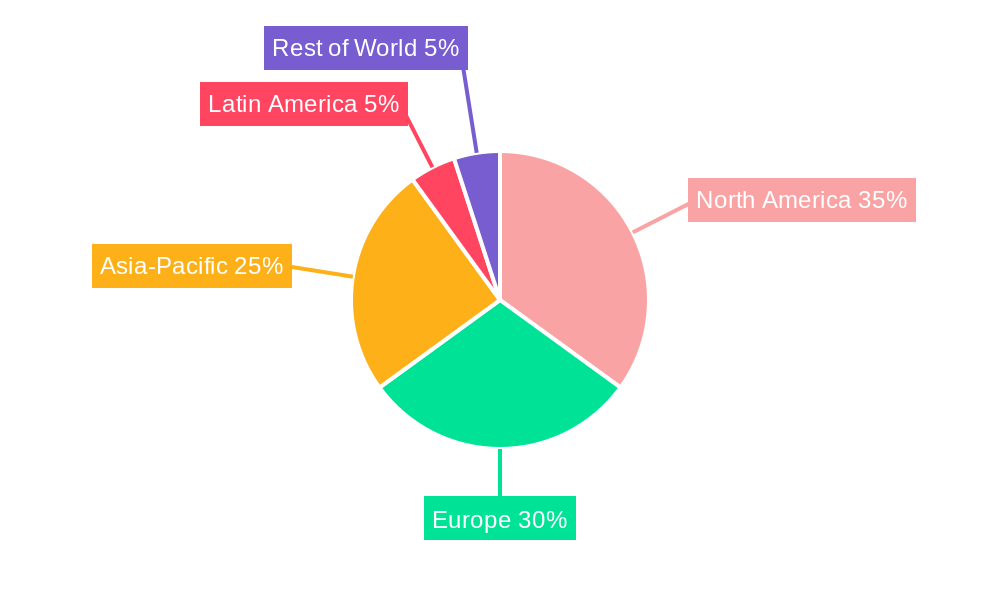
Dominant Regions, Countries, or Segments in Bulk Liquid Transport Packaging
North America currently holds the largest market share, followed by Europe and Asia-Pacific. However, Asia-Pacific is projected to experience the fastest growth rate during the forecast period. This is fueled by factors such as rapid industrialization, economic development, and increasing demand from the chemical and food and beverage industries.
- North America: Strong regulatory frameworks and established infrastructure contribute to market dominance.
- Europe: High adoption of sustainable packaging solutions drives growth.
- Asia-Pacific: Rapid economic growth and increasing industrialization fuel the high growth rate.
- Key Drivers: Expanding industrial sectors, increasing disposable incomes, and rising demand for convenient packaging solutions all contribute to growth.
Bulk Liquid Transport Packaging Product Landscape
The bulk liquid transport packaging market offers a variety of solutions, including drums, IBC totes, flexitanks, and other specialized containers. Product innovations focus on improving durability, reducing weight, enhancing sustainability, and improving logistics efficiency. Recent advancements incorporate smart packaging technologies for real-time tracking and condition monitoring. Unique selling propositions often emphasize ease of handling, improved safety features, and enhanced compatibility with various liquid types.
Key Drivers, Barriers & Challenges in Bulk Liquid Transport Packaging
Key Drivers:
- Increasing demand from various industries (chemicals, food & beverage, pharmaceuticals).
- Growth in e-commerce and related logistics requirements.
- Stringent environmental regulations promoting sustainable packaging.
- Technological advancements leading to cost-effective and efficient solutions.
Key Challenges:
- Fluctuations in raw material prices impacting production costs.
- Stringent regulatory compliance requirements adding to operational complexity.
- Intense competition among existing players and the emergence of new entrants.
- Supply chain disruptions affecting timely product delivery. The impact is estimated to reduce market growth by xx% in 2027.
Emerging Opportunities in Bulk Liquid Transport Packaging
- Growing demand for reusable and recyclable packaging.
- Expansion into emerging markets with increasing industrialization.
- Development of innovative packaging designs for specific liquid types.
- Integration of smart technologies for improved supply chain visibility.
Growth Accelerators in the Bulk Liquid Transport Packaging Industry
Strategic partnerships between packaging manufacturers and logistics providers will improve efficiency and reduce costs. Technological breakthroughs, such as the development of lighter, stronger, and more sustainable materials, will drive innovation. Expansion into new geographic markets and diversification into new product lines will generate further growth.
Key Players Shaping the Bulk Liquid Transport Packaging Market
- Smurfit Kappa
- Plascon Group
- LiquiSet Bulk Liquid Packaging System
- Qbig Packaging
- DS Smith
- PacTec
- International Paper
- Interstate Chemical
Notable Milestones in Bulk Liquid Transport Packaging Sector
- 2020: Introduction of a new biodegradable IBC tote by a major player.
- 2022: Merger between two significant players, creating a larger market entity.
- 2023: Launch of a smart packaging solution with real-time tracking capabilities.
In-Depth Bulk Liquid Transport Packaging Market Outlook
The bulk liquid transport packaging market is poised for significant growth driven by continuous technological innovation, increasing demand from key end-use sectors, and supportive regulatory frameworks. Strategic investments in research and development, coupled with the adoption of sustainable practices, will further shape the market's future. The market's expansion into new geographic regions and the exploration of emerging applications promise robust long-term potential, presenting lucrative opportunities for market participants.
bulk liquid transport packaging Segmentation
-
1. Application
- 1.1. Food Industry
- 1.2. Chemical Industry
- 1.3. Others
-
2. Types
- 2.1. Metal Bulk Liquid Transport Packaging
- 2.2. Plastic Bulk Liquid Transport Packaging
- 2.3. Corrugated Cardboard Bulk Liquid Transport Packaging
bulk liquid transport packaging Segmentation By Geography
-
1. North America
- 1.1. United States
- 1.2. Canada
- 1.3. Mexico
-
2. South America
- 2.1. Brazil
- 2.2. Argentina
- 2.3. Rest of South America
-
3. Europe
- 3.1. United Kingdom
- 3.2. Germany
- 3.3. France
- 3.4. Italy
- 3.5. Spain
- 3.6. Russia
- 3.7. Benelux
- 3.8. Nordics
- 3.9. Rest of Europe
-
4. Middle East & Africa
- 4.1. Turkey
- 4.2. Israel
- 4.3. GCC
- 4.4. North Africa
- 4.5. South Africa
- 4.6. Rest of Middle East & Africa
-
5. Asia Pacific
- 5.1. China
- 5.2. India
- 5.3. Japan
- 5.4. South Korea
- 5.5. ASEAN
- 5.6. Oceania
- 5.7. Rest of Asia Pacific
bulk liquid transport packaging Regional Market Share
Geographic Coverage of bulk liquid transport packaging
bulk liquid transport packaging REPORT HIGHLIGHTS
| Aspects | Details |
|---|---|
| Study Period | 2020-2034 |
| Base Year | 2025 |
| Estimated Year | 2026 |
| Forecast Period | 2026-2034 |
| Historical Period | 2020-2025 |
| Growth Rate | CAGR of 4.23% from 2020-2034 |
| Segmentation |
|
Table of Contents
- 1. Introduction
- 1.1. Research Scope
- 1.2. Market Segmentation
- 1.3. Research Methodology
- 1.4. Definitions and Assumptions
- 2. Executive Summary
- 2.1. Introduction
- 3. Market Dynamics
- 3.1. Introduction
- 3.2. Market Drivers
- 3.3. Market Restrains
- 3.4. Market Trends
- 4. Market Factor Analysis
- 4.1. Porters Five Forces
- 4.2. Supply/Value Chain
- 4.3. PESTEL analysis
- 4.4. Market Entropy
- 4.5. Patent/Trademark Analysis
- 5. Global bulk liquid transport packaging Analysis, Insights and Forecast, 2020-2032
- 5.1. Market Analysis, Insights and Forecast - by Application
- 5.1.1. Food Industry
- 5.1.2. Chemical Industry
- 5.1.3. Others
- 5.2. Market Analysis, Insights and Forecast - by Types
- 5.2.1. Metal Bulk Liquid Transport Packaging
- 5.2.2. Plastic Bulk Liquid Transport Packaging
- 5.2.3. Corrugated Cardboard Bulk Liquid Transport Packaging
- 5.3. Market Analysis, Insights and Forecast - by Region
- 5.3.1. North America
- 5.3.2. South America
- 5.3.3. Europe
- 5.3.4. Middle East & Africa
- 5.3.5. Asia Pacific
- 5.1. Market Analysis, Insights and Forecast - by Application
- 6. North America bulk liquid transport packaging Analysis, Insights and Forecast, 2020-2032
- 6.1. Market Analysis, Insights and Forecast - by Application
- 6.1.1. Food Industry
- 6.1.2. Chemical Industry
- 6.1.3. Others
- 6.2. Market Analysis, Insights and Forecast - by Types
- 6.2.1. Metal Bulk Liquid Transport Packaging
- 6.2.2. Plastic Bulk Liquid Transport Packaging
- 6.2.3. Corrugated Cardboard Bulk Liquid Transport Packaging
- 6.1. Market Analysis, Insights and Forecast - by Application
- 7. South America bulk liquid transport packaging Analysis, Insights and Forecast, 2020-2032
- 7.1. Market Analysis, Insights and Forecast - by Application
- 7.1.1. Food Industry
- 7.1.2. Chemical Industry
- 7.1.3. Others
- 7.2. Market Analysis, Insights and Forecast - by Types
- 7.2.1. Metal Bulk Liquid Transport Packaging
- 7.2.2. Plastic Bulk Liquid Transport Packaging
- 7.2.3. Corrugated Cardboard Bulk Liquid Transport Packaging
- 7.1. Market Analysis, Insights and Forecast - by Application
- 8. Europe bulk liquid transport packaging Analysis, Insights and Forecast, 2020-2032
- 8.1. Market Analysis, Insights and Forecast - by Application
- 8.1.1. Food Industry
- 8.1.2. Chemical Industry
- 8.1.3. Others
- 8.2. Market Analysis, Insights and Forecast - by Types
- 8.2.1. Metal Bulk Liquid Transport Packaging
- 8.2.2. Plastic Bulk Liquid Transport Packaging
- 8.2.3. Corrugated Cardboard Bulk Liquid Transport Packaging
- 8.1. Market Analysis, Insights and Forecast - by Application
- 9. Middle East & Africa bulk liquid transport packaging Analysis, Insights and Forecast, 2020-2032
- 9.1. Market Analysis, Insights and Forecast - by Application
- 9.1.1. Food Industry
- 9.1.2. Chemical Industry
- 9.1.3. Others
- 9.2. Market Analysis, Insights and Forecast - by Types
- 9.2.1. Metal Bulk Liquid Transport Packaging
- 9.2.2. Plastic Bulk Liquid Transport Packaging
- 9.2.3. Corrugated Cardboard Bulk Liquid Transport Packaging
- 9.1. Market Analysis, Insights and Forecast - by Application
- 10. Asia Pacific bulk liquid transport packaging Analysis, Insights and Forecast, 2020-2032
- 10.1. Market Analysis, Insights and Forecast - by Application
- 10.1.1. Food Industry
- 10.1.2. Chemical Industry
- 10.1.3. Others
- 10.2. Market Analysis, Insights and Forecast - by Types
- 10.2.1. Metal Bulk Liquid Transport Packaging
- 10.2.2. Plastic Bulk Liquid Transport Packaging
- 10.2.3. Corrugated Cardboard Bulk Liquid Transport Packaging
- 10.1. Market Analysis, Insights and Forecast - by Application
- 11. Competitive Analysis
- 11.1. Global Market Share Analysis 2025
- 11.2. Company Profiles
- 11.2.1 Smurfit Kappa
- 11.2.1.1. Overview
- 11.2.1.2. Products
- 11.2.1.3. SWOT Analysis
- 11.2.1.4. Recent Developments
- 11.2.1.5. Financials (Based on Availability)
- 11.2.2 Plascon Group
- 11.2.2.1. Overview
- 11.2.2.2. Products
- 11.2.2.3. SWOT Analysis
- 11.2.2.4. Recent Developments
- 11.2.2.5. Financials (Based on Availability)
- 11.2.3 LiquiSet Bulk Liquid Packaging System
- 11.2.3.1. Overview
- 11.2.3.2. Products
- 11.2.3.3. SWOT Analysis
- 11.2.3.4. Recent Developments
- 11.2.3.5. Financials (Based on Availability)
- 11.2.4 Qbig Packaging
- 11.2.4.1. Overview
- 11.2.4.2. Products
- 11.2.4.3. SWOT Analysis
- 11.2.4.4. Recent Developments
- 11.2.4.5. Financials (Based on Availability)
- 11.2.5 DS Smith
- 11.2.5.1. Overview
- 11.2.5.2. Products
- 11.2.5.3. SWOT Analysis
- 11.2.5.4. Recent Developments
- 11.2.5.5. Financials (Based on Availability)
- 11.2.6 PacTec
- 11.2.6.1. Overview
- 11.2.6.2. Products
- 11.2.6.3. SWOT Analysis
- 11.2.6.4. Recent Developments
- 11.2.6.5. Financials (Based on Availability)
- 11.2.7 International Paper
- 11.2.7.1. Overview
- 11.2.7.2. Products
- 11.2.7.3. SWOT Analysis
- 11.2.7.4. Recent Developments
- 11.2.7.5. Financials (Based on Availability)
- 11.2.8 Interstate Chemical
- 11.2.8.1. Overview
- 11.2.8.2. Products
- 11.2.8.3. SWOT Analysis
- 11.2.8.4. Recent Developments
- 11.2.8.5. Financials (Based on Availability)
- 11.2.1 Smurfit Kappa
List of Figures
- Figure 1: Global bulk liquid transport packaging Revenue Breakdown (billion, %) by Region 2025 & 2033
- Figure 2: Global bulk liquid transport packaging Volume Breakdown (K, %) by Region 2025 & 2033
- Figure 3: North America bulk liquid transport packaging Revenue (billion), by Application 2025 & 2033
- Figure 4: North America bulk liquid transport packaging Volume (K), by Application 2025 & 2033
- Figure 5: North America bulk liquid transport packaging Revenue Share (%), by Application 2025 & 2033
- Figure 6: North America bulk liquid transport packaging Volume Share (%), by Application 2025 & 2033
- Figure 7: North America bulk liquid transport packaging Revenue (billion), by Types 2025 & 2033
- Figure 8: North America bulk liquid transport packaging Volume (K), by Types 2025 & 2033
- Figure 9: North America bulk liquid transport packaging Revenue Share (%), by Types 2025 & 2033
- Figure 10: North America bulk liquid transport packaging Volume Share (%), by Types 2025 & 2033
- Figure 11: North America bulk liquid transport packaging Revenue (billion), by Country 2025 & 2033
- Figure 12: North America bulk liquid transport packaging Volume (K), by Country 2025 & 2033
- Figure 13: North America bulk liquid transport packaging Revenue Share (%), by Country 2025 & 2033
- Figure 14: North America bulk liquid transport packaging Volume Share (%), by Country 2025 & 2033
- Figure 15: South America bulk liquid transport packaging Revenue (billion), by Application 2025 & 2033
- Figure 16: South America bulk liquid transport packaging Volume (K), by Application 2025 & 2033
- Figure 17: South America bulk liquid transport packaging Revenue Share (%), by Application 2025 & 2033
- Figure 18: South America bulk liquid transport packaging Volume Share (%), by Application 2025 & 2033
- Figure 19: South America bulk liquid transport packaging Revenue (billion), by Types 2025 & 2033
- Figure 20: South America bulk liquid transport packaging Volume (K), by Types 2025 & 2033
- Figure 21: South America bulk liquid transport packaging Revenue Share (%), by Types 2025 & 2033
- Figure 22: South America bulk liquid transport packaging Volume Share (%), by Types 2025 & 2033
- Figure 23: South America bulk liquid transport packaging Revenue (billion), by Country 2025 & 2033
- Figure 24: South America bulk liquid transport packaging Volume (K), by Country 2025 & 2033
- Figure 25: South America bulk liquid transport packaging Revenue Share (%), by Country 2025 & 2033
- Figure 26: South America bulk liquid transport packaging Volume Share (%), by Country 2025 & 2033
- Figure 27: Europe bulk liquid transport packaging Revenue (billion), by Application 2025 & 2033
- Figure 28: Europe bulk liquid transport packaging Volume (K), by Application 2025 & 2033
- Figure 29: Europe bulk liquid transport packaging Revenue Share (%), by Application 2025 & 2033
- Figure 30: Europe bulk liquid transport packaging Volume Share (%), by Application 2025 & 2033
- Figure 31: Europe bulk liquid transport packaging Revenue (billion), by Types 2025 & 2033
- Figure 32: Europe bulk liquid transport packaging Volume (K), by Types 2025 & 2033
- Figure 33: Europe bulk liquid transport packaging Revenue Share (%), by Types 2025 & 2033
- Figure 34: Europe bulk liquid transport packaging Volume Share (%), by Types 2025 & 2033
- Figure 35: Europe bulk liquid transport packaging Revenue (billion), by Country 2025 & 2033
- Figure 36: Europe bulk liquid transport packaging Volume (K), by Country 2025 & 2033
- Figure 37: Europe bulk liquid transport packaging Revenue Share (%), by Country 2025 & 2033
- Figure 38: Europe bulk liquid transport packaging Volume Share (%), by Country 2025 & 2033
- Figure 39: Middle East & Africa bulk liquid transport packaging Revenue (billion), by Application 2025 & 2033
- Figure 40: Middle East & Africa bulk liquid transport packaging Volume (K), by Application 2025 & 2033
- Figure 41: Middle East & Africa bulk liquid transport packaging Revenue Share (%), by Application 2025 & 2033
- Figure 42: Middle East & Africa bulk liquid transport packaging Volume Share (%), by Application 2025 & 2033
- Figure 43: Middle East & Africa bulk liquid transport packaging Revenue (billion), by Types 2025 & 2033
- Figure 44: Middle East & Africa bulk liquid transport packaging Volume (K), by Types 2025 & 2033
- Figure 45: Middle East & Africa bulk liquid transport packaging Revenue Share (%), by Types 2025 & 2033
- Figure 46: Middle East & Africa bulk liquid transport packaging Volume Share (%), by Types 2025 & 2033
- Figure 47: Middle East & Africa bulk liquid transport packaging Revenue (billion), by Country 2025 & 2033
- Figure 48: Middle East & Africa bulk liquid transport packaging Volume (K), by Country 2025 & 2033
- Figure 49: Middle East & Africa bulk liquid transport packaging Revenue Share (%), by Country 2025 & 2033
- Figure 50: Middle East & Africa bulk liquid transport packaging Volume Share (%), by Country 2025 & 2033
- Figure 51: Asia Pacific bulk liquid transport packaging Revenue (billion), by Application 2025 & 2033
- Figure 52: Asia Pacific bulk liquid transport packaging Volume (K), by Application 2025 & 2033
- Figure 53: Asia Pacific bulk liquid transport packaging Revenue Share (%), by Application 2025 & 2033
- Figure 54: Asia Pacific bulk liquid transport packaging Volume Share (%), by Application 2025 & 2033
- Figure 55: Asia Pacific bulk liquid transport packaging Revenue (billion), by Types 2025 & 2033
- Figure 56: Asia Pacific bulk liquid transport packaging Volume (K), by Types 2025 & 2033
- Figure 57: Asia Pacific bulk liquid transport packaging Revenue Share (%), by Types 2025 & 2033
- Figure 58: Asia Pacific bulk liquid transport packaging Volume Share (%), by Types 2025 & 2033
- Figure 59: Asia Pacific bulk liquid transport packaging Revenue (billion), by Country 2025 & 2033
- Figure 60: Asia Pacific bulk liquid transport packaging Volume (K), by Country 2025 & 2033
- Figure 61: Asia Pacific bulk liquid transport packaging Revenue Share (%), by Country 2025 & 2033
- Figure 62: Asia Pacific bulk liquid transport packaging Volume Share (%), by Country 2025 & 2033
List of Tables
- Table 1: Global bulk liquid transport packaging Revenue billion Forecast, by Application 2020 & 2033
- Table 2: Global bulk liquid transport packaging Volume K Forecast, by Application 2020 & 2033
- Table 3: Global bulk liquid transport packaging Revenue billion Forecast, by Types 2020 & 2033
- Table 4: Global bulk liquid transport packaging Volume K Forecast, by Types 2020 & 2033
- Table 5: Global bulk liquid transport packaging Revenue billion Forecast, by Region 2020 & 2033
- Table 6: Global bulk liquid transport packaging Volume K Forecast, by Region 2020 & 2033
- Table 7: Global bulk liquid transport packaging Revenue billion Forecast, by Application 2020 & 2033
- Table 8: Global bulk liquid transport packaging Volume K Forecast, by Application 2020 & 2033
- Table 9: Global bulk liquid transport packaging Revenue billion Forecast, by Types 2020 & 2033
- Table 10: Global bulk liquid transport packaging Volume K Forecast, by Types 2020 & 2033
- Table 11: Global bulk liquid transport packaging Revenue billion Forecast, by Country 2020 & 2033
- Table 12: Global bulk liquid transport packaging Volume K Forecast, by Country 2020 & 2033
- Table 13: United States bulk liquid transport packaging Revenue (billion) Forecast, by Application 2020 & 2033
- Table 14: United States bulk liquid transport packaging Volume (K) Forecast, by Application 2020 & 2033
- Table 15: Canada bulk liquid transport packaging Revenue (billion) Forecast, by Application 2020 & 2033
- Table 16: Canada bulk liquid transport packaging Volume (K) Forecast, by Application 2020 & 2033
- Table 17: Mexico bulk liquid transport packaging Revenue (billion) Forecast, by Application 2020 & 2033
- Table 18: Mexico bulk liquid transport packaging Volume (K) Forecast, by Application 2020 & 2033
- Table 19: Global bulk liquid transport packaging Revenue billion Forecast, by Application 2020 & 2033
- Table 20: Global bulk liquid transport packaging Volume K Forecast, by Application 2020 & 2033
- Table 21: Global bulk liquid transport packaging Revenue billion Forecast, by Types 2020 & 2033
- Table 22: Global bulk liquid transport packaging Volume K Forecast, by Types 2020 & 2033
- Table 23: Global bulk liquid transport packaging Revenue billion Forecast, by Country 2020 & 2033
- Table 24: Global bulk liquid transport packaging Volume K Forecast, by Country 2020 & 2033
- Table 25: Brazil bulk liquid transport packaging Revenue (billion) Forecast, by Application 2020 & 2033
- Table 26: Brazil bulk liquid transport packaging Volume (K) Forecast, by Application 2020 & 2033
- Table 27: Argentina bulk liquid transport packaging Revenue (billion) Forecast, by Application 2020 & 2033
- Table 28: Argentina bulk liquid transport packaging Volume (K) Forecast, by Application 2020 & 2033
- Table 29: Rest of South America bulk liquid transport packaging Revenue (billion) Forecast, by Application 2020 & 2033
- Table 30: Rest of South America bulk liquid transport packaging Volume (K) Forecast, by Application 2020 & 2033
- Table 31: Global bulk liquid transport packaging Revenue billion Forecast, by Application 2020 & 2033
- Table 32: Global bulk liquid transport packaging Volume K Forecast, by Application 2020 & 2033
- Table 33: Global bulk liquid transport packaging Revenue billion Forecast, by Types 2020 & 2033
- Table 34: Global bulk liquid transport packaging Volume K Forecast, by Types 2020 & 2033
- Table 35: Global bulk liquid transport packaging Revenue billion Forecast, by Country 2020 & 2033
- Table 36: Global bulk liquid transport packaging Volume K Forecast, by Country 2020 & 2033
- Table 37: United Kingdom bulk liquid transport packaging Revenue (billion) Forecast, by Application 2020 & 2033
- Table 38: United Kingdom bulk liquid transport packaging Volume (K) Forecast, by Application 2020 & 2033
- Table 39: Germany bulk liquid transport packaging Revenue (billion) Forecast, by Application 2020 & 2033
- Table 40: Germany bulk liquid transport packaging Volume (K) Forecast, by Application 2020 & 2033
- Table 41: France bulk liquid transport packaging Revenue (billion) Forecast, by Application 2020 & 2033
- Table 42: France bulk liquid transport packaging Volume (K) Forecast, by Application 2020 & 2033
- Table 43: Italy bulk liquid transport packaging Revenue (billion) Forecast, by Application 2020 & 2033
- Table 44: Italy bulk liquid transport packaging Volume (K) Forecast, by Application 2020 & 2033
- Table 45: Spain bulk liquid transport packaging Revenue (billion) Forecast, by Application 2020 & 2033
- Table 46: Spain bulk liquid transport packaging Volume (K) Forecast, by Application 2020 & 2033
- Table 47: Russia bulk liquid transport packaging Revenue (billion) Forecast, by Application 2020 & 2033
- Table 48: Russia bulk liquid transport packaging Volume (K) Forecast, by Application 2020 & 2033
- Table 49: Benelux bulk liquid transport packaging Revenue (billion) Forecast, by Application 2020 & 2033
- Table 50: Benelux bulk liquid transport packaging Volume (K) Forecast, by Application 2020 & 2033
- Table 51: Nordics bulk liquid transport packaging Revenue (billion) Forecast, by Application 2020 & 2033
- Table 52: Nordics bulk liquid transport packaging Volume (K) Forecast, by Application 2020 & 2033
- Table 53: Rest of Europe bulk liquid transport packaging Revenue (billion) Forecast, by Application 2020 & 2033
- Table 54: Rest of Europe bulk liquid transport packaging Volume (K) Forecast, by Application 2020 & 2033
- Table 55: Global bulk liquid transport packaging Revenue billion Forecast, by Application 2020 & 2033
- Table 56: Global bulk liquid transport packaging Volume K Forecast, by Application 2020 & 2033
- Table 57: Global bulk liquid transport packaging Revenue billion Forecast, by Types 2020 & 2033
- Table 58: Global bulk liquid transport packaging Volume K Forecast, by Types 2020 & 2033
- Table 59: Global bulk liquid transport packaging Revenue billion Forecast, by Country 2020 & 2033
- Table 60: Global bulk liquid transport packaging Volume K Forecast, by Country 2020 & 2033
- Table 61: Turkey bulk liquid transport packaging Revenue (billion) Forecast, by Application 2020 & 2033
- Table 62: Turkey bulk liquid transport packaging Volume (K) Forecast, by Application 2020 & 2033
- Table 63: Israel bulk liquid transport packaging Revenue (billion) Forecast, by Application 2020 & 2033
- Table 64: Israel bulk liquid transport packaging Volume (K) Forecast, by Application 2020 & 2033
- Table 65: GCC bulk liquid transport packaging Revenue (billion) Forecast, by Application 2020 & 2033
- Table 66: GCC bulk liquid transport packaging Volume (K) Forecast, by Application 2020 & 2033
- Table 67: North Africa bulk liquid transport packaging Revenue (billion) Forecast, by Application 2020 & 2033
- Table 68: North Africa bulk liquid transport packaging Volume (K) Forecast, by Application 2020 & 2033
- Table 69: South Africa bulk liquid transport packaging Revenue (billion) Forecast, by Application 2020 & 2033
- Table 70: South Africa bulk liquid transport packaging Volume (K) Forecast, by Application 2020 & 2033
- Table 71: Rest of Middle East & Africa bulk liquid transport packaging Revenue (billion) Forecast, by Application 2020 & 2033
- Table 72: Rest of Middle East & Africa bulk liquid transport packaging Volume (K) Forecast, by Application 2020 & 2033
- Table 73: Global bulk liquid transport packaging Revenue billion Forecast, by Application 2020 & 2033
- Table 74: Global bulk liquid transport packaging Volume K Forecast, by Application 2020 & 2033
- Table 75: Global bulk liquid transport packaging Revenue billion Forecast, by Types 2020 & 2033
- Table 76: Global bulk liquid transport packaging Volume K Forecast, by Types 2020 & 2033
- Table 77: Global bulk liquid transport packaging Revenue billion Forecast, by Country 2020 & 2033
- Table 78: Global bulk liquid transport packaging Volume K Forecast, by Country 2020 & 2033
- Table 79: China bulk liquid transport packaging Revenue (billion) Forecast, by Application 2020 & 2033
- Table 80: China bulk liquid transport packaging Volume (K) Forecast, by Application 2020 & 2033
- Table 81: India bulk liquid transport packaging Revenue (billion) Forecast, by Application 2020 & 2033
- Table 82: India bulk liquid transport packaging Volume (K) Forecast, by Application 2020 & 2033
- Table 83: Japan bulk liquid transport packaging Revenue (billion) Forecast, by Application 2020 & 2033
- Table 84: Japan bulk liquid transport packaging Volume (K) Forecast, by Application 2020 & 2033
- Table 85: South Korea bulk liquid transport packaging Revenue (billion) Forecast, by Application 2020 & 2033
- Table 86: South Korea bulk liquid transport packaging Volume (K) Forecast, by Application 2020 & 2033
- Table 87: ASEAN bulk liquid transport packaging Revenue (billion) Forecast, by Application 2020 & 2033
- Table 88: ASEAN bulk liquid transport packaging Volume (K) Forecast, by Application 2020 & 2033
- Table 89: Oceania bulk liquid transport packaging Revenue (billion) Forecast, by Application 2020 & 2033
- Table 90: Oceania bulk liquid transport packaging Volume (K) Forecast, by Application 2020 & 2033
- Table 91: Rest of Asia Pacific bulk liquid transport packaging Revenue (billion) Forecast, by Application 2020 & 2033
- Table 92: Rest of Asia Pacific bulk liquid transport packaging Volume (K) Forecast, by Application 2020 & 2033
Frequently Asked Questions
1. What is the projected Compound Annual Growth Rate (CAGR) of the bulk liquid transport packaging?
The projected CAGR is approximately 4.23%.
2. Which companies are prominent players in the bulk liquid transport packaging?
Key companies in the market include Smurfit Kappa, Plascon Group, LiquiSet Bulk Liquid Packaging System, Qbig Packaging, DS Smith, PacTec, International Paper, Interstate Chemical.
3. What are the main segments of the bulk liquid transport packaging?
The market segments include Application, Types.
4. Can you provide details about the market size?
The market size is estimated to be USD 3.7 billion as of 2022.
5. What are some drivers contributing to market growth?
N/A
6. What are the notable trends driving market growth?
N/A
7. Are there any restraints impacting market growth?
N/A
8. Can you provide examples of recent developments in the market?
N/A
9. What pricing options are available for accessing the report?
Pricing options include single-user, multi-user, and enterprise licenses priced at USD 4350.00, USD 6525.00, and USD 8700.00 respectively.
10. Is the market size provided in terms of value or volume?
The market size is provided in terms of value, measured in billion and volume, measured in K.
11. Are there any specific market keywords associated with the report?
Yes, the market keyword associated with the report is "bulk liquid transport packaging," which aids in identifying and referencing the specific market segment covered.
12. How do I determine which pricing option suits my needs best?
The pricing options vary based on user requirements and access needs. Individual users may opt for single-user licenses, while businesses requiring broader access may choose multi-user or enterprise licenses for cost-effective access to the report.
13. Are there any additional resources or data provided in the bulk liquid transport packaging report?
While the report offers comprehensive insights, it's advisable to review the specific contents or supplementary materials provided to ascertain if additional resources or data are available.
14. How can I stay updated on further developments or reports in the bulk liquid transport packaging?
To stay informed about further developments, trends, and reports in the bulk liquid transport packaging, consider subscribing to industry newsletters, following relevant companies and organizations, or regularly checking reputable industry news sources and publications.
Methodology
Step 1 - Identification of Relevant Samples Size from Population Database


Step 2 - Approaches for Defining Global Market Size (Value, Volume* & Price*)

Note*: In applicable scenarios
Step 3 - Data Sources
Primary Research
- Web Analytics
- Survey Reports
- Research Institute
- Latest Research Reports
- Opinion Leaders
Secondary Research
- Annual Reports
- White Paper
- Latest Press Release
- Industry Association
- Paid Database
- Investor Presentations

Step 4 - Data Triangulation
Involves using different sources of information in order to increase the validity of a study
These sources are likely to be stakeholders in a program - participants, other researchers, program staff, other community members, and so on.
Then we put all data in single framework & apply various statistical tools to find out the dynamic on the market.
During the analysis stage, feedback from the stakeholder groups would be compared to determine areas of agreement as well as areas of divergence