

Key Insights
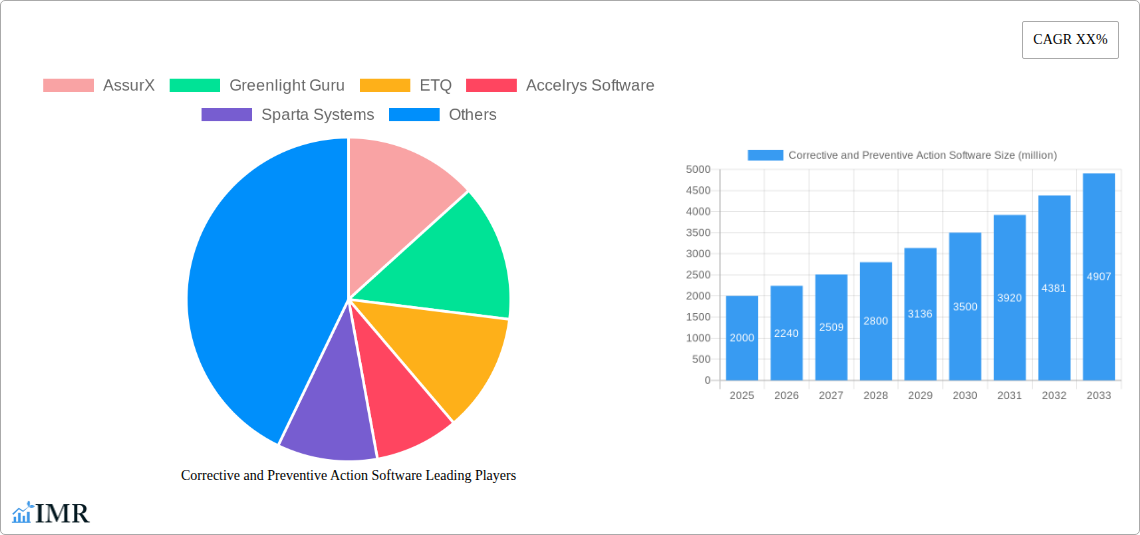
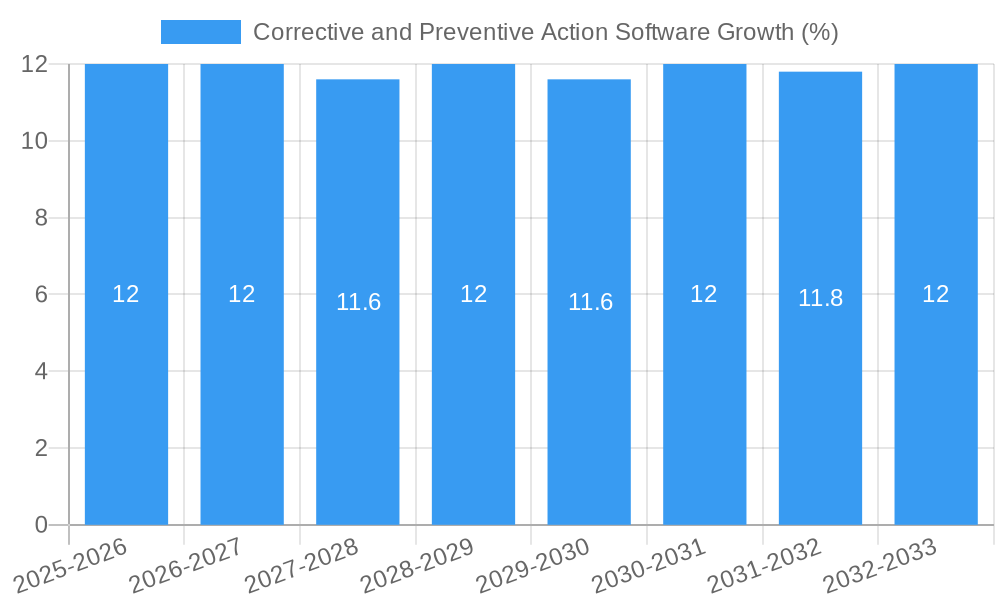
The global Corrective and Preventive Action (CAPA) software market is poised for significant expansion, projected to reach approximately $2,000 million by 2025 and grow at a Compound Annual Growth Rate (CAGR) of around 12% through 2033. This robust growth is fueled by an increasing emphasis on regulatory compliance across diverse industries, including pharmaceuticals, medical devices, and manufacturing, where stringent quality management systems are paramount. The escalating demand for enhanced operational efficiency and the proactive identification and mitigation of product defects and process deviations are key drivers. Furthermore, the rising adoption of digital transformation initiatives and the need for streamlined CAPA workflows to reduce rework and improve customer satisfaction are propelling market momentum. The shift towards cloud-based solutions, offering scalability, accessibility, and cost-effectiveness, is further accelerating market penetration, particularly among Small and Medium-sized Enterprises (SMEs) seeking agile and integrated quality management platforms.
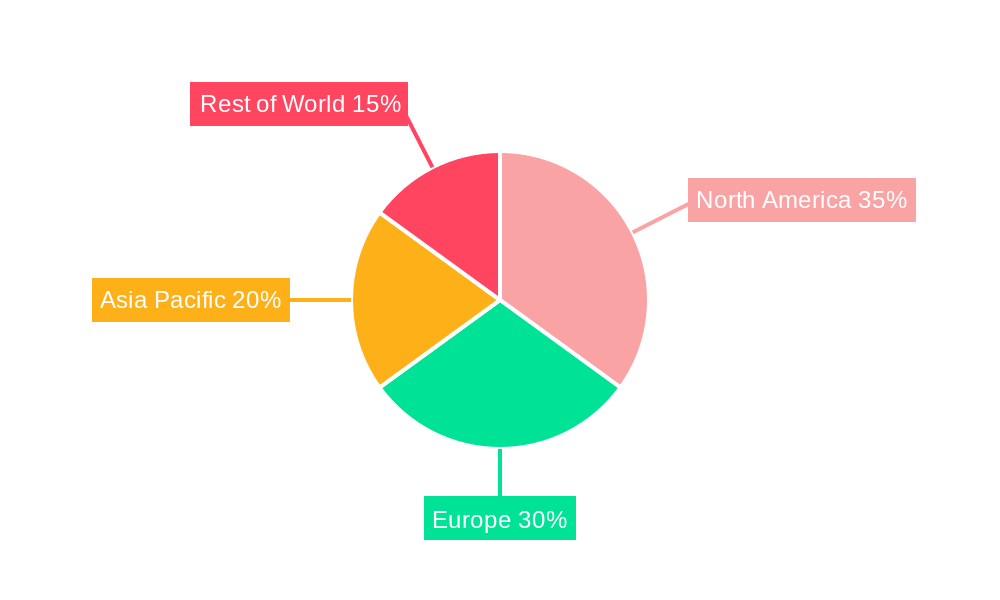
The market segmentation reveals a dynamic landscape, with "Large Enterprises" constituting a significant portion of the user base due to their complex regulatory environments and higher investment capacity in comprehensive quality solutions. However, the "SMEs" segment is expected to witness a faster growth rate as cloud-based CAPA software becomes more accessible and affordable. Regionally, North America is anticipated to lead the market share, driven by established regulatory frameworks and a mature technology adoption rate. Europe follows closely, with a strong focus on quality standards and a growing demand for integrated compliance solutions. The Asia Pacific region is emerging as a high-growth area, attributed to rapid industrialization, increasing adoption of quality management systems, and a burgeoning manufacturing sector in countries like China and India. Key players like MasterControl, Sparta Systems, and ETQ are actively innovating and expanding their product portfolios to cater to these evolving market demands, offering advanced analytics, AI-driven insights, and seamless integration capabilities.
Corrective and Preventive Action Software Market: Comprehensive Analysis and Future Outlook (2019-2033)
This in-depth report provides a definitive analysis of the Corrective and Preventive Action (CAPA) Software market, a critical component for organizations striving for quality, compliance, and operational excellence. Covering the period from 2019 to 2033, with a base year of 2025, this report leverages extensive data to forecast growth, identify key players, and highlight emerging opportunities within this dynamic sector. We delve into the parent market of Quality Management Software (QMS) and its child market, CAPA software, offering a nuanced understanding of its strategic importance and market penetration. Our analysis encompasses leading solutions from AssurX, Greenlight Guru, ETQ, Accelrys Software, Sparta Systems, MasterControl, Intellect, Arena Solutions, Cority, and Intelex Technologies, catering to both Large Enterprises and SMEs, across Cloud-Based and On-Premises deployment models.
Corrective and Preventive Action Software Market Dynamics & Structure
The Corrective and Preventive Action (CAPA) software market is characterized by moderate concentration, with a few key players holding significant market share, while a growing number of specialized vendors cater to niche demands. Technological innovation is a primary driver, fueled by the increasing complexity of regulatory landscapes and the growing imperative for robust quality management systems. Advancements in AI, machine learning for predictive analytics of quality issues, and cloud computing for enhanced accessibility and scalability are reshaping the CAPA software ecosystem. Regulatory frameworks, such as ISO 9001, FDA regulations (e.g., 21 CFR Part 11), and industry-specific guidelines, continue to mandate stringent CAPA processes, thereby solidifying market demand. Competitive product substitutes, including manual processes and general-purpose task management tools, are gradually being phased out as organizations recognize the efficiency and compliance benefits of dedicated CAPA solutions. End-user demographics span across heavily regulated industries like pharmaceuticals, medical devices, manufacturing, aerospace, and food & beverage. Mergers and acquisitions (M&A) trends are evident, with larger software providers acquiring smaller, innovative CAPA solution vendors to expand their QMS offerings and client bases. For instance, a projected xx% increase in M&A activity within the last two years indicates consolidation and strategic expansion.
- Market Concentration: Moderate, with a focus on specialized vendors and growing ecosystem of integrated solutions.
- Technological Innovation: AI/ML for predictive CAPA, cloud scalability, and IoT integration are key trends.
- Regulatory Frameworks: ISO, FDA, and industry-specific mandates are significant demand drivers.
- Competitive Substitutes: Gradual replacement of manual processes by dedicated CAPA software.
- End-User Demographics: Dominated by regulated industries like Pharma, MedTech, Manufacturing, and Aerospace.
- M&A Trends: Increasing consolidation as larger players acquire specialized CAPA providers.
Corrective and Preventive Action Software Growth Trends & Insights
The Corrective and Preventive Action (CAPA) software market is poised for substantial growth, projected to reach approximately $5,600 million by 2033, exhibiting a robust Compound Annual Growth Rate (CAGR) of 12.8% during the forecast period (2025–2033). This growth is underpinned by increasing global regulatory scrutiny, a growing emphasis on product quality and patient safety, and the rising adoption of digital transformation initiatives across industries. The market size in the base year of 2025 is estimated at $2,350 million. Historical data from 2019-2024 shows a steady upward trajectory, with the market evolving from a niche solution to a critical business imperative. The adoption rates for CAPA software are accelerating, particularly among Small and Medium-sized Enterprises (SMEs) which are increasingly recognizing the cost-effectiveness and compliance advantages of these solutions, with penetration expected to grow from xx% in 2024 to xx% by 2033. Technological disruptions, such as the integration of artificial intelligence (AI) for predictive CAPA identification and automated root cause analysis, are further enhancing the value proposition and driving adoption. Furthermore, shifts in consumer behavior, demanding higher quality and safer products, are compelling organizations to invest in sophisticated CAPA systems to maintain brand reputation and customer trust. The increasing complexity of global supply chains also necessitates robust CAPA processes to manage and mitigate risks effectively. The global CAPA software market is a significant sub-segment of the broader Quality Management Software (QMS) market, which itself is projected to exceed $20,000 million by 2030. The child market of CAPA software is experiencing accelerated growth due to its critical role in addressing non-conformances and driving continuous improvement.
Dominant Regions, Countries, or Segments in Corrective and Preventive Action Software
The Cloud-Based deployment model is currently dominating the Corrective and Preventive Action (CAPA) software market, driven by its inherent scalability, flexibility, and cost-effectiveness, particularly for SMEs. In 2025, cloud-based solutions are estimated to capture approximately 72% of the total market revenue, with an anticipated growth rate of 13.5% during the forecast period. This segment’s dominance is fueled by rapid advancements in cloud infrastructure, enhanced data security measures, and the increasing preference for subscription-based software models across industries. North America currently leads the global CAPA software market, accounting for an estimated 38% of the total market share in 2025. This leadership is attributed to a stringent regulatory environment, particularly in the pharmaceutical and medical device sectors, coupled with a high level of technological adoption and a mature market for enterprise software solutions. The United States, a key market within North America, has a well-established ecosystem of CAPA software providers and a strong demand from large enterprises seeking to optimize their quality management processes.
- Dominant Segment by Type: Cloud-Based solutions are leading, with an estimated market share of 72% in 2025 and a strong CAGR of 13.5%.
- Dominant Region: North America, holding an estimated 38% market share in 2025, driven by regulatory demands and technology adoption.
- Key Drivers in North America:
- Stringent FDA regulations and other industry-specific compliance requirements.
- High adoption rates of advanced technologies like AI and IoT for quality management.
- Presence of major pharmaceutical, medical device, and manufacturing companies.
- Significant investment in enterprise software solutions by large corporations.
- Growth Potential in Cloud-Based: Expected to continue its upward trajectory due to benefits like reduced IT overhead, easier updates, and remote accessibility.
Corrective and Preventive Action Software Product Landscape
The Corrective and Preventive Action (CAPA) software product landscape is characterized by continuous innovation, with vendors focusing on enhanced user interfaces, intuitive workflows, and robust integration capabilities. Leading solutions offer comprehensive features for issue identification, root cause analysis, action planning, implementation tracking, and effectiveness verification. Advanced functionalities include risk-based CAPA prioritization, automated reporting, and integration with other quality management modules like document control, training management, and audit management. The performance metrics of these software solutions are measured by their ability to reduce non-conformances, shorten CAPA cycle times, improve audit readiness, and enhance overall compliance. Unique selling propositions often revolve around industry-specific configurations, powerful analytics, and seamless integration with existing enterprise systems. Technological advancements are leading to more intelligent CAPA systems that can proactively identify potential issues based on historical data and real-time operational feedback.
Key Drivers, Barriers & Challenges in Corrective and Preventive Action Software
The Corrective and Preventive Action (CAPA) software market is propelled by several key drivers. The increasing stringency of global regulatory compliance requirements across industries like pharmaceuticals, medical devices, and food & beverage is a paramount driver. The growing imperative for enhanced product quality, patient safety, and operational efficiency further fuels demand. Technological advancements, including AI and machine learning for predictive analytics and automated root cause analysis, are creating new avenues for market growth. The need for better data management and traceability in complex supply chains also contributes significantly.
Conversely, the market faces several barriers and challenges. High initial implementation costs and the complexity of integrating CAPA software with existing IT infrastructure can deter some organizations, particularly SMEs. A lack of awareness or understanding of the full benefits of dedicated CAPA solutions among certain sectors represents another hurdle. Resistance to change and the need for comprehensive user training can also slow adoption. Furthermore, evolving data privacy regulations and cybersecurity concerns require constant vigilance and investment from vendors and users alike. The cost of skilled personnel to manage and maintain CAPA systems can also be a significant challenge.
Emerging Opportunities in Corrective and Preventive Action Software
Emerging opportunities in the CAPA software market lie in the increasing demand for predictive CAPA solutions powered by AI and machine learning, which can proactively identify potential issues before they escalate. The expansion of CAPA software into emerging economies and less regulated industries seeking to improve quality standards presents a significant untapped market. Furthermore, the integration of CAPA functionalities within broader digital transformation initiatives, such as the Internet of Things (IoT) for real-time data capture and analysis, offers innovative application areas. The growing preference for integrated quality management suites where CAPA is a seamless component also presents an opportunity for vendors to offer comprehensive solutions.
Growth Accelerators in the Corrective and Preventive Action Software Industry
Several growth accelerators are propelling the Corrective and Preventive Action (CAPA) software industry forward. The continuous push for digital transformation across all business sectors is a major catalyst, driving the adoption of cloud-based and integrated software solutions. Strategic partnerships between CAPA software vendors and other technology providers, such as ERP systems or AI platforms, are expanding capabilities and market reach. Market expansion strategies into new geographical regions and industry verticals, coupled with the development of industry-specific CAPA solutions, are also significant growth accelerators. Furthermore, increasing investments in research and development by leading players to enhance predictive capabilities and user experience are fostering innovation and driving long-term market expansion.
Key Players Shaping the Corrective and Preventive Action Software Market
- AssurX
- Greenlight Guru
- ETQ
- Accelrys Software
- Sparta Systems
- MasterControl
- Intellect
- Arena Solutions
- Cority
- Intelex Technologies
Notable Milestones in Corrective and Preventive Action Software Sector
- 2020: Increased focus on remote work led to a surge in demand for cloud-based CAPA solutions.
- 2021: Introduction of AI-powered predictive analytics for CAPA identification by leading vendors.
- 2022: Major acquisitions of specialized CAPA software companies by larger QMS providers.
- 2023: Enhanced integration of CAPA modules with broader digital transformation platforms.
- 2024: Growing emphasis on data security and compliance with evolving global privacy regulations.
In-Depth Corrective and Preventive Action Software Market Outlook
The future outlook for the Corrective and Preventive Action (CAPA) software market remains exceptionally strong, driven by ongoing regulatory pressures, the relentless pursuit of operational excellence, and the pervasive digital transformation agenda. The market is expected to witness continued innovation in AI-driven predictive analytics, further solidifying its role as a proactive quality management tool. Opportunities abound in expanding market penetration within SMEs and emerging economies, alongside deeper integration into connected manufacturing environments powered by IoT. Strategic alliances and the development of comprehensive, integrated QMS suites will be critical for sustained growth, positioning CAPA software as an indispensable component of modern business operations.
Corrective and Preventive Action Software Segmentation
-
1. Application
- 1.1. Large Enterprises
- 1.2. SMEs
-
2. Types
- 2.1. Cloud Based
- 2.2. On-premises
Corrective and Preventive Action Software Segmentation By Geography
-
1. North America
- 1.1. United States
- 1.2. Canada
- 1.3. Mexico
-
2. South America
- 2.1. Brazil
- 2.2. Argentina
- 2.3. Rest of South America
-
3. Europe
- 3.1. United Kingdom
- 3.2. Germany
- 3.3. France
- 3.4. Italy
- 3.5. Spain
- 3.6. Russia
- 3.7. Benelux
- 3.8. Nordics
- 3.9. Rest of Europe
-
4. Middle East & Africa
- 4.1. Turkey
- 4.2. Israel
- 4.3. GCC
- 4.4. North Africa
- 4.5. South Africa
- 4.6. Rest of Middle East & Africa
-
5. Asia Pacific
- 5.1. China
- 5.2. India
- 5.3. Japan
- 5.4. South Korea
- 5.5. ASEAN
- 5.6. Oceania
- 5.7. Rest of Asia Pacific
Corrective and Preventive Action Software REPORT HIGHLIGHTS
| Aspects | Details |
|---|---|
| Study Period | 2019-2033 |
| Base Year | 2024 |
| Estimated Year | 2025 |
| Forecast Period | 2025-2033 |
| Historical Period | 2019-2024 |
| Growth Rate | CAGR of XX% from 2019-2033 |
| Segmentation |
|
Table of Contents
- 1. Introduction
- 1.1. Research Scope
- 1.2. Market Segmentation
- 1.3. Research Methodology
- 1.4. Definitions and Assumptions
- 2. Executive Summary
- 2.1. Introduction
- 3. Market Dynamics
- 3.1. Introduction
- 3.2. Market Drivers
- 3.3. Market Restrains
- 3.4. Market Trends
- 4. Market Factor Analysis
- 4.1. Porters Five Forces
- 4.2. Supply/Value Chain
- 4.3. PESTEL analysis
- 4.4. Market Entropy
- 4.5. Patent/Trademark Analysis
- 5. Global Corrective and Preventive Action Software Analysis, Insights and Forecast, 2019-2031
- 5.1. Market Analysis, Insights and Forecast - by Application
- 5.1.1. Large Enterprises
- 5.1.2. SMEs
- 5.2. Market Analysis, Insights and Forecast - by Types
- 5.2.1. Cloud Based
- 5.2.2. On-premises
- 5.3. Market Analysis, Insights and Forecast - by Region
- 5.3.1. North America
- 5.3.2. South America
- 5.3.3. Europe
- 5.3.4. Middle East & Africa
- 5.3.5. Asia Pacific
- 5.1. Market Analysis, Insights and Forecast - by Application
- 6. North America Corrective and Preventive Action Software Analysis, Insights and Forecast, 2019-2031
- 6.1. Market Analysis, Insights and Forecast - by Application
- 6.1.1. Large Enterprises
- 6.1.2. SMEs
- 6.2. Market Analysis, Insights and Forecast - by Types
- 6.2.1. Cloud Based
- 6.2.2. On-premises
- 6.1. Market Analysis, Insights and Forecast - by Application
- 7. South America Corrective and Preventive Action Software Analysis, Insights and Forecast, 2019-2031
- 7.1. Market Analysis, Insights and Forecast - by Application
- 7.1.1. Large Enterprises
- 7.1.2. SMEs
- 7.2. Market Analysis, Insights and Forecast - by Types
- 7.2.1. Cloud Based
- 7.2.2. On-premises
- 7.1. Market Analysis, Insights and Forecast - by Application
- 8. Europe Corrective and Preventive Action Software Analysis, Insights and Forecast, 2019-2031
- 8.1. Market Analysis, Insights and Forecast - by Application
- 8.1.1. Large Enterprises
- 8.1.2. SMEs
- 8.2. Market Analysis, Insights and Forecast - by Types
- 8.2.1. Cloud Based
- 8.2.2. On-premises
- 8.1. Market Analysis, Insights and Forecast - by Application
- 9. Middle East & Africa Corrective and Preventive Action Software Analysis, Insights and Forecast, 2019-2031
- 9.1. Market Analysis, Insights and Forecast - by Application
- 9.1.1. Large Enterprises
- 9.1.2. SMEs
- 9.2. Market Analysis, Insights and Forecast - by Types
- 9.2.1. Cloud Based
- 9.2.2. On-premises
- 9.1. Market Analysis, Insights and Forecast - by Application
- 10. Asia Pacific Corrective and Preventive Action Software Analysis, Insights and Forecast, 2019-2031
- 10.1. Market Analysis, Insights and Forecast - by Application
- 10.1.1. Large Enterprises
- 10.1.2. SMEs
- 10.2. Market Analysis, Insights and Forecast - by Types
- 10.2.1. Cloud Based
- 10.2.2. On-premises
- 10.1. Market Analysis, Insights and Forecast - by Application
- 11. Competitive Analysis
- 11.1. Global Market Share Analysis 2024
- 11.2. Company Profiles
- 11.2.1 AssurX
- 11.2.1.1. Overview
- 11.2.1.2. Products
- 11.2.1.3. SWOT Analysis
- 11.2.1.4. Recent Developments
- 11.2.1.5. Financials (Based on Availability)
- 11.2.2 Greenlight Guru
- 11.2.2.1. Overview
- 11.2.2.2. Products
- 11.2.2.3. SWOT Analysis
- 11.2.2.4. Recent Developments
- 11.2.2.5. Financials (Based on Availability)
- 11.2.3 ETQ
- 11.2.3.1. Overview
- 11.2.3.2. Products
- 11.2.3.3. SWOT Analysis
- 11.2.3.4. Recent Developments
- 11.2.3.5. Financials (Based on Availability)
- 11.2.4 Accelrys Software
- 11.2.4.1. Overview
- 11.2.4.2. Products
- 11.2.4.3. SWOT Analysis
- 11.2.4.4. Recent Developments
- 11.2.4.5. Financials (Based on Availability)
- 11.2.5 Sparta Systems
- 11.2.5.1. Overview
- 11.2.5.2. Products
- 11.2.5.3. SWOT Analysis
- 11.2.5.4. Recent Developments
- 11.2.5.5. Financials (Based on Availability)
- 11.2.6 MasterControl
- 11.2.6.1. Overview
- 11.2.6.2. Products
- 11.2.6.3. SWOT Analysis
- 11.2.6.4. Recent Developments
- 11.2.6.5. Financials (Based on Availability)
- 11.2.7 Intellect
- 11.2.7.1. Overview
- 11.2.7.2. Products
- 11.2.7.3. SWOT Analysis
- 11.2.7.4. Recent Developments
- 11.2.7.5. Financials (Based on Availability)
- 11.2.8 Arena Solutions
- 11.2.8.1. Overview
- 11.2.8.2. Products
- 11.2.8.3. SWOT Analysis
- 11.2.8.4. Recent Developments
- 11.2.8.5. Financials (Based on Availability)
- 11.2.9 Cority
- 11.2.9.1. Overview
- 11.2.9.2. Products
- 11.2.9.3. SWOT Analysis
- 11.2.9.4. Recent Developments
- 11.2.9.5. Financials (Based on Availability)
- 11.2.10 Intelex Technologies
- 11.2.10.1. Overview
- 11.2.10.2. Products
- 11.2.10.3. SWOT Analysis
- 11.2.10.4. Recent Developments
- 11.2.10.5. Financials (Based on Availability)
- 11.2.1 AssurX
List of Figures
- Figure 1: Global Corrective and Preventive Action Software Revenue Breakdown (million, %) by Region 2024 & 2032
- Figure 2: North America Corrective and Preventive Action Software Revenue (million), by Application 2024 & 2032
- Figure 3: North America Corrective and Preventive Action Software Revenue Share (%), by Application 2024 & 2032
- Figure 4: North America Corrective and Preventive Action Software Revenue (million), by Types 2024 & 2032
- Figure 5: North America Corrective and Preventive Action Software Revenue Share (%), by Types 2024 & 2032
- Figure 6: North America Corrective and Preventive Action Software Revenue (million), by Country 2024 & 2032
- Figure 7: North America Corrective and Preventive Action Software Revenue Share (%), by Country 2024 & 2032
- Figure 8: South America Corrective and Preventive Action Software Revenue (million), by Application 2024 & 2032
- Figure 9: South America Corrective and Preventive Action Software Revenue Share (%), by Application 2024 & 2032
- Figure 10: South America Corrective and Preventive Action Software Revenue (million), by Types 2024 & 2032
- Figure 11: South America Corrective and Preventive Action Software Revenue Share (%), by Types 2024 & 2032
- Figure 12: South America Corrective and Preventive Action Software Revenue (million), by Country 2024 & 2032
- Figure 13: South America Corrective and Preventive Action Software Revenue Share (%), by Country 2024 & 2032
- Figure 14: Europe Corrective and Preventive Action Software Revenue (million), by Application 2024 & 2032
- Figure 15: Europe Corrective and Preventive Action Software Revenue Share (%), by Application 2024 & 2032
- Figure 16: Europe Corrective and Preventive Action Software Revenue (million), by Types 2024 & 2032
- Figure 17: Europe Corrective and Preventive Action Software Revenue Share (%), by Types 2024 & 2032
- Figure 18: Europe Corrective and Preventive Action Software Revenue (million), by Country 2024 & 2032
- Figure 19: Europe Corrective and Preventive Action Software Revenue Share (%), by Country 2024 & 2032
- Figure 20: Middle East & Africa Corrective and Preventive Action Software Revenue (million), by Application 2024 & 2032
- Figure 21: Middle East & Africa Corrective and Preventive Action Software Revenue Share (%), by Application 2024 & 2032
- Figure 22: Middle East & Africa Corrective and Preventive Action Software Revenue (million), by Types 2024 & 2032
- Figure 23: Middle East & Africa Corrective and Preventive Action Software Revenue Share (%), by Types 2024 & 2032
- Figure 24: Middle East & Africa Corrective and Preventive Action Software Revenue (million), by Country 2024 & 2032
- Figure 25: Middle East & Africa Corrective and Preventive Action Software Revenue Share (%), by Country 2024 & 2032
- Figure 26: Asia Pacific Corrective and Preventive Action Software Revenue (million), by Application 2024 & 2032
- Figure 27: Asia Pacific Corrective and Preventive Action Software Revenue Share (%), by Application 2024 & 2032
- Figure 28: Asia Pacific Corrective and Preventive Action Software Revenue (million), by Types 2024 & 2032
- Figure 29: Asia Pacific Corrective and Preventive Action Software Revenue Share (%), by Types 2024 & 2032
- Figure 30: Asia Pacific Corrective and Preventive Action Software Revenue (million), by Country 2024 & 2032
- Figure 31: Asia Pacific Corrective and Preventive Action Software Revenue Share (%), by Country 2024 & 2032
List of Tables
- Table 1: Global Corrective and Preventive Action Software Revenue million Forecast, by Region 2019 & 2032
- Table 2: Global Corrective and Preventive Action Software Revenue million Forecast, by Application 2019 & 2032
- Table 3: Global Corrective and Preventive Action Software Revenue million Forecast, by Types 2019 & 2032
- Table 4: Global Corrective and Preventive Action Software Revenue million Forecast, by Region 2019 & 2032
- Table 5: Global Corrective and Preventive Action Software Revenue million Forecast, by Application 2019 & 2032
- Table 6: Global Corrective and Preventive Action Software Revenue million Forecast, by Types 2019 & 2032
- Table 7: Global Corrective and Preventive Action Software Revenue million Forecast, by Country 2019 & 2032
- Table 8: United States Corrective and Preventive Action Software Revenue (million) Forecast, by Application 2019 & 2032
- Table 9: Canada Corrective and Preventive Action Software Revenue (million) Forecast, by Application 2019 & 2032
- Table 10: Mexico Corrective and Preventive Action Software Revenue (million) Forecast, by Application 2019 & 2032
- Table 11: Global Corrective and Preventive Action Software Revenue million Forecast, by Application 2019 & 2032
- Table 12: Global Corrective and Preventive Action Software Revenue million Forecast, by Types 2019 & 2032
- Table 13: Global Corrective and Preventive Action Software Revenue million Forecast, by Country 2019 & 2032
- Table 14: Brazil Corrective and Preventive Action Software Revenue (million) Forecast, by Application 2019 & 2032
- Table 15: Argentina Corrective and Preventive Action Software Revenue (million) Forecast, by Application 2019 & 2032
- Table 16: Rest of South America Corrective and Preventive Action Software Revenue (million) Forecast, by Application 2019 & 2032
- Table 17: Global Corrective and Preventive Action Software Revenue million Forecast, by Application 2019 & 2032
- Table 18: Global Corrective and Preventive Action Software Revenue million Forecast, by Types 2019 & 2032
- Table 19: Global Corrective and Preventive Action Software Revenue million Forecast, by Country 2019 & 2032
- Table 20: United Kingdom Corrective and Preventive Action Software Revenue (million) Forecast, by Application 2019 & 2032
- Table 21: Germany Corrective and Preventive Action Software Revenue (million) Forecast, by Application 2019 & 2032
- Table 22: France Corrective and Preventive Action Software Revenue (million) Forecast, by Application 2019 & 2032
- Table 23: Italy Corrective and Preventive Action Software Revenue (million) Forecast, by Application 2019 & 2032
- Table 24: Spain Corrective and Preventive Action Software Revenue (million) Forecast, by Application 2019 & 2032
- Table 25: Russia Corrective and Preventive Action Software Revenue (million) Forecast, by Application 2019 & 2032
- Table 26: Benelux Corrective and Preventive Action Software Revenue (million) Forecast, by Application 2019 & 2032
- Table 27: Nordics Corrective and Preventive Action Software Revenue (million) Forecast, by Application 2019 & 2032
- Table 28: Rest of Europe Corrective and Preventive Action Software Revenue (million) Forecast, by Application 2019 & 2032
- Table 29: Global Corrective and Preventive Action Software Revenue million Forecast, by Application 2019 & 2032
- Table 30: Global Corrective and Preventive Action Software Revenue million Forecast, by Types 2019 & 2032
- Table 31: Global Corrective and Preventive Action Software Revenue million Forecast, by Country 2019 & 2032
- Table 32: Turkey Corrective and Preventive Action Software Revenue (million) Forecast, by Application 2019 & 2032
- Table 33: Israel Corrective and Preventive Action Software Revenue (million) Forecast, by Application 2019 & 2032
- Table 34: GCC Corrective and Preventive Action Software Revenue (million) Forecast, by Application 2019 & 2032
- Table 35: North Africa Corrective and Preventive Action Software Revenue (million) Forecast, by Application 2019 & 2032
- Table 36: South Africa Corrective and Preventive Action Software Revenue (million) Forecast, by Application 2019 & 2032
- Table 37: Rest of Middle East & Africa Corrective and Preventive Action Software Revenue (million) Forecast, by Application 2019 & 2032
- Table 38: Global Corrective and Preventive Action Software Revenue million Forecast, by Application 2019 & 2032
- Table 39: Global Corrective and Preventive Action Software Revenue million Forecast, by Types 2019 & 2032
- Table 40: Global Corrective and Preventive Action Software Revenue million Forecast, by Country 2019 & 2032
- Table 41: China Corrective and Preventive Action Software Revenue (million) Forecast, by Application 2019 & 2032
- Table 42: India Corrective and Preventive Action Software Revenue (million) Forecast, by Application 2019 & 2032
- Table 43: Japan Corrective and Preventive Action Software Revenue (million) Forecast, by Application 2019 & 2032
- Table 44: South Korea Corrective and Preventive Action Software Revenue (million) Forecast, by Application 2019 & 2032
- Table 45: ASEAN Corrective and Preventive Action Software Revenue (million) Forecast, by Application 2019 & 2032
- Table 46: Oceania Corrective and Preventive Action Software Revenue (million) Forecast, by Application 2019 & 2032
- Table 47: Rest of Asia Pacific Corrective and Preventive Action Software Revenue (million) Forecast, by Application 2019 & 2032
Frequently Asked Questions
1. What is the projected Compound Annual Growth Rate (CAGR) of the Corrective and Preventive Action Software?
The projected CAGR is approximately XX%.
2. Which companies are prominent players in the Corrective and Preventive Action Software?
Key companies in the market include AssurX, Greenlight Guru, ETQ, Accelrys Software, Sparta Systems, MasterControl, Intellect, Arena Solutions, Cority, Intelex Technologies.
3. What are the main segments of the Corrective and Preventive Action Software?
The market segments include Application, Types.
4. Can you provide details about the market size?
The market size is estimated to be USD XXX million as of 2022.
5. What are some drivers contributing to market growth?
N/A
6. What are the notable trends driving market growth?
N/A
7. Are there any restraints impacting market growth?
N/A
8. Can you provide examples of recent developments in the market?
N/A
9. What pricing options are available for accessing the report?
Pricing options include single-user, multi-user, and enterprise licenses priced at USD 3350.00, USD 5025.00, and USD 6700.00 respectively.
10. Is the market size provided in terms of value or volume?
The market size is provided in terms of value, measured in million.
11. Are there any specific market keywords associated with the report?
Yes, the market keyword associated with the report is "Corrective and Preventive Action Software," which aids in identifying and referencing the specific market segment covered.
12. How do I determine which pricing option suits my needs best?
The pricing options vary based on user requirements and access needs. Individual users may opt for single-user licenses, while businesses requiring broader access may choose multi-user or enterprise licenses for cost-effective access to the report.
13. Are there any additional resources or data provided in the Corrective and Preventive Action Software report?
While the report offers comprehensive insights, it's advisable to review the specific contents or supplementary materials provided to ascertain if additional resources or data are available.
14. How can I stay updated on further developments or reports in the Corrective and Preventive Action Software?
To stay informed about further developments, trends, and reports in the Corrective and Preventive Action Software, consider subscribing to industry newsletters, following relevant companies and organizations, or regularly checking reputable industry news sources and publications.
Methodology
Step 1 - Identification of Relevant Samples Size from Population Database


Step 2 - Approaches for Defining Global Market Size (Value, Volume* & Price*)

Note*: In applicable scenarios
Step 3 - Data Sources
Primary Research
- Web Analytics
- Survey Reports
- Research Institute
- Latest Research Reports
- Opinion Leaders
Secondary Research
- Annual Reports
- White Paper
- Latest Press Release
- Industry Association
- Paid Database
- Investor Presentations

Step 4 - Data Triangulation
Involves using different sources of information in order to increase the validity of a study
These sources are likely to be stakeholders in a program - participants, other researchers, program staff, other community members, and so on.
Then we put all data in single framework & apply various statistical tools to find out the dynamic on the market.
During the analysis stage, feedback from the stakeholder groups would be compared to determine areas of agreement as well as areas of divergence
