

Key Insights
The global Portable Ultrasonic Testing (PUT) Equipment market is poised for significant expansion, projected to grow from an estimated USD 0.87 billion in the base year 2025 to an impressive figure by 2033, driven by a robust Compound Annual Growth Rate (CAGR) of 8.79%. This growth is fueled by the increasing demand for non-destructive testing (NDT) solutions across a multitude of industries, prioritizing safety, quality assurance, and cost-efficiency. The indispensable role of PUT equipment in detecting internal flaws, measuring material thickness, and ensuring structural integrity in critical sectors like aerospace, automotive, and energy is a primary catalyst. Advancements in technology, leading to more portable, user-friendly, and sophisticated devices with enhanced data acquisition and analysis capabilities, are further stimulating market adoption. Automation is also a key trend, with the development of automated ultrasonic testing equipment catering to high-volume inspection needs and reducing human error.
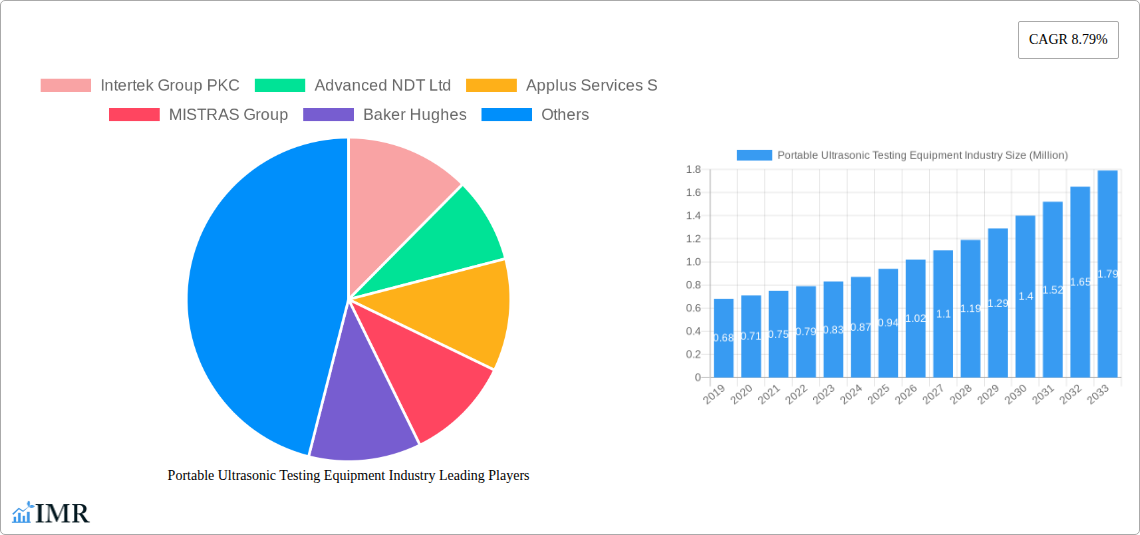
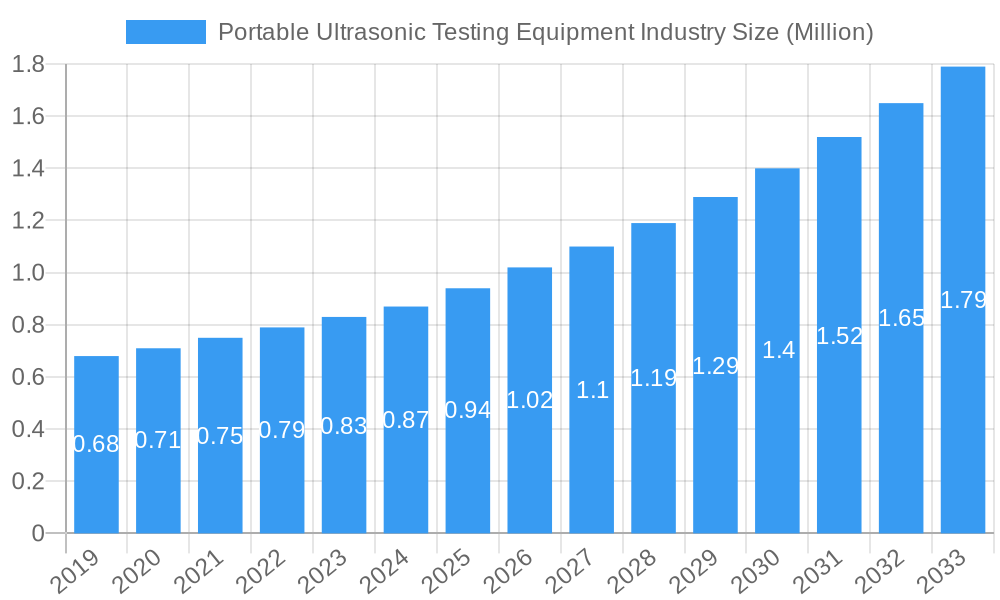
Portable Ultrasonic Testing Equipment Industry Market Size (In Million)
The market dynamics are further shaped by key industry drivers such as stringent regulatory compliance mandates for safety and quality across all sectors, the continuous pursuit of operational efficiency and reduced downtime in manufacturing and maintenance operations, and the growing adoption of advanced NDT techniques in emerging economies. However, certain restraints, including the high initial cost of advanced equipment and the need for skilled technicians for operation and interpretation, might temper growth in specific segments. The market is segmented by product type, encompassing manual, automated, and handheld ultrasonic testing equipment, each catering to distinct application needs. Key application areas include aerospace, manufacturing, automotive, energy, and construction, all of which rely heavily on reliable inspection methods. Geographically, North America and Europe are expected to maintain significant market shares due to established industrial bases and early adoption of advanced technologies, while the Asia Pacific region is anticipated to witness the fastest growth, driven by rapid industrialization and increasing investments in infrastructure and manufacturing.
Portable Ultrasonic Testing Equipment Industry Company Market Share
Portable Ultrasonic Testing Equipment Industry Report: Market Analysis & Forecast 2019–2033
This comprehensive report delivers an in-depth analysis of the global Portable Ultrasonic Testing (PUT) Equipment industry, providing critical insights into market dynamics, growth trends, and future outlook. Covering the period from 2019 to 2033, with a base year of 2025, this report is an indispensable resource for stakeholders seeking to understand market concentration, technological advancements, regulatory landscapes, and competitive strategies. We examine key segments including Manual Ultrasonic Testing Equipment, Automated Ultrasonic Testing Equipment, and Handheld Ultrasonic Testing Equipment, alongside critical applications in Aerospace, Manufacturing, Automotive, Energy, and Construction.
Portable Ultrasonic Testing Equipment Industry Market Dynamics & Structure
The Portable Ultrasonic Testing Equipment market exhibits a moderately concentrated structure, characterized by the presence of established global players and emerging regional manufacturers. Technological innovation remains a paramount driver, with continuous advancements in sensor technology, data processing capabilities, and wireless connectivity enhancing the accuracy, speed, and portability of PUT devices. Regulatory frameworks, particularly in safety-critical sectors like aerospace and energy, mandate stringent testing protocols, thereby influencing equipment specifications and adoption rates. Competitive product substitutes, such as eddy current testing and radiographic testing, present ongoing challenges, though the inherent advantages of ultrasonic testing—non-destructive nature, versatility, and cost-effectiveness—maintain its strong market position. End-user demographics span a wide spectrum, from large industrial corporations to smaller inspection service providers, each with evolving demands for user-friendliness and advanced analytics. Mergers and acquisitions (M&A) activity, while not excessively high, serves as a strategic tool for market consolidation and technology integration, with recent deal volumes hovering around 5-7 annually in the broader NDT equipment space.
- Market Concentration: Moderate, with leading players holding significant market share but ample room for niche competitors.
- Technological Innovation Drivers: Miniaturization, improved signal-to-noise ratio, advanced phased array technology, artificial intelligence integration for data analysis.
- Regulatory Frameworks: ISO, ASTM, ASME standards driving demand for calibrated and certified PUT equipment.
- Competitive Product Substitutes: Eddy Current Testing (ECT), Radiography Testing (RT), Magnetic Particle Testing (MPT), Liquid Penetrant Testing (LPT).
- End-User Demographics: Varied from large oil & gas companies to automotive manufacturers and aerospace MRO facilities.
- M&A Trends: Strategic acquisitions for technology enhancement and market expansion.
Portable Ultrasonic Testing Equipment Industry Growth Trends & Insights
The Portable Ultrasonic Testing Equipment market is poised for robust growth, projected to expand at a Compound Annual Growth Rate (CAGR) of approximately 6.5% during the forecast period (2025–2033). This expansion is underpinned by a confluence of factors, including the increasing demand for non-destructive testing (NDT) solutions across various industries to ensure product integrity and safety, coupled with the growing need for proactive maintenance to prevent catastrophic failures. The global market size for portable ultrasonic testing equipment was valued at an estimated $2,150.5 Million units in 2025. This growth is further fueled by rapid technological advancements that are making PUT equipment more sophisticated, user-friendly, and cost-effective. For instance, the integration of artificial intelligence (AI) and machine learning (ML) algorithms is transforming data analysis, enabling faster defect detection and more accurate assessments. The adoption of phased array ultrasonic testing (PAUT) and total focusing method (TFM) technologies is also on the rise, offering enhanced imaging capabilities and improved inspection efficiency for complex geometries.
Consumer behavior is shifting towards a preference for portable, wireless, and cloud-connected devices that offer real-time data sharing and remote monitoring capabilities. This trend is particularly evident in industries like oil and gas, where inspections often need to be conducted in remote or hazardous environments. Furthermore, increasing investments in infrastructure development, the burgeoning aerospace sector, and the evolving automotive industry, especially the transition to electric vehicles (EVs) with their unique material and component requirements, are creating substantial demand for advanced PUT solutions. The market penetration of advanced PUT devices is steadily increasing as industries recognize the long-term cost savings associated with early defect detection and preventative maintenance, mitigating the risk of costly repairs, downtime, and safety hazards. The overall market evolution is characterized by a progressive move from basic ultrasonic flaw detectors to highly sophisticated imaging systems capable of performing complex inspections with unparalleled precision.
Dominant Regions, Countries, or Segments in Portable Ultrasonic Testing Equipment Industry
The Energy sector emerges as the dominant application segment driving growth in the global Portable Ultrasonic Testing Equipment industry. This dominance is intrinsically linked to the critical need for rigorous inspection and integrity management of vast energy infrastructure, including oil and gas exploration and production facilities, refineries, pipelines, power generation plants (both conventional and renewable), and transmission networks. The inherent risks associated with these operations, coupled with stringent regulatory requirements for safety and environmental protection, necessitate continuous and reliable NDT methods. Portable ultrasonic testing equipment plays a pivotal role in inspecting welds, pressure vessels, storage tanks, and pipelines for defects such as corrosion, cracking, and laminations, thereby preventing leaks, explosions, and costly operational disruptions. The market size for the energy segment was estimated at $750.8 Million units in 2025.
The Asia-Pacific region, particularly countries like China and India, stands out as a rapidly growing geographical market due to significant investments in energy infrastructure development and a burgeoning manufacturing base. North America, with its mature oil and gas industry and stringent safety standards, also represents a substantial market. The Automated Ultrasonic Testing Equipment product type is experiencing particularly strong traction within the energy sector, driven by the need for higher inspection speeds and reduced human error in large-scale projects.
Dominant Application Segment: Energy (Oil & Gas, Power Generation, Renewables)
- Key Drivers: Critical infrastructure integrity, stringent safety regulations, preventative maintenance needs, harsh operating environments.
- Market Share (Energy Segment): Approximately 35% of the total market in 2025.
- Growth Potential: High, driven by aging infrastructure requiring regular inspection and new renewable energy projects.
Emerging Application Segment: Aerospace
- Key Drivers: Strict airworthiness standards, lightweight composite materials requiring advanced inspection techniques.
- Market Share (Aerospace Segment): Approximately 20% of the total market in 2025.
- Growth Potential: Significant, fueled by commercial aviation expansion and defense sector demands.
Dominant Product Type: Automated Ultrasonic Testing Equipment
- Key Drivers: Increased efficiency, improved accuracy, reduced labor costs, data logging and reporting capabilities.
- Market Share (Automated Segment): Approximately 45% of the total PUT equipment market in 2025.
- Growth Potential: Very high, driven by adoption in large-scale manufacturing and infrastructure projects.
Portable Ultrasonic Testing Equipment Industry Product Landscape
The product landscape of the Portable Ultrasonic Testing Equipment industry is characterized by continuous innovation focused on enhanced portability, data intelligence, and user-centric design. Manufacturers are actively developing advanced devices that integrate high-resolution imaging capabilities, such as phased array and total focusing method (TFM) technologies, enabling more precise detection and characterization of defects in complex geometries. Wireless connectivity and cloud-based data management solutions are becoming standard features, facilitating seamless data transfer, remote collaboration, and real-time reporting for improved operational efficiency. The integration of AI and machine learning algorithms is further elevating product performance by automating data analysis, reducing interpretation time, and improving defect classification accuracy. These technological advancements are crucial for applications across aerospace, manufacturing, automotive, energy, and construction, where ensuring structural integrity and compliance with stringent safety standards is paramount.
Key Drivers, Barriers & Challenges in Portable Ultrasonic Testing Equipment Industry
Key Drivers:
- Increasing demand for non-destructive testing (NDT) across safety-critical industries: The imperative to ensure structural integrity and prevent failures in sectors like aerospace, energy, and automotive is a primary growth catalyst.
- Technological advancements: Miniaturization, improved sensor technology, advanced imaging techniques (PAUT, TFM), and data analytics capabilities are enhancing equipment performance and adoption.
- Stricter regulatory compliance and safety standards: Mandates for thorough inspection drive the need for reliable and traceable NDT solutions.
- Growing emphasis on predictive maintenance: Early detection of defects through PUT reduces downtime and costly repairs.
- Expansion of infrastructure projects globally: New construction and maintenance of existing infrastructure in energy, transportation, and manufacturing sectors create sustained demand.
Key Barriers & Challenges:
- High initial cost of advanced PUT equipment: Sophisticated devices can represent a significant capital investment, particularly for small and medium-sized enterprises (SMEs).
- Need for skilled operators and interpretation expertise: Effective use of advanced PUT equipment requires trained personnel, and a shortage of skilled technicians can be a constraint.
- Competition from alternative NDT methods: While PUT has advantages, other NDT techniques can be suitable for specific applications, leading to market competition.
- Economic downturns and project cancellations: Global economic uncertainties can impact investment in capital equipment, including PUT devices.
- Supply chain disruptions and raw material availability: Geopolitical factors and logistical challenges can affect production and pricing.
Emerging Opportunities in Portable Ultrasonic Testing Equipment Industry
Emerging opportunities within the Portable Ultrasonic Testing Equipment industry lie in the continued advancement and application of digital technologies and specialized inspection needs. The growing adoption of Industry 4.0 principles is creating a demand for smart, connected PUT devices capable of seamless integration into digital factory environments and asset management systems. This includes opportunities for developing AI-powered diagnostic tools that can autonomously identify and report defects, significantly reducing inspection times and enhancing accuracy. Furthermore, the increasing use of composite materials in aerospace and automotive manufacturing presents a niche but growing market for PUT equipment specifically designed to inspect these advanced materials. Opportunities also exist in developing more affordable and user-friendly PUT solutions for emerging economies and smaller enterprises to broaden market penetration. The expanding renewable energy sector, particularly offshore wind farms and solar panel arrays, requires specialized inspection and maintenance, opening new avenues for PUT equipment providers.
Growth Accelerators in the Portable Ultrasonic Testing Equipment Industry Industry
Several key catalysts are accelerating the growth of the Portable Ultrasonic Testing Equipment industry. The relentless pursuit of enhanced safety and reliability across all major industrial sectors serves as a fundamental driver. Continuous technological breakthroughs, particularly in sensor sensitivity, signal processing, and data analytics, are making PUT equipment more powerful and versatile. Strategic partnerships between PUT manufacturers and end-users, as well as collaborations with research institutions, are fostering innovation and the development of application-specific solutions. Market expansion strategies, including targeting underdeveloped regions and niche applications, are also contributing to growth. Furthermore, government initiatives promoting industrial safety standards and the adoption of advanced manufacturing technologies indirectly boost the demand for sophisticated NDT equipment. The trend towards digitalization and the integration of IoT capabilities within PUT devices are also significant growth accelerators, enabling remote monitoring and predictive maintenance.
Key Players Shaping the Portable Ultrasonic Testing Equipment Industry Market
- Intertek Group Plc
- Advanced NDT Ltd
- Applus Services SA
- MISTRAS Group
- Baker Hughes
- Russell Fraser Sales Pty Ltd
- OkoNDT group
- ROSEN Group
- Bureau Veritas SA
- Johnson and Allen Ltd
- Olympus Corporation
Notable Milestones in Portable Ultrasonic Testing Equipment Industry Sector
- July 2022: Applus+ awarded a major contract to execute non-destructive testing on critical maritime assets. This two-year project entails the execution of radiographic and ultrasonic testing on diverse maritime assets, including watercraft.
- Ongoing: Continuous development and integration of phased array ultrasonic testing (PAUT) and total focusing method (TFM) technologies into portable devices, enhancing imaging resolution and defect characterization.
- 2023 onwards: Increased focus on AI and machine learning integration in PUT software for automated data analysis and defect recognition, leading to faster and more accurate inspections.
- 2024: Introduction of more wireless and cloud-connected PUT devices, facilitating real-time data sharing and remote collaboration in inspection workflows.
In-Depth Portable Ultrasonic Testing Equipment Industry Market Outlook
The future outlook for the Portable Ultrasonic Testing Equipment industry is exceptionally promising, driven by sustained demand from key sectors and rapid technological evolution. Growth accelerators, including the increasing emphasis on predictive maintenance, the adoption of digital technologies like AI and IoT, and the expansion of infrastructure projects globally, will continue to fuel market expansion. The ongoing development of more sophisticated and user-friendly PUT equipment, capable of inspecting advanced materials and complex geometries with greater precision, will further enhance its market penetration. Emerging opportunities in sectors like renewable energy and advanced manufacturing will provide new avenues for growth. Strategic collaborations and a focus on developing cost-effective solutions for a broader market segment will be crucial for maximizing future market potential and capitalizing on evolving industry needs.
Portable Ultrasonic Testing Equipment Industry Segmentation
-
1. Product Type
- 1.1. Manual Ultrasonic Testing Equipment
- 1.2. Automated Ultrasonic Testing Equipment
- 1.3. Handheld Ultrasonic Testing Equipment
-
2. Application
- 2.1. Aerospace
- 2.2. Manufacturing
- 2.3. Automotive
- 2.4. Energy
- 2.5. Construction
Portable Ultrasonic Testing Equipment Industry Segmentation By Geography
-
1. North America
- 1.1. United States
- 1.2. Canada
-
2. Europe
- 2.1. Germany
- 2.2. United Kingdom
- 2.3. France
- 2.4. Spain
- 2.5. Rest of Europe
-
3. Asia Pacific
- 3.1. China
- 3.2. Japan
- 3.3. India
- 3.4. South Korea
- 3.5. Rest of Asia Pacific
-
4. Latin America
- 4.1. Brazil
- 4.2. Argentina
- 4.3. Rest of Latin America
-
5. Middle East and Africa
- 5.1. United Arab Emirates
- 5.2. Saudi Arabia
- 5.3. Rest of Middle East and Africa
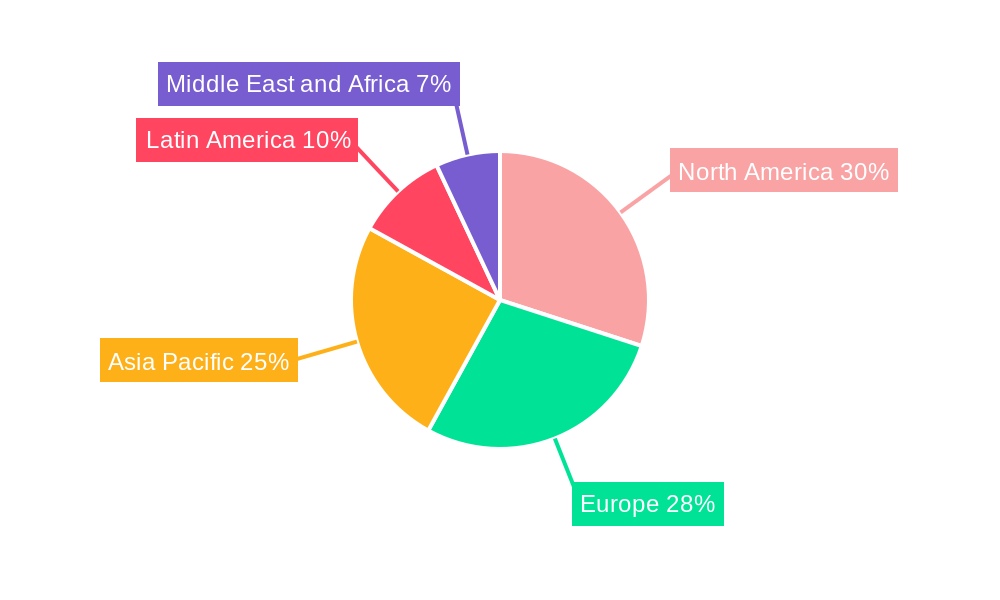
Portable Ultrasonic Testing Equipment Industry Regional Market Share
Geographic Coverage of Portable Ultrasonic Testing Equipment Industry
Portable Ultrasonic Testing Equipment Industry REPORT HIGHLIGHTS
| Aspects | Details |
|---|---|
| Study Period | 2020-2034 |
| Base Year | 2025 |
| Estimated Year | 2026 |
| Forecast Period | 2026-2034 |
| Historical Period | 2020-2025 |
| Growth Rate | CAGR of 8.79% from 2020-2034 |
| Segmentation |
|
Table of Contents
- 1. Introduction
- 1.1. Research Scope
- 1.2. Market Segmentation
- 1.3. Research Objective
- 1.4. Definitions and Assumptions
- 2. Executive Summary
- 2.1. Market Snapshot
- 3. Market Dynamics
- 3.1. Market Drivers
- 3.2. Market Restrains
- 3.3. Market Trends
- 3.4. Market Opportunities
- 4. Market Factor Analysis
- 4.1. Porters Five Forces
- 4.1.1. Bargaining Power of Suppliers
- 4.1.2. Bargaining Power of Buyers
- 4.1.3. Threat of New Entrants
- 4.1.4. Threat of Substitutes
- 4.1.5. Competitive Rivalry
- 4.2. PESTEL analysis
- 4.3. BCG Analysis
- 4.3.1. Stars (High Growth, High Market Share)
- 4.3.2. Cash Cows (Low Growth, High Market Share)
- 4.3.3. Question Mark (High Growth, Low Market Share)
- 4.3.4. Dogs (Low Growth, Low Market Share)
- 4.4. Ansoff Matrix Analysis
- 4.5. Supply Chain Analysis
- 4.6. Regulatory Landscape
- 4.7. Current Market Potential and Opportunity Assessment (TAM–SAM–SOM Framework)
- 4.8. IMR Analyst Note
- 4.1. Porters Five Forces
- 5. Market Analysis, Insights and Forecast 2021-2033
- 5.1. Market Analysis, Insights and Forecast - by Product Type
- 5.1.1. Manual Ultrasonic Testing Equipment
- 5.1.2. Automated Ultrasonic Testing Equipment
- 5.1.3. Handheld Ultrasonic Testing Equipment
- 5.2. Market Analysis, Insights and Forecast - by Application
- 5.2.1. Aerospace
- 5.2.2. Manufacturing
- 5.2.3. Automotive
- 5.2.4. Energy
- 5.2.5. Construction
- 5.3. Market Analysis, Insights and Forecast - by Region
- 5.3.1. North America
- 5.3.2. Europe
- 5.3.3. Asia Pacific
- 5.3.4. Latin America
- 5.3.5. Middle East and Africa
- 5.1. Market Analysis, Insights and Forecast - by Product Type
- 6. Global Portable Ultrasonic Testing Equipment Industry Analysis, Insights and Forecast, 2021-2033
- 6.1. Market Analysis, Insights and Forecast - by Product Type
- 6.1.1. Manual Ultrasonic Testing Equipment
- 6.1.2. Automated Ultrasonic Testing Equipment
- 6.1.3. Handheld Ultrasonic Testing Equipment
- 6.2. Market Analysis, Insights and Forecast - by Application
- 6.2.1. Aerospace
- 6.2.2. Manufacturing
- 6.2.3. Automotive
- 6.2.4. Energy
- 6.2.5. Construction
- 6.1. Market Analysis, Insights and Forecast - by Product Type
- 7. North America Portable Ultrasonic Testing Equipment Industry Analysis, Insights and Forecast, 2020-2032
- 7.1. Market Analysis, Insights and Forecast - by Product Type
- 7.1.1. Manual Ultrasonic Testing Equipment
- 7.1.2. Automated Ultrasonic Testing Equipment
- 7.1.3. Handheld Ultrasonic Testing Equipment
- 7.2. Market Analysis, Insights and Forecast - by Application
- 7.2.1. Aerospace
- 7.2.2. Manufacturing
- 7.2.3. Automotive
- 7.2.4. Energy
- 7.2.5. Construction
- 7.1. Market Analysis, Insights and Forecast - by Product Type
- 8. Europe Portable Ultrasonic Testing Equipment Industry Analysis, Insights and Forecast, 2020-2032
- 8.1. Market Analysis, Insights and Forecast - by Product Type
- 8.1.1. Manual Ultrasonic Testing Equipment
- 8.1.2. Automated Ultrasonic Testing Equipment
- 8.1.3. Handheld Ultrasonic Testing Equipment
- 8.2. Market Analysis, Insights and Forecast - by Application
- 8.2.1. Aerospace
- 8.2.2. Manufacturing
- 8.2.3. Automotive
- 8.2.4. Energy
- 8.2.5. Construction
- 8.1. Market Analysis, Insights and Forecast - by Product Type
- 9. Asia Pacific Portable Ultrasonic Testing Equipment Industry Analysis, Insights and Forecast, 2020-2032
- 9.1. Market Analysis, Insights and Forecast - by Product Type
- 9.1.1. Manual Ultrasonic Testing Equipment
- 9.1.2. Automated Ultrasonic Testing Equipment
- 9.1.3. Handheld Ultrasonic Testing Equipment
- 9.2. Market Analysis, Insights and Forecast - by Application
- 9.2.1. Aerospace
- 9.2.2. Manufacturing
- 9.2.3. Automotive
- 9.2.4. Energy
- 9.2.5. Construction
- 9.1. Market Analysis, Insights and Forecast - by Product Type
- 10. Latin America Portable Ultrasonic Testing Equipment Industry Analysis, Insights and Forecast, 2020-2032
- 10.1. Market Analysis, Insights and Forecast - by Product Type
- 10.1.1. Manual Ultrasonic Testing Equipment
- 10.1.2. Automated Ultrasonic Testing Equipment
- 10.1.3. Handheld Ultrasonic Testing Equipment
- 10.2. Market Analysis, Insights and Forecast - by Application
- 10.2.1. Aerospace
- 10.2.2. Manufacturing
- 10.2.3. Automotive
- 10.2.4. Energy
- 10.2.5. Construction
- 10.1. Market Analysis, Insights and Forecast - by Product Type
- 11. Middle East and Africa Portable Ultrasonic Testing Equipment Industry Analysis, Insights and Forecast, 2020-2032
- 11.1. Market Analysis, Insights and Forecast - by Product Type
- 11.1.1. Manual Ultrasonic Testing Equipment
- 11.1.2. Automated Ultrasonic Testing Equipment
- 11.1.3. Handheld Ultrasonic Testing Equipment
- 11.2. Market Analysis, Insights and Forecast - by Application
- 11.2.1. Aerospace
- 11.2.2. Manufacturing
- 11.2.3. Automotive
- 11.2.4. Energy
- 11.2.5. Construction
- 11.1. Market Analysis, Insights and Forecast - by Product Type
- 12. Competitive Analysis
- 12.1. Company Profiles
- 12.1.1 Intertek Group PKC
- 12.1.1.1. Company Overview
- 12.1.1.2. Products
- 12.1.1.3. Company Financials
- 12.1.1.4. SWOT Analysis
- 12.1.2 Advanced NDT Ltd
- 12.1.2.1. Company Overview
- 12.1.2.2. Products
- 12.1.2.3. Company Financials
- 12.1.2.4. SWOT Analysis
- 12.1.3 Applus Services S
- 12.1.3.1. Company Overview
- 12.1.3.2. Products
- 12.1.3.3. Company Financials
- 12.1.3.4. SWOT Analysis
- 12.1.4 MISTRAS Group
- 12.1.4.1. Company Overview
- 12.1.4.2. Products
- 12.1.4.3. Company Financials
- 12.1.4.4. SWOT Analysis
- 12.1.5 Baker Hughes
- 12.1.5.1. Company Overview
- 12.1.5.2. Products
- 12.1.5.3. Company Financials
- 12.1.5.4. SWOT Analysis
- 12.1.6 Russell Fraser Sales Pty Ltd
- 12.1.6.1. Company Overview
- 12.1.6.2. Products
- 12.1.6.3. Company Financials
- 12.1.6.4. SWOT Analysis
- 12.1.7 OkoNDT group
- 12.1.7.1. Company Overview
- 12.1.7.2. Products
- 12.1.7.3. Company Financials
- 12.1.7.4. SWOT Analysis
- 12.1.8 ROSEN Group
- 12.1.8.1. Company Overview
- 12.1.8.2. Products
- 12.1.8.3. Company Financials
- 12.1.8.4. SWOT Analysis
- 12.1.9 Bureau Veritas SA
- 12.1.9.1. Company Overview
- 12.1.9.2. Products
- 12.1.9.3. Company Financials
- 12.1.9.4. SWOT Analysis
- 12.1.10 Johnson and Allen Ltd
- 12.1.10.1. Company Overview
- 12.1.10.2. Products
- 12.1.10.3. Company Financials
- 12.1.10.4. SWOT Analysis
- 12.1.11 Olympus Corporation
- 12.1.11.1. Company Overview
- 12.1.11.2. Products
- 12.1.11.3. Company Financials
- 12.1.11.4. SWOT Analysis
- 12.1.1 Intertek Group PKC
- 12.2. Market Entropy
- 12.2.1 Company's Key Areas Served
- 12.2.2 Recent Developments
- 12.3. Company Market Share Analysis 2025
- 12.3.1 Top 5 Companies Market Share Analysis
- 12.3.2 Top 3 Companies Market Share Analysis
- 12.4. List of Potential Customers
- 13. Research Methodology
List of Figures
- Figure 1: Global Portable Ultrasonic Testing Equipment Industry Revenue Breakdown (Million, %) by Region 2025 & 2033
- Figure 2: Global Portable Ultrasonic Testing Equipment Industry Volume Breakdown (K Unit, %) by Region 2025 & 2033
- Figure 3: North America Portable Ultrasonic Testing Equipment Industry Revenue (Million), by Product Type 2025 & 2033
- Figure 4: North America Portable Ultrasonic Testing Equipment Industry Volume (K Unit), by Product Type 2025 & 2033
- Figure 5: North America Portable Ultrasonic Testing Equipment Industry Revenue Share (%), by Product Type 2025 & 2033
- Figure 6: North America Portable Ultrasonic Testing Equipment Industry Volume Share (%), by Product Type 2025 & 2033
- Figure 7: North America Portable Ultrasonic Testing Equipment Industry Revenue (Million), by Application 2025 & 2033
- Figure 8: North America Portable Ultrasonic Testing Equipment Industry Volume (K Unit), by Application 2025 & 2033
- Figure 9: North America Portable Ultrasonic Testing Equipment Industry Revenue Share (%), by Application 2025 & 2033
- Figure 10: North America Portable Ultrasonic Testing Equipment Industry Volume Share (%), by Application 2025 & 2033
- Figure 11: North America Portable Ultrasonic Testing Equipment Industry Revenue (Million), by Country 2025 & 2033
- Figure 12: North America Portable Ultrasonic Testing Equipment Industry Volume (K Unit), by Country 2025 & 2033
- Figure 13: North America Portable Ultrasonic Testing Equipment Industry Revenue Share (%), by Country 2025 & 2033
- Figure 14: North America Portable Ultrasonic Testing Equipment Industry Volume Share (%), by Country 2025 & 2033
- Figure 15: Europe Portable Ultrasonic Testing Equipment Industry Revenue (Million), by Product Type 2025 & 2033
- Figure 16: Europe Portable Ultrasonic Testing Equipment Industry Volume (K Unit), by Product Type 2025 & 2033
- Figure 17: Europe Portable Ultrasonic Testing Equipment Industry Revenue Share (%), by Product Type 2025 & 2033
- Figure 18: Europe Portable Ultrasonic Testing Equipment Industry Volume Share (%), by Product Type 2025 & 2033
- Figure 19: Europe Portable Ultrasonic Testing Equipment Industry Revenue (Million), by Application 2025 & 2033
- Figure 20: Europe Portable Ultrasonic Testing Equipment Industry Volume (K Unit), by Application 2025 & 2033
- Figure 21: Europe Portable Ultrasonic Testing Equipment Industry Revenue Share (%), by Application 2025 & 2033
- Figure 22: Europe Portable Ultrasonic Testing Equipment Industry Volume Share (%), by Application 2025 & 2033
- Figure 23: Europe Portable Ultrasonic Testing Equipment Industry Revenue (Million), by Country 2025 & 2033
- Figure 24: Europe Portable Ultrasonic Testing Equipment Industry Volume (K Unit), by Country 2025 & 2033
- Figure 25: Europe Portable Ultrasonic Testing Equipment Industry Revenue Share (%), by Country 2025 & 2033
- Figure 26: Europe Portable Ultrasonic Testing Equipment Industry Volume Share (%), by Country 2025 & 2033
- Figure 27: Asia Pacific Portable Ultrasonic Testing Equipment Industry Revenue (Million), by Product Type 2025 & 2033
- Figure 28: Asia Pacific Portable Ultrasonic Testing Equipment Industry Volume (K Unit), by Product Type 2025 & 2033
- Figure 29: Asia Pacific Portable Ultrasonic Testing Equipment Industry Revenue Share (%), by Product Type 2025 & 2033
- Figure 30: Asia Pacific Portable Ultrasonic Testing Equipment Industry Volume Share (%), by Product Type 2025 & 2033
- Figure 31: Asia Pacific Portable Ultrasonic Testing Equipment Industry Revenue (Million), by Application 2025 & 2033
- Figure 32: Asia Pacific Portable Ultrasonic Testing Equipment Industry Volume (K Unit), by Application 2025 & 2033
- Figure 33: Asia Pacific Portable Ultrasonic Testing Equipment Industry Revenue Share (%), by Application 2025 & 2033
- Figure 34: Asia Pacific Portable Ultrasonic Testing Equipment Industry Volume Share (%), by Application 2025 & 2033
- Figure 35: Asia Pacific Portable Ultrasonic Testing Equipment Industry Revenue (Million), by Country 2025 & 2033
- Figure 36: Asia Pacific Portable Ultrasonic Testing Equipment Industry Volume (K Unit), by Country 2025 & 2033
- Figure 37: Asia Pacific Portable Ultrasonic Testing Equipment Industry Revenue Share (%), by Country 2025 & 2033
- Figure 38: Asia Pacific Portable Ultrasonic Testing Equipment Industry Volume Share (%), by Country 2025 & 2033
- Figure 39: Latin America Portable Ultrasonic Testing Equipment Industry Revenue (Million), by Product Type 2025 & 2033
- Figure 40: Latin America Portable Ultrasonic Testing Equipment Industry Volume (K Unit), by Product Type 2025 & 2033
- Figure 41: Latin America Portable Ultrasonic Testing Equipment Industry Revenue Share (%), by Product Type 2025 & 2033
- Figure 42: Latin America Portable Ultrasonic Testing Equipment Industry Volume Share (%), by Product Type 2025 & 2033
- Figure 43: Latin America Portable Ultrasonic Testing Equipment Industry Revenue (Million), by Application 2025 & 2033
- Figure 44: Latin America Portable Ultrasonic Testing Equipment Industry Volume (K Unit), by Application 2025 & 2033
- Figure 45: Latin America Portable Ultrasonic Testing Equipment Industry Revenue Share (%), by Application 2025 & 2033
- Figure 46: Latin America Portable Ultrasonic Testing Equipment Industry Volume Share (%), by Application 2025 & 2033
- Figure 47: Latin America Portable Ultrasonic Testing Equipment Industry Revenue (Million), by Country 2025 & 2033
- Figure 48: Latin America Portable Ultrasonic Testing Equipment Industry Volume (K Unit), by Country 2025 & 2033
- Figure 49: Latin America Portable Ultrasonic Testing Equipment Industry Revenue Share (%), by Country 2025 & 2033
- Figure 50: Latin America Portable Ultrasonic Testing Equipment Industry Volume Share (%), by Country 2025 & 2033
- Figure 51: Middle East and Africa Portable Ultrasonic Testing Equipment Industry Revenue (Million), by Product Type 2025 & 2033
- Figure 52: Middle East and Africa Portable Ultrasonic Testing Equipment Industry Volume (K Unit), by Product Type 2025 & 2033
- Figure 53: Middle East and Africa Portable Ultrasonic Testing Equipment Industry Revenue Share (%), by Product Type 2025 & 2033
- Figure 54: Middle East and Africa Portable Ultrasonic Testing Equipment Industry Volume Share (%), by Product Type 2025 & 2033
- Figure 55: Middle East and Africa Portable Ultrasonic Testing Equipment Industry Revenue (Million), by Application 2025 & 2033
- Figure 56: Middle East and Africa Portable Ultrasonic Testing Equipment Industry Volume (K Unit), by Application 2025 & 2033
- Figure 57: Middle East and Africa Portable Ultrasonic Testing Equipment Industry Revenue Share (%), by Application 2025 & 2033
- Figure 58: Middle East and Africa Portable Ultrasonic Testing Equipment Industry Volume Share (%), by Application 2025 & 2033
- Figure 59: Middle East and Africa Portable Ultrasonic Testing Equipment Industry Revenue (Million), by Country 2025 & 2033
- Figure 60: Middle East and Africa Portable Ultrasonic Testing Equipment Industry Volume (K Unit), by Country 2025 & 2033
- Figure 61: Middle East and Africa Portable Ultrasonic Testing Equipment Industry Revenue Share (%), by Country 2025 & 2033
- Figure 62: Middle East and Africa Portable Ultrasonic Testing Equipment Industry Volume Share (%), by Country 2025 & 2033
List of Tables
- Table 1: Global Portable Ultrasonic Testing Equipment Industry Revenue Million Forecast, by Product Type 2020 & 2033
- Table 2: Global Portable Ultrasonic Testing Equipment Industry Volume K Unit Forecast, by Product Type 2020 & 2033
- Table 3: Global Portable Ultrasonic Testing Equipment Industry Revenue Million Forecast, by Application 2020 & 2033
- Table 4: Global Portable Ultrasonic Testing Equipment Industry Volume K Unit Forecast, by Application 2020 & 2033
- Table 5: Global Portable Ultrasonic Testing Equipment Industry Revenue Million Forecast, by Region 2020 & 2033
- Table 6: Global Portable Ultrasonic Testing Equipment Industry Volume K Unit Forecast, by Region 2020 & 2033
- Table 7: Global Portable Ultrasonic Testing Equipment Industry Revenue Million Forecast, by Product Type 2020 & 2033
- Table 8: Global Portable Ultrasonic Testing Equipment Industry Volume K Unit Forecast, by Product Type 2020 & 2033
- Table 9: Global Portable Ultrasonic Testing Equipment Industry Revenue Million Forecast, by Application 2020 & 2033
- Table 10: Global Portable Ultrasonic Testing Equipment Industry Volume K Unit Forecast, by Application 2020 & 2033
- Table 11: Global Portable Ultrasonic Testing Equipment Industry Revenue Million Forecast, by Country 2020 & 2033
- Table 12: Global Portable Ultrasonic Testing Equipment Industry Volume K Unit Forecast, by Country 2020 & 2033
- Table 13: United States Portable Ultrasonic Testing Equipment Industry Revenue (Million) Forecast, by Application 2020 & 2033
- Table 14: United States Portable Ultrasonic Testing Equipment Industry Volume (K Unit) Forecast, by Application 2020 & 2033
- Table 15: Canada Portable Ultrasonic Testing Equipment Industry Revenue (Million) Forecast, by Application 2020 & 2033
- Table 16: Canada Portable Ultrasonic Testing Equipment Industry Volume (K Unit) Forecast, by Application 2020 & 2033
- Table 17: Global Portable Ultrasonic Testing Equipment Industry Revenue Million Forecast, by Product Type 2020 & 2033
- Table 18: Global Portable Ultrasonic Testing Equipment Industry Volume K Unit Forecast, by Product Type 2020 & 2033
- Table 19: Global Portable Ultrasonic Testing Equipment Industry Revenue Million Forecast, by Application 2020 & 2033
- Table 20: Global Portable Ultrasonic Testing Equipment Industry Volume K Unit Forecast, by Application 2020 & 2033
- Table 21: Global Portable Ultrasonic Testing Equipment Industry Revenue Million Forecast, by Country 2020 & 2033
- Table 22: Global Portable Ultrasonic Testing Equipment Industry Volume K Unit Forecast, by Country 2020 & 2033
- Table 23: Germany Portable Ultrasonic Testing Equipment Industry Revenue (Million) Forecast, by Application 2020 & 2033
- Table 24: Germany Portable Ultrasonic Testing Equipment Industry Volume (K Unit) Forecast, by Application 2020 & 2033
- Table 25: United Kingdom Portable Ultrasonic Testing Equipment Industry Revenue (Million) Forecast, by Application 2020 & 2033
- Table 26: United Kingdom Portable Ultrasonic Testing Equipment Industry Volume (K Unit) Forecast, by Application 2020 & 2033
- Table 27: France Portable Ultrasonic Testing Equipment Industry Revenue (Million) Forecast, by Application 2020 & 2033
- Table 28: France Portable Ultrasonic Testing Equipment Industry Volume (K Unit) Forecast, by Application 2020 & 2033
- Table 29: Spain Portable Ultrasonic Testing Equipment Industry Revenue (Million) Forecast, by Application 2020 & 2033
- Table 30: Spain Portable Ultrasonic Testing Equipment Industry Volume (K Unit) Forecast, by Application 2020 & 2033
- Table 31: Rest of Europe Portable Ultrasonic Testing Equipment Industry Revenue (Million) Forecast, by Application 2020 & 2033
- Table 32: Rest of Europe Portable Ultrasonic Testing Equipment Industry Volume (K Unit) Forecast, by Application 2020 & 2033
- Table 33: Global Portable Ultrasonic Testing Equipment Industry Revenue Million Forecast, by Product Type 2020 & 2033
- Table 34: Global Portable Ultrasonic Testing Equipment Industry Volume K Unit Forecast, by Product Type 2020 & 2033
- Table 35: Global Portable Ultrasonic Testing Equipment Industry Revenue Million Forecast, by Application 2020 & 2033
- Table 36: Global Portable Ultrasonic Testing Equipment Industry Volume K Unit Forecast, by Application 2020 & 2033
- Table 37: Global Portable Ultrasonic Testing Equipment Industry Revenue Million Forecast, by Country 2020 & 2033
- Table 38: Global Portable Ultrasonic Testing Equipment Industry Volume K Unit Forecast, by Country 2020 & 2033
- Table 39: China Portable Ultrasonic Testing Equipment Industry Revenue (Million) Forecast, by Application 2020 & 2033
- Table 40: China Portable Ultrasonic Testing Equipment Industry Volume (K Unit) Forecast, by Application 2020 & 2033
- Table 41: Japan Portable Ultrasonic Testing Equipment Industry Revenue (Million) Forecast, by Application 2020 & 2033
- Table 42: Japan Portable Ultrasonic Testing Equipment Industry Volume (K Unit) Forecast, by Application 2020 & 2033
- Table 43: India Portable Ultrasonic Testing Equipment Industry Revenue (Million) Forecast, by Application 2020 & 2033
- Table 44: India Portable Ultrasonic Testing Equipment Industry Volume (K Unit) Forecast, by Application 2020 & 2033
- Table 45: South Korea Portable Ultrasonic Testing Equipment Industry Revenue (Million) Forecast, by Application 2020 & 2033
- Table 46: South Korea Portable Ultrasonic Testing Equipment Industry Volume (K Unit) Forecast, by Application 2020 & 2033
- Table 47: Rest of Asia Pacific Portable Ultrasonic Testing Equipment Industry Revenue (Million) Forecast, by Application 2020 & 2033
- Table 48: Rest of Asia Pacific Portable Ultrasonic Testing Equipment Industry Volume (K Unit) Forecast, by Application 2020 & 2033
- Table 49: Global Portable Ultrasonic Testing Equipment Industry Revenue Million Forecast, by Product Type 2020 & 2033
- Table 50: Global Portable Ultrasonic Testing Equipment Industry Volume K Unit Forecast, by Product Type 2020 & 2033
- Table 51: Global Portable Ultrasonic Testing Equipment Industry Revenue Million Forecast, by Application 2020 & 2033
- Table 52: Global Portable Ultrasonic Testing Equipment Industry Volume K Unit Forecast, by Application 2020 & 2033
- Table 53: Global Portable Ultrasonic Testing Equipment Industry Revenue Million Forecast, by Country 2020 & 2033
- Table 54: Global Portable Ultrasonic Testing Equipment Industry Volume K Unit Forecast, by Country 2020 & 2033
- Table 55: Brazil Portable Ultrasonic Testing Equipment Industry Revenue (Million) Forecast, by Application 2020 & 2033
- Table 56: Brazil Portable Ultrasonic Testing Equipment Industry Volume (K Unit) Forecast, by Application 2020 & 2033
- Table 57: Argentina Portable Ultrasonic Testing Equipment Industry Revenue (Million) Forecast, by Application 2020 & 2033
- Table 58: Argentina Portable Ultrasonic Testing Equipment Industry Volume (K Unit) Forecast, by Application 2020 & 2033
- Table 59: Rest of Latin America Portable Ultrasonic Testing Equipment Industry Revenue (Million) Forecast, by Application 2020 & 2033
- Table 60: Rest of Latin America Portable Ultrasonic Testing Equipment Industry Volume (K Unit) Forecast, by Application 2020 & 2033
- Table 61: Global Portable Ultrasonic Testing Equipment Industry Revenue Million Forecast, by Product Type 2020 & 2033
- Table 62: Global Portable Ultrasonic Testing Equipment Industry Volume K Unit Forecast, by Product Type 2020 & 2033
- Table 63: Global Portable Ultrasonic Testing Equipment Industry Revenue Million Forecast, by Application 2020 & 2033
- Table 64: Global Portable Ultrasonic Testing Equipment Industry Volume K Unit Forecast, by Application 2020 & 2033
- Table 65: Global Portable Ultrasonic Testing Equipment Industry Revenue Million Forecast, by Country 2020 & 2033
- Table 66: Global Portable Ultrasonic Testing Equipment Industry Volume K Unit Forecast, by Country 2020 & 2033
- Table 67: United Arab Emirates Portable Ultrasonic Testing Equipment Industry Revenue (Million) Forecast, by Application 2020 & 2033
- Table 68: United Arab Emirates Portable Ultrasonic Testing Equipment Industry Volume (K Unit) Forecast, by Application 2020 & 2033
- Table 69: Saudi Arabia Portable Ultrasonic Testing Equipment Industry Revenue (Million) Forecast, by Application 2020 & 2033
- Table 70: Saudi Arabia Portable Ultrasonic Testing Equipment Industry Volume (K Unit) Forecast, by Application 2020 & 2033
- Table 71: Rest of Middle East and Africa Portable Ultrasonic Testing Equipment Industry Revenue (Million) Forecast, by Application 2020 & 2033
- Table 72: Rest of Middle East and Africa Portable Ultrasonic Testing Equipment Industry Volume (K Unit) Forecast, by Application 2020 & 2033
Frequently Asked Questions
1. What is the projected Compound Annual Growth Rate (CAGR) of the Portable Ultrasonic Testing Equipment Industry?
The projected CAGR is approximately 8.79%.
2. Which companies are prominent players in the Portable Ultrasonic Testing Equipment Industry?
Key companies in the market include Intertek Group PKC, Advanced NDT Ltd, Applus Services S, MISTRAS Group, Baker Hughes, Russell Fraser Sales Pty Ltd, OkoNDT group, ROSEN Group, Bureau Veritas SA, Johnson and Allen Ltd, Olympus Corporation.
3. What are the main segments of the Portable Ultrasonic Testing Equipment Industry?
The market segments include Product Type , Application .
4. Can you provide details about the market size?
The market size is estimated to be USD 0.87 Million as of 2022.
5. What are some drivers contributing to market growth?
Increased Safety Regulation; More Emphasis Toward Continuous Monitoring to Prevent Sudden Failure; Availability of Portable and Connected Devices for Real-time Data.
6. What are the notable trends driving market growth?
Availability of Portable and Connected Devices for Real-time Data is Expected to Drive the Market's Growth.
7. Are there any restraints impacting market growth?
Lack of Skilled Labor Required to Implement and Carry Out Inspection Service.
8. Can you provide examples of recent developments in the market?
July 2022 - Applus+ was awarded a major contract to execute non-destructive testing on critical maritime assets. Applus+ provides a significant range of marine Non-destructive testing services like materials, corrosion monitoring and testing, and electrical safety and functionality testing. The two-year project entails the execution of radiographic and ultrasonic testing on diverse maritime assets, including watercraft.
9. What pricing options are available for accessing the report?
Pricing options include single-user, multi-user, and enterprise licenses priced at USD 4750, USD 5250, and USD 8750 respectively.
10. Is the market size provided in terms of value or volume?
The market size is provided in terms of value, measured in Million and volume, measured in K Unit.
11. Are there any specific market keywords associated with the report?
Yes, the market keyword associated with the report is "Portable Ultrasonic Testing Equipment Industry," which aids in identifying and referencing the specific market segment covered.
12. How do I determine which pricing option suits my needs best?
The pricing options vary based on user requirements and access needs. Individual users may opt for single-user licenses, while businesses requiring broader access may choose multi-user or enterprise licenses for cost-effective access to the report.
13. Are there any additional resources or data provided in the Portable Ultrasonic Testing Equipment Industry report?
While the report offers comprehensive insights, it's advisable to review the specific contents or supplementary materials provided to ascertain if additional resources or data are available.
14. How can I stay updated on further developments or reports in the Portable Ultrasonic Testing Equipment Industry?
To stay informed about further developments, trends, and reports in the Portable Ultrasonic Testing Equipment Industry, consider subscribing to industry newsletters, following relevant companies and organizations, or regularly checking reputable industry news sources and publications.
Methodology
Step 1 - Identification of Relevant Samples Size from Population Database


Step 2 - Approaches for Defining Global Market Size (Value, Volume* & Price*)

Note*: In applicable scenarios
Step 3 - Data Sources
Primary Research
- Web Analytics
- Survey Reports
- Research Institute
- Latest Research Reports
- Opinion Leaders
Secondary Research
- Annual Reports
- White Paper
- Latest Press Release
- Industry Association
- Paid Database
- Investor Presentations

Step 4 - Data Triangulation
Involves using different sources of information in order to increase the validity of a study
These sources are likely to be stakeholders in a program - participants, other researchers, program staff, other community members, and so on.
Then we put all data in single framework & apply various statistical tools to find out the dynamic on the market.
During the analysis stage, feedback from the stakeholder groups would be compared to determine areas of agreement as well as areas of divergence