

Key Insights
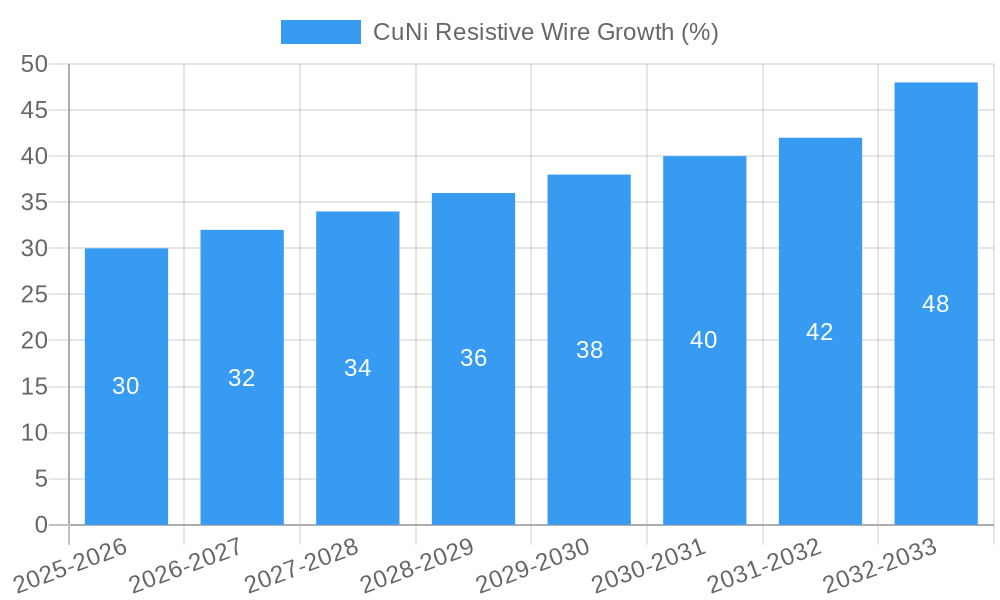
The CuNi resistive wire market is experiencing robust growth, driven by increasing demand across diverse sectors. The market, estimated at $500 million in 2025, is projected to achieve a Compound Annual Growth Rate (CAGR) of 6% from 2025 to 2033, reaching approximately $800 million by 2033. This expansion is fueled primarily by the escalating adoption of CuNi resistive wire in high-temperature applications, particularly in the automotive, industrial heating, and medical device industries. The automotive sector's push toward electric vehicles and hybrid systems is significantly boosting demand for precise temperature control components, where CuNi's superior resistance and temperature stability are crucial. Furthermore, advancements in manufacturing techniques are contributing to improved wire quality and enhanced performance, leading to broader adoption. Key trends include a shift towards miniaturization and the development of specialized alloys with improved corrosion resistance and higher operational temperatures, catering to the stringent requirements of next-generation technologies.
However, the market faces certain restraints. Fluctuations in the prices of nickel, a key component of CuNi alloys, pose a significant challenge, impacting manufacturing costs and profitability. Additionally, the emergence of alternative resistive materials presents competition, albeit currently limited due to CuNi's superior overall performance characteristics in many applications. The market is segmented by application (automotive, industrial heating, medical, etc.), wire diameter, and geographical region. Leading players such as Supercon, Hyndman, Kanthal, and others are strategically investing in R&D and expanding their production capacities to meet the growing demand and maintain market share within this competitive landscape. The continued development of innovative alloys and manufacturing techniques will be pivotal to sustaining this positive growth trajectory.

CuNi Resistive Wire Market Report: 2019-2033
This comprehensive report provides a detailed analysis of the CuNi Resistive Wire market, encompassing market dynamics, growth trends, regional segmentation, product landscape, key players, and future outlook. The study period covers 2019-2033, with a base year of 2025 and a forecast period of 2025-2033. The report leverages extensive primary and secondary research to deliver actionable insights for industry professionals, investors, and strategic decision-makers. The market is segmented by application across various industries (parent market) further subdivided into specific end-use sectors (child market). This granular approach provides a nuanced understanding of the market's complexities and growth drivers. Market size is presented in million units.
CuNi Resistive Wire Market Dynamics & Structure
The CuNi Resistive Wire market exhibits a moderately concentrated structure, with key players holding significant market share. Technological innovation, particularly in materials science and manufacturing processes, is a crucial driver of market growth. Stringent regulatory frameworks related to material safety and environmental impact influence manufacturing practices and product development. The market faces competition from alternative resistive materials, though CuNi's unique properties maintain its dominance in several applications. End-user demographics, particularly in the automotive, industrial heating, and electronics sectors, significantly impact market demand. M&A activity has been moderate, with xx deals recorded between 2019 and 2024, primarily focusing on expanding geographical reach and product portfolios.
- Market Concentration: Moderately concentrated, with top 5 players holding approximately xx% market share in 2025.
- Technological Innovation: Focus on improving temperature stability, reducing resistivity drift, and enhancing durability.
- Regulatory Landscape: Compliance with RoHS, REACH, and other relevant environmental regulations is crucial.
- Competitive Substitutes: Alternatives include Nichrome, Kanthal A1, and other specialized alloys.
- M&A Activity: xx deals recorded between 2019 and 2024, resulting in xx% market consolidation.
- Innovation Barriers: High R&D costs and the need for specialized equipment hinder rapid innovation.
CuNi Resistive Wire Growth Trends & Insights
The CuNi Resistive Wire market experienced a CAGR of xx% during the historical period (2019-2024), reaching a market size of xx million units in 2024. The estimated market size in 2025 is xx million units. The forecast period (2025-2033) projects continued growth, driven by increasing demand from key end-use sectors such as automotive, electronics, and industrial heating. Technological advancements, such as the development of high-precision manufacturing techniques and specialized alloys, further contribute to market expansion. Shifts in consumer preferences towards energy-efficient technologies and miniaturization trends in electronics are also influencing market adoption rates. Market penetration in emerging economies is expected to increase significantly during the forecast period, leading to a projected CAGR of xx% between 2025 and 2033.
Dominant Regions, Countries, or Segments in CuNi Resistive Wire
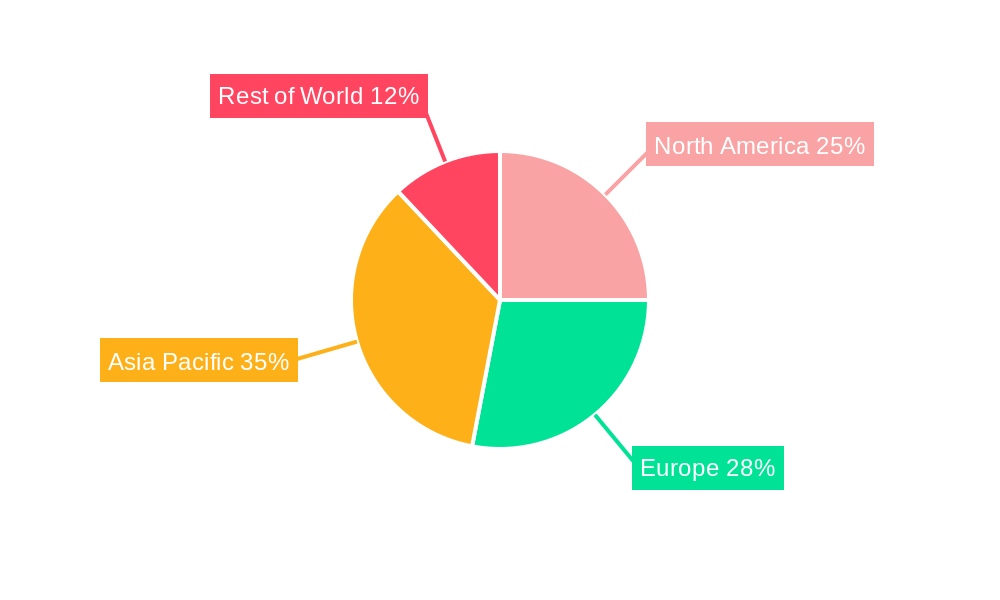
The North American region is currently the dominant market for CuNi Resistive Wire, driven by strong demand from the automotive and industrial sectors. Asia Pacific is projected to witness the fastest growth during the forecast period, fueled by expanding manufacturing activities and infrastructure development in countries like China, India, and South Korea. The robust growth in the electronics industry in Asia Pacific significantly impacts demand for high-quality resistive wire.
- Key Drivers in North America: Established automotive and industrial base, stringent quality standards, and technological advancements.
- Key Drivers in Asia Pacific: Rapid industrialization, growing electronics sector, and increasing government investments in infrastructure.
- Market Share: North America holds xx% market share in 2025, while Asia Pacific is projected to reach xx% by 2033.
- Growth Potential: Asia Pacific exhibits the highest growth potential due to its expanding industrial base and developing economies.
CuNi Resistive Wire Product Landscape
CuNi resistive wire is available in various diameters, lengths, and resistances, catering to diverse application requirements. Recent innovations focus on improving material properties, such as enhanced temperature stability and resistance to oxidation. Manufacturers are also emphasizing precise dimensional tolerances and improved surface finishes. Unique selling propositions often include superior heat dissipation, consistent resistance, and long service life.
Key Drivers, Barriers & Challenges in CuNi Resistive Wire
Key Drivers: Increasing demand from automotive, electronics, and industrial heating applications; technological advancements resulting in improved performance and efficiency; and supportive government policies promoting industrial development.
Challenges & Restraints: Fluctuations in raw material prices; supply chain disruptions due to geopolitical factors; stringent environmental regulations increasing manufacturing costs; and intense competition from substitute materials. The impact of these restraints is estimated to reduce market growth by approximately xx% by 2033.
Emerging Opportunities in CuNi Resistive Wire
Emerging opportunities exist in the development of specialized alloys for high-temperature applications, expansion into niche markets such as renewable energy and medical devices, and the growing adoption of advanced manufacturing processes. Untapped markets in developing economies present substantial growth potential.
Growth Accelerators in the CuNi Resistive Wire Industry
Technological breakthroughs in materials science and manufacturing processes, strategic partnerships to secure raw material supply and expand market reach, and focused marketing efforts to penetrate new markets will accelerate growth in the CuNi Resistive Wire market.
Key Players Shaping the CuNi Resistive Wire Market
- Supercon
- Hyndman
- Kanthal
- TANKII
- Ganpat
- Tokyo Resistance Wire
- Superb Heater Technology
- Berkenhoff GmbH
- JLC Electromet
- CHANGZHOU DLX ALLOY
- Hangzhou Ualloy Material
- Shanghai Leego Precision Alloy
- Danyang Haiwei Electrothermal Alloy
- Jiangyin Chengxin Alloy
Notable Milestones in CuNi Resistive Wire Sector
- 2020: Introduction of a new high-temperature CuNi alloy by Kanthal.
- 2022: Strategic partnership between Supercon and a major automotive manufacturer for supplying CuNi resistive wire.
- 2023: Acquisition of a smaller resistive wire manufacturer by Berkenhoff GmbH.
In-Depth CuNi Resistive Wire Market Outlook
The CuNi Resistive Wire market is poised for sustained growth driven by strong demand from key end-use sectors and technological advancements. Strategic investments in R&D, expanding into emerging markets, and forging strategic alliances will be crucial for companies to capitalize on future opportunities. The market is expected to reach xx million units by 2033.
CuNi Resistive Wire Segmentation
-
1. Application
- 1.1. Superconducting Switch
- 1.2. Heating Element
- 1.3. Strain Gauge
- 1.4. Others
-
2. Types
- 2.1. CuNi1
- 2.2. CuNi6
- 2.3. CuNi14
- 2.4. CuNi34
- 2.5. Others
CuNi Resistive Wire Segmentation By Geography
-
1. North America
- 1.1. United States
- 1.2. Canada
- 1.3. Mexico
-
2. South America
- 2.1. Brazil
- 2.2. Argentina
- 2.3. Rest of South America
-
3. Europe
- 3.1. United Kingdom
- 3.2. Germany
- 3.3. France
- 3.4. Italy
- 3.5. Spain
- 3.6. Russia
- 3.7. Benelux
- 3.8. Nordics
- 3.9. Rest of Europe
-
4. Middle East & Africa
- 4.1. Turkey
- 4.2. Israel
- 4.3. GCC
- 4.4. North Africa
- 4.5. South Africa
- 4.6. Rest of Middle East & Africa
-
5. Asia Pacific
- 5.1. China
- 5.2. India
- 5.3. Japan
- 5.4. South Korea
- 5.5. ASEAN
- 5.6. Oceania
- 5.7. Rest of Asia Pacific
CuNi Resistive Wire REPORT HIGHLIGHTS
| Aspects | Details |
|---|---|
| Study Period | 2019-2033 |
| Base Year | 2024 |
| Estimated Year | 2025 |
| Forecast Period | 2025-2033 |
| Historical Period | 2019-2024 |
| Growth Rate | CAGR of XX% from 2019-2033 |
| Segmentation |
|
Table of Contents
- 1. Introduction
- 1.1. Research Scope
- 1.2. Market Segmentation
- 1.3. Research Methodology
- 1.4. Definitions and Assumptions
- 2. Executive Summary
- 2.1. Introduction
- 3. Market Dynamics
- 3.1. Introduction
- 3.2. Market Drivers
- 3.3. Market Restrains
- 3.4. Market Trends
- 4. Market Factor Analysis
- 4.1. Porters Five Forces
- 4.2. Supply/Value Chain
- 4.3. PESTEL analysis
- 4.4. Market Entropy
- 4.5. Patent/Trademark Analysis
- 5. Global CuNi Resistive Wire Analysis, Insights and Forecast, 2019-2031
- 5.1. Market Analysis, Insights and Forecast - by Application
- 5.1.1. Superconducting Switch
- 5.1.2. Heating Element
- 5.1.3. Strain Gauge
- 5.1.4. Others
- 5.2. Market Analysis, Insights and Forecast - by Types
- 5.2.1. CuNi1
- 5.2.2. CuNi6
- 5.2.3. CuNi14
- 5.2.4. CuNi34
- 5.2.5. Others
- 5.3. Market Analysis, Insights and Forecast - by Region
- 5.3.1. North America
- 5.3.2. South America
- 5.3.3. Europe
- 5.3.4. Middle East & Africa
- 5.3.5. Asia Pacific
- 5.1. Market Analysis, Insights and Forecast - by Application
- 6. North America CuNi Resistive Wire Analysis, Insights and Forecast, 2019-2031
- 6.1. Market Analysis, Insights and Forecast - by Application
- 6.1.1. Superconducting Switch
- 6.1.2. Heating Element
- 6.1.3. Strain Gauge
- 6.1.4. Others
- 6.2. Market Analysis, Insights and Forecast - by Types
- 6.2.1. CuNi1
- 6.2.2. CuNi6
- 6.2.3. CuNi14
- 6.2.4. CuNi34
- 6.2.5. Others
- 6.1. Market Analysis, Insights and Forecast - by Application
- 7. South America CuNi Resistive Wire Analysis, Insights and Forecast, 2019-2031
- 7.1. Market Analysis, Insights and Forecast - by Application
- 7.1.1. Superconducting Switch
- 7.1.2. Heating Element
- 7.1.3. Strain Gauge
- 7.1.4. Others
- 7.2. Market Analysis, Insights and Forecast - by Types
- 7.2.1. CuNi1
- 7.2.2. CuNi6
- 7.2.3. CuNi14
- 7.2.4. CuNi34
- 7.2.5. Others
- 7.1. Market Analysis, Insights and Forecast - by Application
- 8. Europe CuNi Resistive Wire Analysis, Insights and Forecast, 2019-2031
- 8.1. Market Analysis, Insights and Forecast - by Application
- 8.1.1. Superconducting Switch
- 8.1.2. Heating Element
- 8.1.3. Strain Gauge
- 8.1.4. Others
- 8.2. Market Analysis, Insights and Forecast - by Types
- 8.2.1. CuNi1
- 8.2.2. CuNi6
- 8.2.3. CuNi14
- 8.2.4. CuNi34
- 8.2.5. Others
- 8.1. Market Analysis, Insights and Forecast - by Application
- 9. Middle East & Africa CuNi Resistive Wire Analysis, Insights and Forecast, 2019-2031
- 9.1. Market Analysis, Insights and Forecast - by Application
- 9.1.1. Superconducting Switch
- 9.1.2. Heating Element
- 9.1.3. Strain Gauge
- 9.1.4. Others
- 9.2. Market Analysis, Insights and Forecast - by Types
- 9.2.1. CuNi1
- 9.2.2. CuNi6
- 9.2.3. CuNi14
- 9.2.4. CuNi34
- 9.2.5. Others
- 9.1. Market Analysis, Insights and Forecast - by Application
- 10. Asia Pacific CuNi Resistive Wire Analysis, Insights and Forecast, 2019-2031
- 10.1. Market Analysis, Insights and Forecast - by Application
- 10.1.1. Superconducting Switch
- 10.1.2. Heating Element
- 10.1.3. Strain Gauge
- 10.1.4. Others
- 10.2. Market Analysis, Insights and Forecast - by Types
- 10.2.1. CuNi1
- 10.2.2. CuNi6
- 10.2.3. CuNi14
- 10.2.4. CuNi34
- 10.2.5. Others
- 10.1. Market Analysis, Insights and Forecast - by Application
- 11. Competitive Analysis
- 11.1. Global Market Share Analysis 2024
- 11.2. Company Profiles
- 11.2.1 Supercon
- 11.2.1.1. Overview
- 11.2.1.2. Products
- 11.2.1.3. SWOT Analysis
- 11.2.1.4. Recent Developments
- 11.2.1.5. Financials (Based on Availability)
- 11.2.2 Hyndman
- 11.2.2.1. Overview
- 11.2.2.2. Products
- 11.2.2.3. SWOT Analysis
- 11.2.2.4. Recent Developments
- 11.2.2.5. Financials (Based on Availability)
- 11.2.3 Kanthal
- 11.2.3.1. Overview
- 11.2.3.2. Products
- 11.2.3.3. SWOT Analysis
- 11.2.3.4. Recent Developments
- 11.2.3.5. Financials (Based on Availability)
- 11.2.4 TANKII
- 11.2.4.1. Overview
- 11.2.4.2. Products
- 11.2.4.3. SWOT Analysis
- 11.2.4.4. Recent Developments
- 11.2.4.5. Financials (Based on Availability)
- 11.2.5 Ganpat
- 11.2.5.1. Overview
- 11.2.5.2. Products
- 11.2.5.3. SWOT Analysis
- 11.2.5.4. Recent Developments
- 11.2.5.5. Financials (Based on Availability)
- 11.2.6 Tokyo Resistance Wire
- 11.2.6.1. Overview
- 11.2.6.2. Products
- 11.2.6.3. SWOT Analysis
- 11.2.6.4. Recent Developments
- 11.2.6.5. Financials (Based on Availability)
- 11.2.7 Superb Heater Technology
- 11.2.7.1. Overview
- 11.2.7.2. Products
- 11.2.7.3. SWOT Analysis
- 11.2.7.4. Recent Developments
- 11.2.7.5. Financials (Based on Availability)
- 11.2.8 Berkenhoff GmbH
- 11.2.8.1. Overview
- 11.2.8.2. Products
- 11.2.8.3. SWOT Analysis
- 11.2.8.4. Recent Developments
- 11.2.8.5. Financials (Based on Availability)
- 11.2.9 JLC Electromet
- 11.2.9.1. Overview
- 11.2.9.2. Products
- 11.2.9.3. SWOT Analysis
- 11.2.9.4. Recent Developments
- 11.2.9.5. Financials (Based on Availability)
- 11.2.10 CHANGZHOU DLX ALLOY
- 11.2.10.1. Overview
- 11.2.10.2. Products
- 11.2.10.3. SWOT Analysis
- 11.2.10.4. Recent Developments
- 11.2.10.5. Financials (Based on Availability)
- 11.2.11 Hangzhou Ualloy Material
- 11.2.11.1. Overview
- 11.2.11.2. Products
- 11.2.11.3. SWOT Analysis
- 11.2.11.4. Recent Developments
- 11.2.11.5. Financials (Based on Availability)
- 11.2.12 Shanghai Leego Precision Alloy
- 11.2.12.1. Overview
- 11.2.12.2. Products
- 11.2.12.3. SWOT Analysis
- 11.2.12.4. Recent Developments
- 11.2.12.5. Financials (Based on Availability)
- 11.2.13 Danyang Haiwei Electrothermal Alloy
- 11.2.13.1. Overview
- 11.2.13.2. Products
- 11.2.13.3. SWOT Analysis
- 11.2.13.4. Recent Developments
- 11.2.13.5. Financials (Based on Availability)
- 11.2.14 Jiangyin Chengxin Alloy
- 11.2.14.1. Overview
- 11.2.14.2. Products
- 11.2.14.3. SWOT Analysis
- 11.2.14.4. Recent Developments
- 11.2.14.5. Financials (Based on Availability)
- 11.2.1 Supercon
List of Figures
- Figure 1: Global CuNi Resistive Wire Revenue Breakdown (million, %) by Region 2024 & 2032
- Figure 2: North America CuNi Resistive Wire Revenue (million), by Application 2024 & 2032
- Figure 3: North America CuNi Resistive Wire Revenue Share (%), by Application 2024 & 2032
- Figure 4: North America CuNi Resistive Wire Revenue (million), by Types 2024 & 2032
- Figure 5: North America CuNi Resistive Wire Revenue Share (%), by Types 2024 & 2032
- Figure 6: North America CuNi Resistive Wire Revenue (million), by Country 2024 & 2032
- Figure 7: North America CuNi Resistive Wire Revenue Share (%), by Country 2024 & 2032
- Figure 8: South America CuNi Resistive Wire Revenue (million), by Application 2024 & 2032
- Figure 9: South America CuNi Resistive Wire Revenue Share (%), by Application 2024 & 2032
- Figure 10: South America CuNi Resistive Wire Revenue (million), by Types 2024 & 2032
- Figure 11: South America CuNi Resistive Wire Revenue Share (%), by Types 2024 & 2032
- Figure 12: South America CuNi Resistive Wire Revenue (million), by Country 2024 & 2032
- Figure 13: South America CuNi Resistive Wire Revenue Share (%), by Country 2024 & 2032
- Figure 14: Europe CuNi Resistive Wire Revenue (million), by Application 2024 & 2032
- Figure 15: Europe CuNi Resistive Wire Revenue Share (%), by Application 2024 & 2032
- Figure 16: Europe CuNi Resistive Wire Revenue (million), by Types 2024 & 2032
- Figure 17: Europe CuNi Resistive Wire Revenue Share (%), by Types 2024 & 2032
- Figure 18: Europe CuNi Resistive Wire Revenue (million), by Country 2024 & 2032
- Figure 19: Europe CuNi Resistive Wire Revenue Share (%), by Country 2024 & 2032
- Figure 20: Middle East & Africa CuNi Resistive Wire Revenue (million), by Application 2024 & 2032
- Figure 21: Middle East & Africa CuNi Resistive Wire Revenue Share (%), by Application 2024 & 2032
- Figure 22: Middle East & Africa CuNi Resistive Wire Revenue (million), by Types 2024 & 2032
- Figure 23: Middle East & Africa CuNi Resistive Wire Revenue Share (%), by Types 2024 & 2032
- Figure 24: Middle East & Africa CuNi Resistive Wire Revenue (million), by Country 2024 & 2032
- Figure 25: Middle East & Africa CuNi Resistive Wire Revenue Share (%), by Country 2024 & 2032
- Figure 26: Asia Pacific CuNi Resistive Wire Revenue (million), by Application 2024 & 2032
- Figure 27: Asia Pacific CuNi Resistive Wire Revenue Share (%), by Application 2024 & 2032
- Figure 28: Asia Pacific CuNi Resistive Wire Revenue (million), by Types 2024 & 2032
- Figure 29: Asia Pacific CuNi Resistive Wire Revenue Share (%), by Types 2024 & 2032
- Figure 30: Asia Pacific CuNi Resistive Wire Revenue (million), by Country 2024 & 2032
- Figure 31: Asia Pacific CuNi Resistive Wire Revenue Share (%), by Country 2024 & 2032
List of Tables
- Table 1: Global CuNi Resistive Wire Revenue million Forecast, by Region 2019 & 2032
- Table 2: Global CuNi Resistive Wire Revenue million Forecast, by Application 2019 & 2032
- Table 3: Global CuNi Resistive Wire Revenue million Forecast, by Types 2019 & 2032
- Table 4: Global CuNi Resistive Wire Revenue million Forecast, by Region 2019 & 2032
- Table 5: Global CuNi Resistive Wire Revenue million Forecast, by Application 2019 & 2032
- Table 6: Global CuNi Resistive Wire Revenue million Forecast, by Types 2019 & 2032
- Table 7: Global CuNi Resistive Wire Revenue million Forecast, by Country 2019 & 2032
- Table 8: United States CuNi Resistive Wire Revenue (million) Forecast, by Application 2019 & 2032
- Table 9: Canada CuNi Resistive Wire Revenue (million) Forecast, by Application 2019 & 2032
- Table 10: Mexico CuNi Resistive Wire Revenue (million) Forecast, by Application 2019 & 2032
- Table 11: Global CuNi Resistive Wire Revenue million Forecast, by Application 2019 & 2032
- Table 12: Global CuNi Resistive Wire Revenue million Forecast, by Types 2019 & 2032
- Table 13: Global CuNi Resistive Wire Revenue million Forecast, by Country 2019 & 2032
- Table 14: Brazil CuNi Resistive Wire Revenue (million) Forecast, by Application 2019 & 2032
- Table 15: Argentina CuNi Resistive Wire Revenue (million) Forecast, by Application 2019 & 2032
- Table 16: Rest of South America CuNi Resistive Wire Revenue (million) Forecast, by Application 2019 & 2032
- Table 17: Global CuNi Resistive Wire Revenue million Forecast, by Application 2019 & 2032
- Table 18: Global CuNi Resistive Wire Revenue million Forecast, by Types 2019 & 2032
- Table 19: Global CuNi Resistive Wire Revenue million Forecast, by Country 2019 & 2032
- Table 20: United Kingdom CuNi Resistive Wire Revenue (million) Forecast, by Application 2019 & 2032
- Table 21: Germany CuNi Resistive Wire Revenue (million) Forecast, by Application 2019 & 2032
- Table 22: France CuNi Resistive Wire Revenue (million) Forecast, by Application 2019 & 2032
- Table 23: Italy CuNi Resistive Wire Revenue (million) Forecast, by Application 2019 & 2032
- Table 24: Spain CuNi Resistive Wire Revenue (million) Forecast, by Application 2019 & 2032
- Table 25: Russia CuNi Resistive Wire Revenue (million) Forecast, by Application 2019 & 2032
- Table 26: Benelux CuNi Resistive Wire Revenue (million) Forecast, by Application 2019 & 2032
- Table 27: Nordics CuNi Resistive Wire Revenue (million) Forecast, by Application 2019 & 2032
- Table 28: Rest of Europe CuNi Resistive Wire Revenue (million) Forecast, by Application 2019 & 2032
- Table 29: Global CuNi Resistive Wire Revenue million Forecast, by Application 2019 & 2032
- Table 30: Global CuNi Resistive Wire Revenue million Forecast, by Types 2019 & 2032
- Table 31: Global CuNi Resistive Wire Revenue million Forecast, by Country 2019 & 2032
- Table 32: Turkey CuNi Resistive Wire Revenue (million) Forecast, by Application 2019 & 2032
- Table 33: Israel CuNi Resistive Wire Revenue (million) Forecast, by Application 2019 & 2032
- Table 34: GCC CuNi Resistive Wire Revenue (million) Forecast, by Application 2019 & 2032
- Table 35: North Africa CuNi Resistive Wire Revenue (million) Forecast, by Application 2019 & 2032
- Table 36: South Africa CuNi Resistive Wire Revenue (million) Forecast, by Application 2019 & 2032
- Table 37: Rest of Middle East & Africa CuNi Resistive Wire Revenue (million) Forecast, by Application 2019 & 2032
- Table 38: Global CuNi Resistive Wire Revenue million Forecast, by Application 2019 & 2032
- Table 39: Global CuNi Resistive Wire Revenue million Forecast, by Types 2019 & 2032
- Table 40: Global CuNi Resistive Wire Revenue million Forecast, by Country 2019 & 2032
- Table 41: China CuNi Resistive Wire Revenue (million) Forecast, by Application 2019 & 2032
- Table 42: India CuNi Resistive Wire Revenue (million) Forecast, by Application 2019 & 2032
- Table 43: Japan CuNi Resistive Wire Revenue (million) Forecast, by Application 2019 & 2032
- Table 44: South Korea CuNi Resistive Wire Revenue (million) Forecast, by Application 2019 & 2032
- Table 45: ASEAN CuNi Resistive Wire Revenue (million) Forecast, by Application 2019 & 2032
- Table 46: Oceania CuNi Resistive Wire Revenue (million) Forecast, by Application 2019 & 2032
- Table 47: Rest of Asia Pacific CuNi Resistive Wire Revenue (million) Forecast, by Application 2019 & 2032
Frequently Asked Questions
1. What is the projected Compound Annual Growth Rate (CAGR) of the CuNi Resistive Wire?
The projected CAGR is approximately XX%.
2. Which companies are prominent players in the CuNi Resistive Wire?
Key companies in the market include Supercon, Hyndman, Kanthal, TANKII, Ganpat, Tokyo Resistance Wire, Superb Heater Technology, Berkenhoff GmbH, JLC Electromet, CHANGZHOU DLX ALLOY, Hangzhou Ualloy Material, Shanghai Leego Precision Alloy, Danyang Haiwei Electrothermal Alloy, Jiangyin Chengxin Alloy.
3. What are the main segments of the CuNi Resistive Wire?
The market segments include Application, Types.
4. Can you provide details about the market size?
The market size is estimated to be USD XXX million as of 2022.
5. What are some drivers contributing to market growth?
N/A
6. What are the notable trends driving market growth?
N/A
7. Are there any restraints impacting market growth?
N/A
8. Can you provide examples of recent developments in the market?
N/A
9. What pricing options are available for accessing the report?
Pricing options include single-user, multi-user, and enterprise licenses priced at USD 4900.00, USD 7350.00, and USD 9800.00 respectively.
10. Is the market size provided in terms of value or volume?
The market size is provided in terms of value, measured in million.
11. Are there any specific market keywords associated with the report?
Yes, the market keyword associated with the report is "CuNi Resistive Wire," which aids in identifying and referencing the specific market segment covered.
12. How do I determine which pricing option suits my needs best?
The pricing options vary based on user requirements and access needs. Individual users may opt for single-user licenses, while businesses requiring broader access may choose multi-user or enterprise licenses for cost-effective access to the report.
13. Are there any additional resources or data provided in the CuNi Resistive Wire report?
While the report offers comprehensive insights, it's advisable to review the specific contents or supplementary materials provided to ascertain if additional resources or data are available.
14. How can I stay updated on further developments or reports in the CuNi Resistive Wire?
To stay informed about further developments, trends, and reports in the CuNi Resistive Wire, consider subscribing to industry newsletters, following relevant companies and organizations, or regularly checking reputable industry news sources and publications.
Methodology
Step 1 - Identification of Relevant Samples Size from Population Database


Step 2 - Approaches for Defining Global Market Size (Value, Volume* & Price*)

Note*: In applicable scenarios
Step 3 - Data Sources
Primary Research
- Web Analytics
- Survey Reports
- Research Institute
- Latest Research Reports
- Opinion Leaders
Secondary Research
- Annual Reports
- White Paper
- Latest Press Release
- Industry Association
- Paid Database
- Investor Presentations

Step 4 - Data Triangulation
Involves using different sources of information in order to increase the validity of a study
These sources are likely to be stakeholders in a program - participants, other researchers, program staff, other community members, and so on.
Then we put all data in single framework & apply various statistical tools to find out the dynamic on the market.
During the analysis stage, feedback from the stakeholder groups would be compared to determine areas of agreement as well as areas of divergence
