

Key Insights
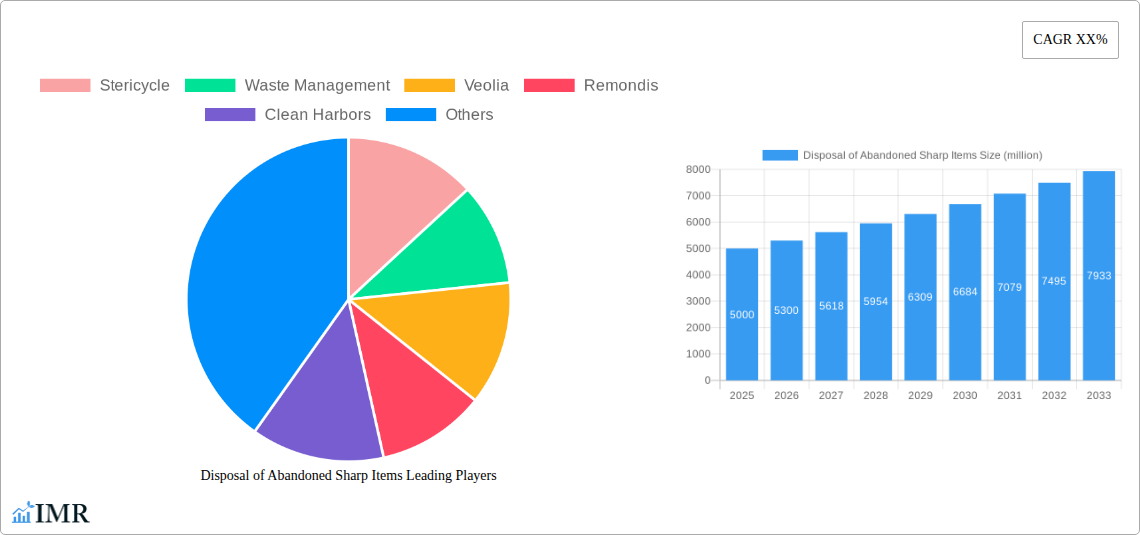
The global market for the disposal of abandoned sharp items is experiencing robust growth, driven by increasing healthcare waste generation, stringent regulatory frameworks concerning hazardous waste management, and rising awareness of the risks associated with improper disposal. The market's expansion is further fueled by the growing adoption of advanced disposal technologies, such as autoclaves and incinerators, which offer safer and more efficient methods compared to traditional landfill practices. Significant investments in research and development are also contributing to the development of innovative solutions for managing sharp medical waste, focusing on reducing environmental impact and improving worker safety. While the market faces challenges like fluctuating raw material prices and the need for continuous technological upgrades, the overall outlook remains positive. The expanding healthcare sector, particularly in emerging economies, is a key driver of market growth. We estimate the market size in 2025 to be approximately $5 billion, growing at a CAGR of 6% over the forecast period (2025-2033).
Major players in the market, including Stericycle, Waste Management, and Veolia, are strategically investing in acquisitions, expansions, and technological advancements to consolidate their market positions and meet the growing demand. The market is segmented geographically, with North America and Europe currently holding significant market shares due to established healthcare infrastructure and stringent environmental regulations. However, Asia-Pacific is expected to exhibit high growth potential owing to the rapid expansion of the healthcare industry and increasing government initiatives for improved waste management practices. The competitive landscape is characterized by a mix of large multinational corporations and regional players, leading to both consolidation and innovation within the industry. The focus on sustainable disposal methods, including recycling and energy recovery, will continue to shape the future direction of the market.
Disposal of Abandoned Sharp Items Market Report: 2019-2033
This comprehensive report provides a detailed analysis of the global Disposal of Abandoned Sharp Items market, offering invaluable insights for industry professionals, investors, and strategic decision-makers. The study period covers 2019-2033, with 2025 as the base year and estimated year. The forecast period spans 2025-2033, and the historical period encompasses 2019-2024. The report meticulously examines market dynamics, growth trends, regional variations, and the competitive landscape, providing a 360-degree view of this critical sector within the broader Medical Waste Management and Environmental Services industries. The report projects a market size of xx million units by 2033.
Disposal of Abandoned Sharp Items Market Dynamics & Structure
This section analyzes the market's competitive intensity, technological advancements, regulatory landscape, substitute products, end-user demographics, and merger & acquisition (M&A) activity. The global market is characterized by a moderately concentrated structure, with the top 5 players holding an estimated xx% market share in 2025.
- Market Concentration: High, with significant players controlling a large portion of the market.
- Technological Innovation: Focus on automation, improved safety protocols, and sustainable disposal methods. Innovation barriers include high initial investment costs and stringent regulatory approvals.
- Regulatory Frameworks: Stringent regulations regarding the handling and disposal of sharps drive market growth but also present compliance challenges. Variations in regulations across geographies influence market dynamics.
- Competitive Product Substitutes: Limited viable substitutes exist due to the inherent risks associated with improper sharps disposal.
- End-User Demographics: Hospitals, clinics, pharmaceutical companies, and research facilities are key end-users, with growth driven by increasing healthcare expenditure and expanding healthcare infrastructure.
- M&A Trends: A moderate level of M&A activity is observed, with larger players seeking to expand their market share and service offerings. The number of M&A deals in the period 2019-2024 is estimated to be xx. This trend is expected to continue, driven by economies of scale and expansion into new geographic markets.
Disposal of Abandoned Sharp Items Growth Trends & Insights
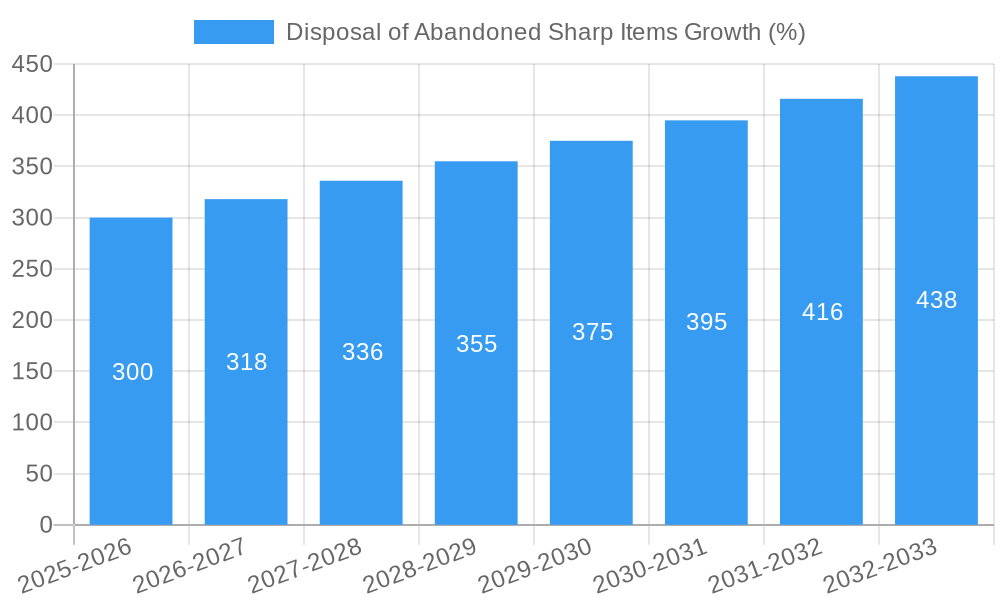
Utilizing a combination of primary and secondary research, including financial reports, industry publications, and expert interviews, this section delves into the market's historical and projected growth trajectory. The market exhibited a CAGR of xx% during 2019-2024, driven primarily by increasing healthcare waste generation and stricter regulatory enforcement. Technological advancements, particularly in automation and efficient disposal technologies, are further boosting market expansion. The market penetration rate in developed nations is high, while developing economies present substantial untapped potential. The projected CAGR for 2025-2033 is xx%, leading to an estimated market size of xx million units by 2033. Changing consumer behavior, emphasizing safe and sustainable waste disposal practices, further fuels market growth.
Dominant Regions, Countries, or Segments in Disposal of Abandoned Sharp Items
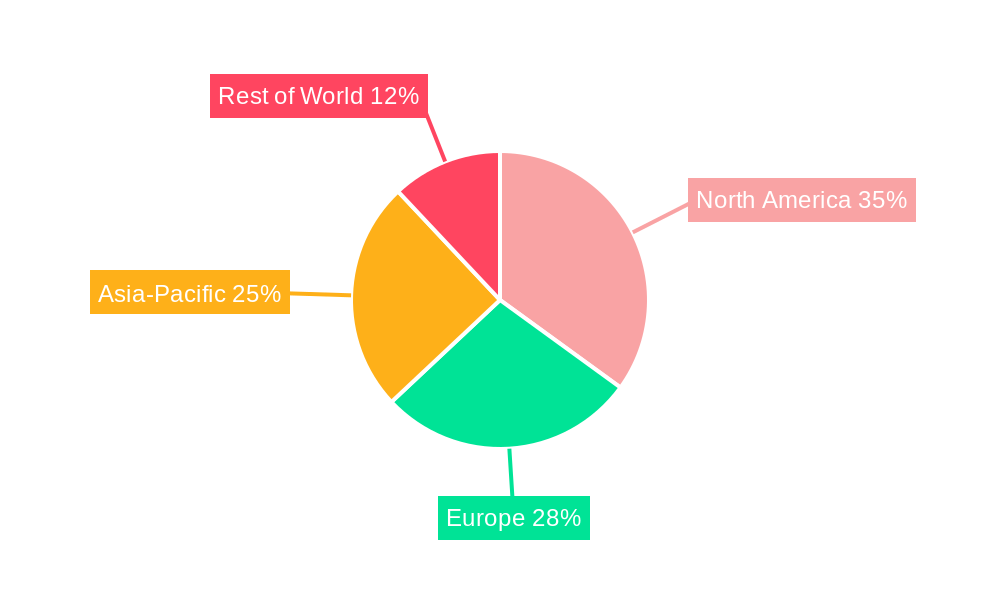
North America and Europe currently dominate the global market, driven by robust healthcare infrastructure, stringent regulations, and high awareness regarding safe sharps disposal. However, Asia-Pacific is poised for significant growth due to expanding healthcare sectors and increasing government initiatives promoting environmentally sound waste management practices.
- North America: High market maturity, stringent regulations, and established players contribute to its dominance.
- Europe: Similar to North America, with a focus on sustainable disposal methods.
- Asia-Pacific: High growth potential due to rising healthcare spending and increasing awareness of infection control.
- Key Drivers: Stringent regulations, rising healthcare expenditure, increasing awareness of infection control, and technological advancements.
Disposal of Abandoned Sharp Items Product Landscape
The market encompasses a range of products and services, including collection containers, transportation systems, sterilization technologies, and disposal facilities. Recent innovations focus on enhancing safety features, improving efficiency, and reducing environmental impact. Products are differentiated based on features like puncture resistance, ease of use, and capacity. Technological advancements center on automated systems, reducing manual handling risks and improving waste tracking.
Key Drivers, Barriers & Challenges in Disposal of Abandoned Sharp Items
Key Drivers: Stringent government regulations, rising healthcare waste generation, increasing awareness of infection control, and technological advancements in safe disposal methods.
Key Challenges and Restraints: High disposal costs, complexities in supply chain management (particularly in remote areas), inconsistent regulatory frameworks across different regions, and competitive pressure from smaller, regional players. These factors collectively impact profitability and market growth, with an estimated xx% reduction in market growth attributed to these challenges in 2024.
Emerging Opportunities in Disposal of Abandoned Sharp Items
Emerging opportunities lie in the expansion into underserved regions, the development of innovative, cost-effective disposal technologies, and the integration of smart waste management solutions using IoT and AI. Furthermore, growing focus on sustainable and environmentally friendly disposal methods presents lucrative avenues for market expansion.
Growth Accelerators in the Disposal of Abandoned Sharp Items Industry
Technological breakthroughs in automated sharps disposal systems, strategic partnerships between waste management companies and healthcare providers, and expansion into emerging markets are pivotal catalysts driving long-term market growth. The development of sustainable and eco-friendly disposal solutions also contributes to accelerating market expansion.
Key Players Shaping the Disposal of Abandoned Sharp Items Market
- Stericycle
- Waste Management
- Veolia
- Remondis
- Clean Harbors
- Cleanaway
- Sharps Medical Waste Services
- Daniels Health
- Republic Services
- Logistics Recycling
- Biffa
- MCF Environmental
- MedPro Disposal
- ECS Cares
Notable Milestones in Disposal of Abandoned Sharp Items Sector
- 2020: Introduction of a new automated sharps disposal system by Stericycle.
- 2022: Merger between two major players in the European market resulting in increased market consolidation.
- 2023: Implementation of stricter regulations in several key regions, influencing market practices and driving adoption of advanced technologies. (Specific details may require further research).
In-Depth Disposal of Abandoned Sharp Items Market Outlook
The future of the Disposal of Abandoned Sharp Items market is bright, driven by continued growth in healthcare waste generation, stringent regulatory requirements, and technological advancements. Strategic partnerships, market expansion into emerging economies, and the adoption of sustainable disposal practices will play crucial roles in shaping the market's future trajectory. The potential for growth is substantial, particularly in regions with developing healthcare infrastructure and increasing environmental awareness. The market is expected to witness sustained growth throughout the forecast period, presenting significant opportunities for established players and new entrants alike.
Disposal of Abandoned Sharp Items Segmentation
-
1. Application
- 1.1. Medical Institution
- 1.2. Residential and Commercial Area
- 1.3. Others
-
2. Types
- 2.1. Disposable Sharps Solution
- 2.2. Reusable Sharps Solution
Disposal of Abandoned Sharp Items Segmentation By Geography
-
1. North America
- 1.1. United States
- 1.2. Canada
- 1.3. Mexico
-
2. South America
- 2.1. Brazil
- 2.2. Argentina
- 2.3. Rest of South America
-
3. Europe
- 3.1. United Kingdom
- 3.2. Germany
- 3.3. France
- 3.4. Italy
- 3.5. Spain
- 3.6. Russia
- 3.7. Benelux
- 3.8. Nordics
- 3.9. Rest of Europe
-
4. Middle East & Africa
- 4.1. Turkey
- 4.2. Israel
- 4.3. GCC
- 4.4. North Africa
- 4.5. South Africa
- 4.6. Rest of Middle East & Africa
-
5. Asia Pacific
- 5.1. China
- 5.2. India
- 5.3. Japan
- 5.4. South Korea
- 5.5. ASEAN
- 5.6. Oceania
- 5.7. Rest of Asia Pacific
Disposal of Abandoned Sharp Items REPORT HIGHLIGHTS
| Aspects | Details |
|---|---|
| Study Period | 2019-2033 |
| Base Year | 2024 |
| Estimated Year | 2025 |
| Forecast Period | 2025-2033 |
| Historical Period | 2019-2024 |
| Growth Rate | CAGR of XX% from 2019-2033 |
| Segmentation |
|
Table of Contents
- 1. Introduction
- 1.1. Research Scope
- 1.2. Market Segmentation
- 1.3. Research Methodology
- 1.4. Definitions and Assumptions
- 2. Executive Summary
- 2.1. Introduction
- 3. Market Dynamics
- 3.1. Introduction
- 3.2. Market Drivers
- 3.3. Market Restrains
- 3.4. Market Trends
- 4. Market Factor Analysis
- 4.1. Porters Five Forces
- 4.2. Supply/Value Chain
- 4.3. PESTEL analysis
- 4.4. Market Entropy
- 4.5. Patent/Trademark Analysis
- 5. Global Disposal of Abandoned Sharp Items Analysis, Insights and Forecast, 2019-2031
- 5.1. Market Analysis, Insights and Forecast - by Application
- 5.1.1. Medical Institution
- 5.1.2. Residential and Commercial Area
- 5.1.3. Others
- 5.2. Market Analysis, Insights and Forecast - by Types
- 5.2.1. Disposable Sharps Solution
- 5.2.2. Reusable Sharps Solution
- 5.3. Market Analysis, Insights and Forecast - by Region
- 5.3.1. North America
- 5.3.2. South America
- 5.3.3. Europe
- 5.3.4. Middle East & Africa
- 5.3.5. Asia Pacific
- 5.1. Market Analysis, Insights and Forecast - by Application
- 6. North America Disposal of Abandoned Sharp Items Analysis, Insights and Forecast, 2019-2031
- 6.1. Market Analysis, Insights and Forecast - by Application
- 6.1.1. Medical Institution
- 6.1.2. Residential and Commercial Area
- 6.1.3. Others
- 6.2. Market Analysis, Insights and Forecast - by Types
- 6.2.1. Disposable Sharps Solution
- 6.2.2. Reusable Sharps Solution
- 6.1. Market Analysis, Insights and Forecast - by Application
- 7. South America Disposal of Abandoned Sharp Items Analysis, Insights and Forecast, 2019-2031
- 7.1. Market Analysis, Insights and Forecast - by Application
- 7.1.1. Medical Institution
- 7.1.2. Residential and Commercial Area
- 7.1.3. Others
- 7.2. Market Analysis, Insights and Forecast - by Types
- 7.2.1. Disposable Sharps Solution
- 7.2.2. Reusable Sharps Solution
- 7.1. Market Analysis, Insights and Forecast - by Application
- 8. Europe Disposal of Abandoned Sharp Items Analysis, Insights and Forecast, 2019-2031
- 8.1. Market Analysis, Insights and Forecast - by Application
- 8.1.1. Medical Institution
- 8.1.2. Residential and Commercial Area
- 8.1.3. Others
- 8.2. Market Analysis, Insights and Forecast - by Types
- 8.2.1. Disposable Sharps Solution
- 8.2.2. Reusable Sharps Solution
- 8.1. Market Analysis, Insights and Forecast - by Application
- 9. Middle East & Africa Disposal of Abandoned Sharp Items Analysis, Insights and Forecast, 2019-2031
- 9.1. Market Analysis, Insights and Forecast - by Application
- 9.1.1. Medical Institution
- 9.1.2. Residential and Commercial Area
- 9.1.3. Others
- 9.2. Market Analysis, Insights and Forecast - by Types
- 9.2.1. Disposable Sharps Solution
- 9.2.2. Reusable Sharps Solution
- 9.1. Market Analysis, Insights and Forecast - by Application
- 10. Asia Pacific Disposal of Abandoned Sharp Items Analysis, Insights and Forecast, 2019-2031
- 10.1. Market Analysis, Insights and Forecast - by Application
- 10.1.1. Medical Institution
- 10.1.2. Residential and Commercial Area
- 10.1.3. Others
- 10.2. Market Analysis, Insights and Forecast - by Types
- 10.2.1. Disposable Sharps Solution
- 10.2.2. Reusable Sharps Solution
- 10.1. Market Analysis, Insights and Forecast - by Application
- 11. Competitive Analysis
- 11.1. Global Market Share Analysis 2024
- 11.2. Company Profiles
- 11.2.1 Stericycle
- 11.2.1.1. Overview
- 11.2.1.2. Products
- 11.2.1.3. SWOT Analysis
- 11.2.1.4. Recent Developments
- 11.2.1.5. Financials (Based on Availability)
- 11.2.2 Waste Management
- 11.2.2.1. Overview
- 11.2.2.2. Products
- 11.2.2.3. SWOT Analysis
- 11.2.2.4. Recent Developments
- 11.2.2.5. Financials (Based on Availability)
- 11.2.3 Veolia
- 11.2.3.1. Overview
- 11.2.3.2. Products
- 11.2.3.3. SWOT Analysis
- 11.2.3.4. Recent Developments
- 11.2.3.5. Financials (Based on Availability)
- 11.2.4 Remondis
- 11.2.4.1. Overview
- 11.2.4.2. Products
- 11.2.4.3. SWOT Analysis
- 11.2.4.4. Recent Developments
- 11.2.4.5. Financials (Based on Availability)
- 11.2.5 Clean Harbors
- 11.2.5.1. Overview
- 11.2.5.2. Products
- 11.2.5.3. SWOT Analysis
- 11.2.5.4. Recent Developments
- 11.2.5.5. Financials (Based on Availability)
- 11.2.6 Cleanaway
- 11.2.6.1. Overview
- 11.2.6.2. Products
- 11.2.6.3. SWOT Analysis
- 11.2.6.4. Recent Developments
- 11.2.6.5. Financials (Based on Availability)
- 11.2.7 Sharps Medical Waste Services
- 11.2.7.1. Overview
- 11.2.7.2. Products
- 11.2.7.3. SWOT Analysis
- 11.2.7.4. Recent Developments
- 11.2.7.5. Financials (Based on Availability)
- 11.2.8 Daniels Health
- 11.2.8.1. Overview
- 11.2.8.2. Products
- 11.2.8.3. SWOT Analysis
- 11.2.8.4. Recent Developments
- 11.2.8.5. Financials (Based on Availability)
- 11.2.9 Republic Services
- 11.2.9.1. Overview
- 11.2.9.2. Products
- 11.2.9.3. SWOT Analysis
- 11.2.9.4. Recent Developments
- 11.2.9.5. Financials (Based on Availability)
- 11.2.10 Logistics Recycling
- 11.2.10.1. Overview
- 11.2.10.2. Products
- 11.2.10.3. SWOT Analysis
- 11.2.10.4. Recent Developments
- 11.2.10.5. Financials (Based on Availability)
- 11.2.11 Biffa
- 11.2.11.1. Overview
- 11.2.11.2. Products
- 11.2.11.3. SWOT Analysis
- 11.2.11.4. Recent Developments
- 11.2.11.5. Financials (Based on Availability)
- 11.2.12 MCF Environmental
- 11.2.12.1. Overview
- 11.2.12.2. Products
- 11.2.12.3. SWOT Analysis
- 11.2.12.4. Recent Developments
- 11.2.12.5. Financials (Based on Availability)
- 11.2.13 MedPro Disposal
- 11.2.13.1. Overview
- 11.2.13.2. Products
- 11.2.13.3. SWOT Analysis
- 11.2.13.4. Recent Developments
- 11.2.13.5. Financials (Based on Availability)
- 11.2.14 ECS Cares
- 11.2.14.1. Overview
- 11.2.14.2. Products
- 11.2.14.3. SWOT Analysis
- 11.2.14.4. Recent Developments
- 11.2.14.5. Financials (Based on Availability)
- 11.2.1 Stericycle
List of Figures
- Figure 1: Global Disposal of Abandoned Sharp Items Revenue Breakdown (million, %) by Region 2024 & 2032
- Figure 2: North America Disposal of Abandoned Sharp Items Revenue (million), by Application 2024 & 2032
- Figure 3: North America Disposal of Abandoned Sharp Items Revenue Share (%), by Application 2024 & 2032
- Figure 4: North America Disposal of Abandoned Sharp Items Revenue (million), by Types 2024 & 2032
- Figure 5: North America Disposal of Abandoned Sharp Items Revenue Share (%), by Types 2024 & 2032
- Figure 6: North America Disposal of Abandoned Sharp Items Revenue (million), by Country 2024 & 2032
- Figure 7: North America Disposal of Abandoned Sharp Items Revenue Share (%), by Country 2024 & 2032
- Figure 8: South America Disposal of Abandoned Sharp Items Revenue (million), by Application 2024 & 2032
- Figure 9: South America Disposal of Abandoned Sharp Items Revenue Share (%), by Application 2024 & 2032
- Figure 10: South America Disposal of Abandoned Sharp Items Revenue (million), by Types 2024 & 2032
- Figure 11: South America Disposal of Abandoned Sharp Items Revenue Share (%), by Types 2024 & 2032
- Figure 12: South America Disposal of Abandoned Sharp Items Revenue (million), by Country 2024 & 2032
- Figure 13: South America Disposal of Abandoned Sharp Items Revenue Share (%), by Country 2024 & 2032
- Figure 14: Europe Disposal of Abandoned Sharp Items Revenue (million), by Application 2024 & 2032
- Figure 15: Europe Disposal of Abandoned Sharp Items Revenue Share (%), by Application 2024 & 2032
- Figure 16: Europe Disposal of Abandoned Sharp Items Revenue (million), by Types 2024 & 2032
- Figure 17: Europe Disposal of Abandoned Sharp Items Revenue Share (%), by Types 2024 & 2032
- Figure 18: Europe Disposal of Abandoned Sharp Items Revenue (million), by Country 2024 & 2032
- Figure 19: Europe Disposal of Abandoned Sharp Items Revenue Share (%), by Country 2024 & 2032
- Figure 20: Middle East & Africa Disposal of Abandoned Sharp Items Revenue (million), by Application 2024 & 2032
- Figure 21: Middle East & Africa Disposal of Abandoned Sharp Items Revenue Share (%), by Application 2024 & 2032
- Figure 22: Middle East & Africa Disposal of Abandoned Sharp Items Revenue (million), by Types 2024 & 2032
- Figure 23: Middle East & Africa Disposal of Abandoned Sharp Items Revenue Share (%), by Types 2024 & 2032
- Figure 24: Middle East & Africa Disposal of Abandoned Sharp Items Revenue (million), by Country 2024 & 2032
- Figure 25: Middle East & Africa Disposal of Abandoned Sharp Items Revenue Share (%), by Country 2024 & 2032
- Figure 26: Asia Pacific Disposal of Abandoned Sharp Items Revenue (million), by Application 2024 & 2032
- Figure 27: Asia Pacific Disposal of Abandoned Sharp Items Revenue Share (%), by Application 2024 & 2032
- Figure 28: Asia Pacific Disposal of Abandoned Sharp Items Revenue (million), by Types 2024 & 2032
- Figure 29: Asia Pacific Disposal of Abandoned Sharp Items Revenue Share (%), by Types 2024 & 2032
- Figure 30: Asia Pacific Disposal of Abandoned Sharp Items Revenue (million), by Country 2024 & 2032
- Figure 31: Asia Pacific Disposal of Abandoned Sharp Items Revenue Share (%), by Country 2024 & 2032
List of Tables
- Table 1: Global Disposal of Abandoned Sharp Items Revenue million Forecast, by Region 2019 & 2032
- Table 2: Global Disposal of Abandoned Sharp Items Revenue million Forecast, by Application 2019 & 2032
- Table 3: Global Disposal of Abandoned Sharp Items Revenue million Forecast, by Types 2019 & 2032
- Table 4: Global Disposal of Abandoned Sharp Items Revenue million Forecast, by Region 2019 & 2032
- Table 5: Global Disposal of Abandoned Sharp Items Revenue million Forecast, by Application 2019 & 2032
- Table 6: Global Disposal of Abandoned Sharp Items Revenue million Forecast, by Types 2019 & 2032
- Table 7: Global Disposal of Abandoned Sharp Items Revenue million Forecast, by Country 2019 & 2032
- Table 8: United States Disposal of Abandoned Sharp Items Revenue (million) Forecast, by Application 2019 & 2032
- Table 9: Canada Disposal of Abandoned Sharp Items Revenue (million) Forecast, by Application 2019 & 2032
- Table 10: Mexico Disposal of Abandoned Sharp Items Revenue (million) Forecast, by Application 2019 & 2032
- Table 11: Global Disposal of Abandoned Sharp Items Revenue million Forecast, by Application 2019 & 2032
- Table 12: Global Disposal of Abandoned Sharp Items Revenue million Forecast, by Types 2019 & 2032
- Table 13: Global Disposal of Abandoned Sharp Items Revenue million Forecast, by Country 2019 & 2032
- Table 14: Brazil Disposal of Abandoned Sharp Items Revenue (million) Forecast, by Application 2019 & 2032
- Table 15: Argentina Disposal of Abandoned Sharp Items Revenue (million) Forecast, by Application 2019 & 2032
- Table 16: Rest of South America Disposal of Abandoned Sharp Items Revenue (million) Forecast, by Application 2019 & 2032
- Table 17: Global Disposal of Abandoned Sharp Items Revenue million Forecast, by Application 2019 & 2032
- Table 18: Global Disposal of Abandoned Sharp Items Revenue million Forecast, by Types 2019 & 2032
- Table 19: Global Disposal of Abandoned Sharp Items Revenue million Forecast, by Country 2019 & 2032
- Table 20: United Kingdom Disposal of Abandoned Sharp Items Revenue (million) Forecast, by Application 2019 & 2032
- Table 21: Germany Disposal of Abandoned Sharp Items Revenue (million) Forecast, by Application 2019 & 2032
- Table 22: France Disposal of Abandoned Sharp Items Revenue (million) Forecast, by Application 2019 & 2032
- Table 23: Italy Disposal of Abandoned Sharp Items Revenue (million) Forecast, by Application 2019 & 2032
- Table 24: Spain Disposal of Abandoned Sharp Items Revenue (million) Forecast, by Application 2019 & 2032
- Table 25: Russia Disposal of Abandoned Sharp Items Revenue (million) Forecast, by Application 2019 & 2032
- Table 26: Benelux Disposal of Abandoned Sharp Items Revenue (million) Forecast, by Application 2019 & 2032
- Table 27: Nordics Disposal of Abandoned Sharp Items Revenue (million) Forecast, by Application 2019 & 2032
- Table 28: Rest of Europe Disposal of Abandoned Sharp Items Revenue (million) Forecast, by Application 2019 & 2032
- Table 29: Global Disposal of Abandoned Sharp Items Revenue million Forecast, by Application 2019 & 2032
- Table 30: Global Disposal of Abandoned Sharp Items Revenue million Forecast, by Types 2019 & 2032
- Table 31: Global Disposal of Abandoned Sharp Items Revenue million Forecast, by Country 2019 & 2032
- Table 32: Turkey Disposal of Abandoned Sharp Items Revenue (million) Forecast, by Application 2019 & 2032
- Table 33: Israel Disposal of Abandoned Sharp Items Revenue (million) Forecast, by Application 2019 & 2032
- Table 34: GCC Disposal of Abandoned Sharp Items Revenue (million) Forecast, by Application 2019 & 2032
- Table 35: North Africa Disposal of Abandoned Sharp Items Revenue (million) Forecast, by Application 2019 & 2032
- Table 36: South Africa Disposal of Abandoned Sharp Items Revenue (million) Forecast, by Application 2019 & 2032
- Table 37: Rest of Middle East & Africa Disposal of Abandoned Sharp Items Revenue (million) Forecast, by Application 2019 & 2032
- Table 38: Global Disposal of Abandoned Sharp Items Revenue million Forecast, by Application 2019 & 2032
- Table 39: Global Disposal of Abandoned Sharp Items Revenue million Forecast, by Types 2019 & 2032
- Table 40: Global Disposal of Abandoned Sharp Items Revenue million Forecast, by Country 2019 & 2032
- Table 41: China Disposal of Abandoned Sharp Items Revenue (million) Forecast, by Application 2019 & 2032
- Table 42: India Disposal of Abandoned Sharp Items Revenue (million) Forecast, by Application 2019 & 2032
- Table 43: Japan Disposal of Abandoned Sharp Items Revenue (million) Forecast, by Application 2019 & 2032
- Table 44: South Korea Disposal of Abandoned Sharp Items Revenue (million) Forecast, by Application 2019 & 2032
- Table 45: ASEAN Disposal of Abandoned Sharp Items Revenue (million) Forecast, by Application 2019 & 2032
- Table 46: Oceania Disposal of Abandoned Sharp Items Revenue (million) Forecast, by Application 2019 & 2032
- Table 47: Rest of Asia Pacific Disposal of Abandoned Sharp Items Revenue (million) Forecast, by Application 2019 & 2032
Frequently Asked Questions
1. What is the projected Compound Annual Growth Rate (CAGR) of the Disposal of Abandoned Sharp Items?
The projected CAGR is approximately XX%.
2. Which companies are prominent players in the Disposal of Abandoned Sharp Items?
Key companies in the market include Stericycle, Waste Management, Veolia, Remondis, Clean Harbors, Cleanaway, Sharps Medical Waste Services, Daniels Health, Republic Services, Logistics Recycling, Biffa, MCF Environmental, MedPro Disposal, ECS Cares.
3. What are the main segments of the Disposal of Abandoned Sharp Items?
The market segments include Application, Types.
4. Can you provide details about the market size?
The market size is estimated to be USD XXX million as of 2022.
5. What are some drivers contributing to market growth?
N/A
6. What are the notable trends driving market growth?
N/A
7. Are there any restraints impacting market growth?
N/A
8. Can you provide examples of recent developments in the market?
N/A
9. What pricing options are available for accessing the report?
Pricing options include single-user, multi-user, and enterprise licenses priced at USD 2900.00, USD 4350.00, and USD 5800.00 respectively.
10. Is the market size provided in terms of value or volume?
The market size is provided in terms of value, measured in million.
11. Are there any specific market keywords associated with the report?
Yes, the market keyword associated with the report is "Disposal of Abandoned Sharp Items," which aids in identifying and referencing the specific market segment covered.
12. How do I determine which pricing option suits my needs best?
The pricing options vary based on user requirements and access needs. Individual users may opt for single-user licenses, while businesses requiring broader access may choose multi-user or enterprise licenses for cost-effective access to the report.
13. Are there any additional resources or data provided in the Disposal of Abandoned Sharp Items report?
While the report offers comprehensive insights, it's advisable to review the specific contents or supplementary materials provided to ascertain if additional resources or data are available.
14. How can I stay updated on further developments or reports in the Disposal of Abandoned Sharp Items?
To stay informed about further developments, trends, and reports in the Disposal of Abandoned Sharp Items, consider subscribing to industry newsletters, following relevant companies and organizations, or regularly checking reputable industry news sources and publications.
Methodology
Step 1 - Identification of Relevant Samples Size from Population Database


Step 2 - Approaches for Defining Global Market Size (Value, Volume* & Price*)

Note*: In applicable scenarios
Step 3 - Data Sources
Primary Research
- Web Analytics
- Survey Reports
- Research Institute
- Latest Research Reports
- Opinion Leaders
Secondary Research
- Annual Reports
- White Paper
- Latest Press Release
- Industry Association
- Paid Database
- Investor Presentations

Step 4 - Data Triangulation
Involves using different sources of information in order to increase the validity of a study
These sources are likely to be stakeholders in a program - participants, other researchers, program staff, other community members, and so on.
Then we put all data in single framework & apply various statistical tools to find out the dynamic on the market.
During the analysis stage, feedback from the stakeholder groups would be compared to determine areas of agreement as well as areas of divergence
