

Key Insights
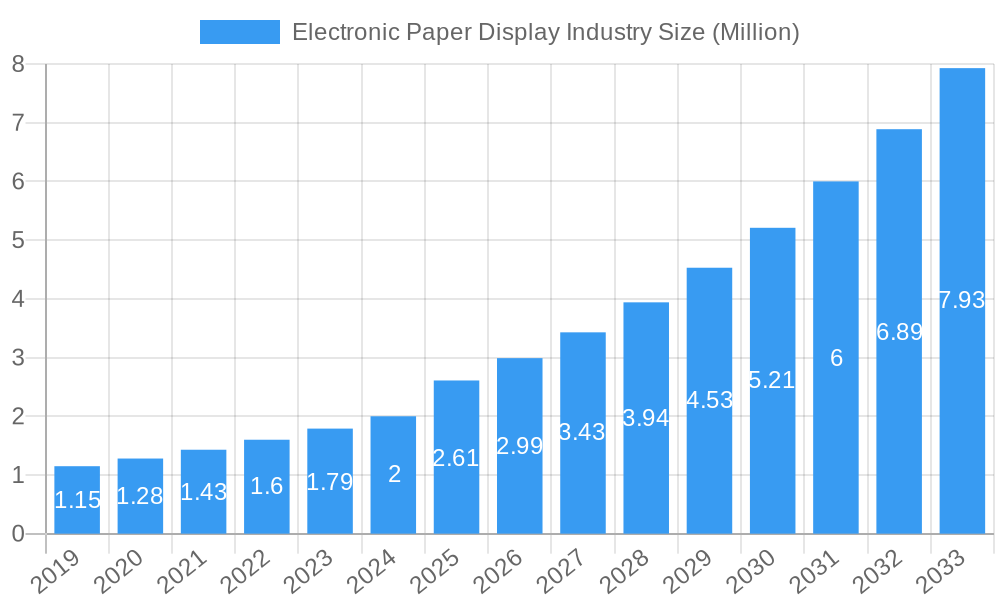
The Electronic Paper Display (EPD) industry is poised for significant expansion, projected to reach an estimated market size of $2.61 billion by 2025, with a robust Compound Annual Growth Rate (CAGR) of 14.54% expected to propel it through 2033. This impressive growth is primarily fueled by the escalating demand for energy-efficient and visually appealing display solutions across a multitude of applications. The inherent benefits of EPD technology, such as exceptionally low power consumption, superior readability in direct sunlight, and a paper-like aesthetic, are driving its adoption in sectors where battery life and visual clarity are paramount. Key market drivers include the burgeoning e-reader market, the increasing integration of EPDs in smart wearables and IoT devices, and the growing preference for sustainable and eco-friendly display alternatives in consumer electronics and industrial signage. Furthermore, the expanding use of EPDs in retail for dynamic pricing, electronic shelf labels (ESLs), and promotional displays is a significant growth catalyst, offering businesses enhanced operational efficiency and improved customer engagement.
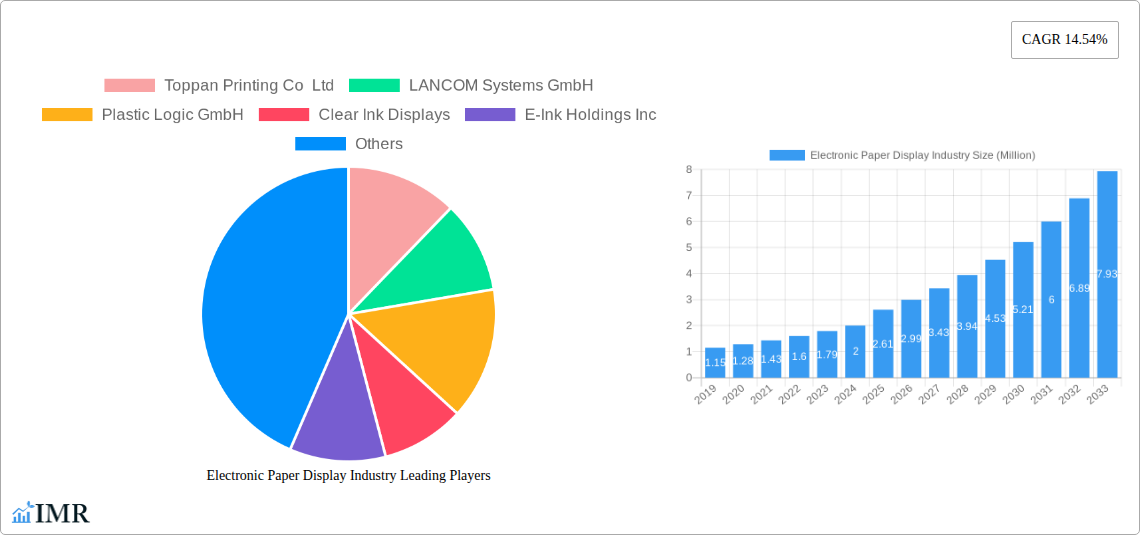
Electronic Paper Display Industry Market Size (In Million)
The EPD market exhibits diverse segmentation, catering to a broad spectrum of end-users. The consumer segment, encompassing e-readers and smart devices, continues to be a dominant force. However, significant growth is anticipated from institutional applications, including dynamic signage for public spaces, transportation hubs, and educational institutions, where real-time information updates and low maintenance are critical. The retail sector's embrace of EPDs for electronic shelf displays and in-store advertising presents a substantial opportunity, enabling retailers to optimize inventory management and personalize customer experiences. While the market is characterized by strong growth, potential restraints include the higher initial cost compared to traditional LCD displays and limitations in refresh rates for rapidly changing content, although ongoing technological advancements are steadily addressing these challenges. Leading companies in this dynamic landscape, such as E-Ink Holdings Inc., Toppan Printing Co. Ltd., and Plastic Logic GmbH, are at the forefront of innovation, driving product development and expanding market reach. Geographically, North America and Europe are currently leading the adoption, but Asia is anticipated to witness rapid growth due to its strong manufacturing base and increasing consumer demand for advanced electronic products.
Electronic Paper Display Industry Company Market Share
Electronic Paper Display Industry Market Analysis 2019-2033: Growth, Trends, and Key Players
This comprehensive report provides an in-depth analysis of the electronic paper display (EPD) industry, a rapidly evolving sector driven by advancements in e-paper technology and increasing demand for energy-efficient and eye-friendly displays. Covering the study period from 2019 to 2033, with a base year of 2025 and a forecast period of 2025–2033, this report offers actionable insights for industry stakeholders. We analyze the global EPD market size, growth trends, technological innovations, competitive landscape, and emerging opportunities, presenting all values in million units for clarity. Our analysis includes both the parent Electronic Paper Display market and its crucial child markets, such as displays for signage, retail, and consumer electronics.
Electronic Paper Display Industry Market Dynamics & Structure
The electronic paper display market is characterized by a dynamic interplay of technological innovation, evolving end-user preferences, and strategic partnerships. Market concentration is influenced by a few key players who dominate research and development and large-scale manufacturing. Technological innovation, particularly in color e-paper and faster refresh rates, acts as a significant driver, pushing the boundaries of application possibilities. Regulatory frameworks, while less prominent than in some other tech sectors, can indirectly influence adoption through environmental mandates favoring energy efficiency. Competitive product substitutes, primarily LCD and OLED, present a constant challenge, pushing EPD manufacturers to highlight their unique advantages of low power consumption and superior readability in bright light. End-user demographics are shifting, with increasing adoption in institutional and retail settings complementing the established consumer electronics segment. Mergers and acquisitions (M&A) are infrequent but significant, often consolidating specialized technological expertise or expanding market reach.
- Market Concentration: Dominated by a few leading EPD manufacturers and technology providers.
- Technological Innovation Drivers: Advancements in color e-paper, faster refresh rates, and improved durability.
- Regulatory Frameworks: Indirect influence through energy efficiency standards and e-waste reduction initiatives.
- Competitive Product Substitutes: LCD and OLED displays, particularly in applications where color and dynamic content are paramount.
- End-User Demographics: Growing demand from retail (Electronic Shelf Labels - ESLs), institutional signage, and industrial applications, alongside traditional e-readers.
- M&A Trends: Strategic acquisitions to gain intellectual property or market access in niche segments.
Electronic Paper Display Industry Growth Trends & Insights
The electronic paper display industry is poised for significant expansion, driven by a confluence of technological advancements, shifting consumer preferences towards sustainable and user-friendly technology, and the increasing penetration of e-paper solutions across diverse applications. The market size evolution is projected to witness a robust Compound Annual Growth Rate (CAGR) over the forecast period. This growth is fueled by accelerating adoption rates in sectors like retail, where Electronic Shelf Labels (ESLs) are revolutionizing inventory management and customer engagement, and in institutional signage, where e-paper offers a low-power, dynamic alternative to static displays. Technological disruptions, such as the development of flexible and foldable e-paper, are further broadening application horizons. Consumer behavior shifts are playing a crucial role, with a growing emphasis on reducing eye strain from digital screens and a preference for products that offer extended battery life. The inherent advantages of e-paper – its paper-like appearance, bistable nature (requiring power only to change images), and excellent sunlight readability – are increasingly recognized and valued. This makes e-paper an attractive solution for a wide range of devices, from e-readers and smartwatches to digital signage and IoT devices. The parent Electronic Paper Display market is experiencing a ripple effect from the innovation and growth within its child markets. For instance, the widespread adoption of ESLs in the retail child market directly contributes to the overall demand and technological maturation of the parent market. Similarly, advancements in institutional signage are creating new avenues for growth and driving the development of larger, more sophisticated e-paper solutions.
Dominant Regions, Countries, or Segments in Electronic Paper Display Industry
The Electronic Paper Display industry is experiencing significant growth, with a particular dominance observed in specific regions and end-user segments. Asia-Pacific, driven by strong manufacturing capabilities and burgeoning demand from its vast consumer and industrial markets, is a leading region. Countries within this region are at the forefront of both production and adoption of e-paper technology. The Retail (Dividers and Electronic Shelf Displays) segment is emerging as a key driver of market growth, due to the transformative impact of ESLs. These digital labels offer retailers unparalleled flexibility in price management, product information updates, and promotional campaigns, leading to substantial operational efficiencies and enhanced customer experiences. The Institutional (Signage, Posters, etc.) segment is also showing considerable traction. E-paper signage is ideal for public spaces, transportation hubs, and educational institutions due to its low power consumption, readability in various lighting conditions, and ability to display dynamic content without constant energy expenditure. The Consumer segment, historically driven by e-readers, continues to be a strong contributor, with an increasing variety of consumer electronics incorporating e-paper for specific functionalities that benefit from its unique display characteristics. The Other En segment, encompassing industrial applications, smart labels, and wearables, represents a rapidly expanding frontier with immense potential. The dominance of these segments is bolstered by supportive economic policies, investments in technological infrastructure, and a growing awareness of the environmental benefits of low-power display solutions. For example, government initiatives promoting smart city development and digital transformation are indirectly fueling the demand for e-paper in signage and information display applications. The increasing market share of the retail segment, particularly with the widespread deployment of ESLs, directly translates into higher unit sales and revenue for the overall EPD market. This segment's growth potential is further amplified by the ongoing digital transformation in the retail sector globally, making it a crucial child market for the broader EPD industry.
Electronic Paper Display Industry Product Landscape
The electronic paper display industry is characterized by a diverse and innovative product landscape. Key innovations include the advancement of color e-paper technologies, offering richer visual experiences without compromising on power efficiency. Faster refresh rates are enabling more dynamic content display, expanding applications beyond static information. Performance metrics like ultra-low power consumption, exceptional readability in direct sunlight, and a paper-like visual experience remain core unique selling propositions. These technological advancements are enabling novel applications in e-readers, smartwatches, digital signage, Electronic Shelf Labels (ESLs), smart cards, and industrial control panels.
Key Drivers, Barriers & Challenges in Electronic Paper Display Industry
The electronic paper display industry is propelled by several key drivers, including the increasing demand for energy-efficient and sustainable display technologies, the growing adoption of ESLs in retail for dynamic pricing and inventory management, and the desire for reduced eye strain in consumer electronics. Technological advancements in color e-paper and faster refresh rates are also significant growth accelerators.
However, the industry faces several barriers and challenges. The high initial manufacturing costs compared to traditional displays can be a restraint, particularly for large-format applications. The limited refresh rate, while improving, still poses a challenge for video-intensive content. Supply chain issues, though less pronounced now, can impact production volumes. Furthermore, the continued dominance of LCD and OLED in certain high-performance display markets creates competitive pressure.
Emerging Opportunities in Electronic Paper Display Industry
Emerging opportunities in the electronic paper display industry lie in untapped markets and innovative applications. The burgeoning Internet of Things (IoT) sector presents a significant avenue, with e-paper ideal for low-power sensors and smart devices requiring persistent displays. The development of flexible and durable e-paper opens doors for wearable technology and conformable displays. Evolving consumer preferences for personalized and sustainable products also create opportunities for e-paper in smart home devices and educational tools.
Growth Accelerators in the Electronic Paper Display Industry Industry
Key catalysts driving long-term growth in the electronic paper display industry include ongoing technological breakthroughs in color saturation, response times, and durability. Strategic partnerships between EPD manufacturers and leading technology companies, like the collaboration between E Ink Holdings and Sharp Corporation for ePaper posters, are crucial for expanding market reach and developing innovative solutions. Market expansion strategies targeting new application areas, such as smart packaging and reusable digital labels, will also significantly contribute to sustained growth.
Key Players Shaping the Electronic Paper Display Industry Market
- Toppan Printing Co Ltd
- LANCOM Systems GmbH
- Plastic Logic GmbH
- Clear Ink Displays
- E-Ink Holdings Inc
- Guangzhou Oed Technologies Co Ltd
- Pervasive Displays Inc
- Microtips Technology
- Adafruit Industries
Notable Milestones in Electronic Paper Display Industry Sector
- March 2023: E Ink Holdings Inc. and Sharp Corporation announced a partnership to bring ePaper posters employing E Ink's technology to market, signaling a significant move into the digital signage sector.
- June 2022: Boston-based company Modos revealed its development of a paper laptop, replacing traditional screens with large electronic paper displays to offer advantages like long battery life, reduced eye strain, and superior outdoor visibility, targeting text-focused computing tasks.
In-Depth Electronic Paper Display Industry Market Outlook
The Electronic Paper Display industry is set for a promising future, driven by continued technological advancements and the increasing demand for energy-efficient and user-friendly displays. Growth accelerators like the expansion of e-paper in the child market of retail ESLs, coupled with its growing adoption in institutional signage and the expanding IoT landscape, will fuel market expansion. Strategic partnerships and ongoing innovation in areas such as color fidelity and refresh rates are expected to unlock new applications and solidify e-paper's position as a vital display technology for a more sustainable and visually comfortable digital future. The parent Electronic Paper Display market is anticipated to benefit immensely from these developments, leading to sustained growth and increased market penetration across various sectors.
Electronic Paper Display Industry Segmentation
-
1. End User
- 1.1. Consumer
- 1.2. Institutional (Signage, Posters, etc.)
- 1.3. Retail (Dividers and Electronic Shelf Displays)
- 1.4. Other En
Electronic Paper Display Industry Segmentation By Geography
- 1. North America
- 2. Europe
- 3. Asia
- 4. Australia and New Zealand
- 5. Latin America
- 6. Middle East and Africa
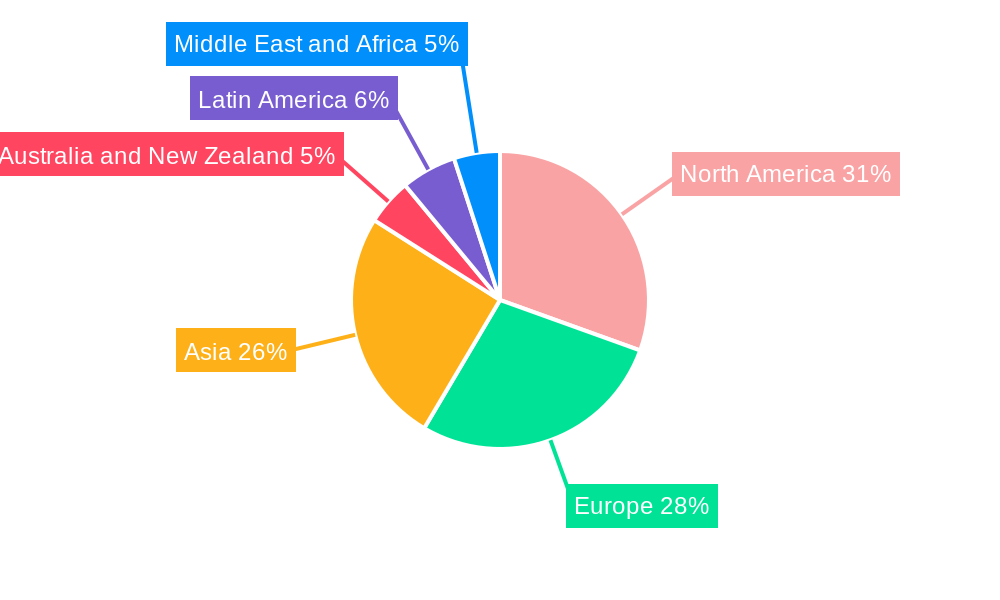
Electronic Paper Display Industry Regional Market Share
Geographic Coverage of Electronic Paper Display Industry
Electronic Paper Display Industry REPORT HIGHLIGHTS
| Aspects | Details |
|---|---|
| Study Period | 2020-2034 |
| Base Year | 2025 |
| Estimated Year | 2026 |
| Forecast Period | 2026-2034 |
| Historical Period | 2020-2025 |
| Growth Rate | CAGR of 14.54% from 2020-2034 |
| Segmentation |
|
Table of Contents
- 1. Introduction
- 1.1. Research Scope
- 1.2. Market Segmentation
- 1.3. Research Methodology
- 1.4. Definitions and Assumptions
- 2. Executive Summary
- 2.1. Introduction
- 3. Market Dynamics
- 3.1. Introduction
- 3.2. Market Drivers
- 3.2.1. Technological Innovations in the Field of E-displays; Growing Applications of E-display Across Various End-user Industries
- 3.3. Market Restrains
- 3.3.1. Relatively Low Levels of Awareness and Regulatory Challenges
- 3.4. Market Trends
- 3.4.1. The Consumer Electronics Industry is Expected to Hold Significant Market Share
- 4. Market Factor Analysis
- 4.1. Porters Five Forces
- 4.2. Supply/Value Chain
- 4.3. PESTEL analysis
- 4.4. Market Entropy
- 4.5. Patent/Trademark Analysis
- 5. Global Electronic Paper Display Industry Analysis, Insights and Forecast, 2020-2032
- 5.1. Market Analysis, Insights and Forecast - by End User
- 5.1.1. Consumer
- 5.1.2. Institutional (Signage, Posters, etc.)
- 5.1.3. Retail (Dividers and Electronic Shelf Displays)
- 5.1.4. Other En
- 5.2. Market Analysis, Insights and Forecast - by Region
- 5.2.1. North America
- 5.2.2. Europe
- 5.2.3. Asia
- 5.2.4. Australia and New Zealand
- 5.2.5. Latin America
- 5.2.6. Middle East and Africa
- 5.1. Market Analysis, Insights and Forecast - by End User
- 6. North America Electronic Paper Display Industry Analysis, Insights and Forecast, 2020-2032
- 6.1. Market Analysis, Insights and Forecast - by End User
- 6.1.1. Consumer
- 6.1.2. Institutional (Signage, Posters, etc.)
- 6.1.3. Retail (Dividers and Electronic Shelf Displays)
- 6.1.4. Other En
- 6.1. Market Analysis, Insights and Forecast - by End User
- 7. Europe Electronic Paper Display Industry Analysis, Insights and Forecast, 2020-2032
- 7.1. Market Analysis, Insights and Forecast - by End User
- 7.1.1. Consumer
- 7.1.2. Institutional (Signage, Posters, etc.)
- 7.1.3. Retail (Dividers and Electronic Shelf Displays)
- 7.1.4. Other En
- 7.1. Market Analysis, Insights and Forecast - by End User
- 8. Asia Electronic Paper Display Industry Analysis, Insights and Forecast, 2020-2032
- 8.1. Market Analysis, Insights and Forecast - by End User
- 8.1.1. Consumer
- 8.1.2. Institutional (Signage, Posters, etc.)
- 8.1.3. Retail (Dividers and Electronic Shelf Displays)
- 8.1.4. Other En
- 8.1. Market Analysis, Insights and Forecast - by End User
- 9. Australia and New Zealand Electronic Paper Display Industry Analysis, Insights and Forecast, 2020-2032
- 9.1. Market Analysis, Insights and Forecast - by End User
- 9.1.1. Consumer
- 9.1.2. Institutional (Signage, Posters, etc.)
- 9.1.3. Retail (Dividers and Electronic Shelf Displays)
- 9.1.4. Other En
- 9.1. Market Analysis, Insights and Forecast - by End User
- 10. Latin America Electronic Paper Display Industry Analysis, Insights and Forecast, 2020-2032
- 10.1. Market Analysis, Insights and Forecast - by End User
- 10.1.1. Consumer
- 10.1.2. Institutional (Signage, Posters, etc.)
- 10.1.3. Retail (Dividers and Electronic Shelf Displays)
- 10.1.4. Other En
- 10.1. Market Analysis, Insights and Forecast - by End User
- 11. Middle East and Africa Electronic Paper Display Industry Analysis, Insights and Forecast, 2020-2032
- 11.1. Market Analysis, Insights and Forecast - by End User
- 11.1.1. Consumer
- 11.1.2. Institutional (Signage, Posters, etc.)
- 11.1.3. Retail (Dividers and Electronic Shelf Displays)
- 11.1.4. Other En
- 11.1. Market Analysis, Insights and Forecast - by End User
- 12. Competitive Analysis
- 12.1. Global Market Share Analysis 2025
- 12.2. Company Profiles
- 12.2.1 Toppan Printing Co Ltd
- 12.2.1.1. Overview
- 12.2.1.2. Products
- 12.2.1.3. SWOT Analysis
- 12.2.1.4. Recent Developments
- 12.2.1.5. Financials (Based on Availability)
- 12.2.2 LANCOM Systems GmbH
- 12.2.2.1. Overview
- 12.2.2.2. Products
- 12.2.2.3. SWOT Analysis
- 12.2.2.4. Recent Developments
- 12.2.2.5. Financials (Based on Availability)
- 12.2.3 Plastic Logic GmbH
- 12.2.3.1. Overview
- 12.2.3.2. Products
- 12.2.3.3. SWOT Analysis
- 12.2.3.4. Recent Developments
- 12.2.3.5. Financials (Based on Availability)
- 12.2.4 Clear Ink Displays
- 12.2.4.1. Overview
- 12.2.4.2. Products
- 12.2.4.3. SWOT Analysis
- 12.2.4.4. Recent Developments
- 12.2.4.5. Financials (Based on Availability)
- 12.2.5 E-Ink Holdings Inc
- 12.2.5.1. Overview
- 12.2.5.2. Products
- 12.2.5.3. SWOT Analysis
- 12.2.5.4. Recent Developments
- 12.2.5.5. Financials (Based on Availability)
- 12.2.6 Guangzhou Oed Technologies Co Ltd
- 12.2.6.1. Overview
- 12.2.6.2. Products
- 12.2.6.3. SWOT Analysis
- 12.2.6.4. Recent Developments
- 12.2.6.5. Financials (Based on Availability)
- 12.2.7 Pervasive Displays Inc
- 12.2.7.1. Overview
- 12.2.7.2. Products
- 12.2.7.3. SWOT Analysis
- 12.2.7.4. Recent Developments
- 12.2.7.5. Financials (Based on Availability)
- 12.2.8 Microtips Technolog
- 12.2.8.1. Overview
- 12.2.8.2. Products
- 12.2.8.3. SWOT Analysis
- 12.2.8.4. Recent Developments
- 12.2.8.5. Financials (Based on Availability)
- 12.2.9 Adafruit Industries
- 12.2.9.1. Overview
- 12.2.9.2. Products
- 12.2.9.3. SWOT Analysis
- 12.2.9.4. Recent Developments
- 12.2.9.5. Financials (Based on Availability)
- 12.2.1 Toppan Printing Co Ltd
List of Figures
- Figure 1: Global Electronic Paper Display Industry Revenue Breakdown (Million, %) by Region 2025 & 2033
- Figure 2: North America Electronic Paper Display Industry Revenue (Million), by End User 2025 & 2033
- Figure 3: North America Electronic Paper Display Industry Revenue Share (%), by End User 2025 & 2033
- Figure 4: North America Electronic Paper Display Industry Revenue (Million), by Country 2025 & 2033
- Figure 5: North America Electronic Paper Display Industry Revenue Share (%), by Country 2025 & 2033
- Figure 6: Europe Electronic Paper Display Industry Revenue (Million), by End User 2025 & 2033
- Figure 7: Europe Electronic Paper Display Industry Revenue Share (%), by End User 2025 & 2033
- Figure 8: Europe Electronic Paper Display Industry Revenue (Million), by Country 2025 & 2033
- Figure 9: Europe Electronic Paper Display Industry Revenue Share (%), by Country 2025 & 2033
- Figure 10: Asia Electronic Paper Display Industry Revenue (Million), by End User 2025 & 2033
- Figure 11: Asia Electronic Paper Display Industry Revenue Share (%), by End User 2025 & 2033
- Figure 12: Asia Electronic Paper Display Industry Revenue (Million), by Country 2025 & 2033
- Figure 13: Asia Electronic Paper Display Industry Revenue Share (%), by Country 2025 & 2033
- Figure 14: Australia and New Zealand Electronic Paper Display Industry Revenue (Million), by End User 2025 & 2033
- Figure 15: Australia and New Zealand Electronic Paper Display Industry Revenue Share (%), by End User 2025 & 2033
- Figure 16: Australia and New Zealand Electronic Paper Display Industry Revenue (Million), by Country 2025 & 2033
- Figure 17: Australia and New Zealand Electronic Paper Display Industry Revenue Share (%), by Country 2025 & 2033
- Figure 18: Latin America Electronic Paper Display Industry Revenue (Million), by End User 2025 & 2033
- Figure 19: Latin America Electronic Paper Display Industry Revenue Share (%), by End User 2025 & 2033
- Figure 20: Latin America Electronic Paper Display Industry Revenue (Million), by Country 2025 & 2033
- Figure 21: Latin America Electronic Paper Display Industry Revenue Share (%), by Country 2025 & 2033
- Figure 22: Middle East and Africa Electronic Paper Display Industry Revenue (Million), by End User 2025 & 2033
- Figure 23: Middle East and Africa Electronic Paper Display Industry Revenue Share (%), by End User 2025 & 2033
- Figure 24: Middle East and Africa Electronic Paper Display Industry Revenue (Million), by Country 2025 & 2033
- Figure 25: Middle East and Africa Electronic Paper Display Industry Revenue Share (%), by Country 2025 & 2033
List of Tables
- Table 1: Global Electronic Paper Display Industry Revenue Million Forecast, by End User 2020 & 2033
- Table 2: Global Electronic Paper Display Industry Revenue Million Forecast, by Region 2020 & 2033
- Table 3: Global Electronic Paper Display Industry Revenue Million Forecast, by End User 2020 & 2033
- Table 4: Global Electronic Paper Display Industry Revenue Million Forecast, by Country 2020 & 2033
- Table 5: Global Electronic Paper Display Industry Revenue Million Forecast, by End User 2020 & 2033
- Table 6: Global Electronic Paper Display Industry Revenue Million Forecast, by Country 2020 & 2033
- Table 7: Global Electronic Paper Display Industry Revenue Million Forecast, by End User 2020 & 2033
- Table 8: Global Electronic Paper Display Industry Revenue Million Forecast, by Country 2020 & 2033
- Table 9: Global Electronic Paper Display Industry Revenue Million Forecast, by End User 2020 & 2033
- Table 10: Global Electronic Paper Display Industry Revenue Million Forecast, by Country 2020 & 2033
- Table 11: Global Electronic Paper Display Industry Revenue Million Forecast, by End User 2020 & 2033
- Table 12: Global Electronic Paper Display Industry Revenue Million Forecast, by Country 2020 & 2033
- Table 13: Global Electronic Paper Display Industry Revenue Million Forecast, by End User 2020 & 2033
- Table 14: Global Electronic Paper Display Industry Revenue Million Forecast, by Country 2020 & 2033
Frequently Asked Questions
1. What is the projected Compound Annual Growth Rate (CAGR) of the Electronic Paper Display Industry?
The projected CAGR is approximately 14.54%.
2. Which companies are prominent players in the Electronic Paper Display Industry?
Key companies in the market include Toppan Printing Co Ltd, LANCOM Systems GmbH, Plastic Logic GmbH, Clear Ink Displays, E-Ink Holdings Inc, Guangzhou Oed Technologies Co Ltd, Pervasive Displays Inc, Microtips Technolog, Adafruit Industries.
3. What are the main segments of the Electronic Paper Display Industry?
The market segments include End User.
4. Can you provide details about the market size?
The market size is estimated to be USD 2.61 Million as of 2022.
5. What are some drivers contributing to market growth?
Technological Innovations in the Field of E-displays; Growing Applications of E-display Across Various End-user Industries.
6. What are the notable trends driving market growth?
The Consumer Electronics Industry is Expected to Hold Significant Market Share.
7. Are there any restraints impacting market growth?
Relatively Low Levels of Awareness and Regulatory Challenges.
8. Can you provide examples of recent developments in the market?
March 2023: E Ink Holdings Inc., the creator, pioneer, and one of the global commercial leaders in ePaper technology, and Sharp Corporation, one of the leading global companies in the digital signage sector, announced a partnership to bring ePaper posters employing E Ink's technology to market.
9. What pricing options are available for accessing the report?
Pricing options include single-user, multi-user, and enterprise licenses priced at USD 4750, USD 5250, and USD 8750 respectively.
10. Is the market size provided in terms of value or volume?
The market size is provided in terms of value, measured in Million.
11. Are there any specific market keywords associated with the report?
Yes, the market keyword associated with the report is "Electronic Paper Display Industry," which aids in identifying and referencing the specific market segment covered.
12. How do I determine which pricing option suits my needs best?
The pricing options vary based on user requirements and access needs. Individual users may opt for single-user licenses, while businesses requiring broader access may choose multi-user or enterprise licenses for cost-effective access to the report.
13. Are there any additional resources or data provided in the Electronic Paper Display Industry report?
While the report offers comprehensive insights, it's advisable to review the specific contents or supplementary materials provided to ascertain if additional resources or data are available.
14. How can I stay updated on further developments or reports in the Electronic Paper Display Industry?
To stay informed about further developments, trends, and reports in the Electronic Paper Display Industry, consider subscribing to industry newsletters, following relevant companies and organizations, or regularly checking reputable industry news sources and publications.
Methodology
Step 1 - Identification of Relevant Samples Size from Population Database


Step 2 - Approaches for Defining Global Market Size (Value, Volume* & Price*)

Note*: In applicable scenarios
Step 3 - Data Sources
Primary Research
- Web Analytics
- Survey Reports
- Research Institute
- Latest Research Reports
- Opinion Leaders
Secondary Research
- Annual Reports
- White Paper
- Latest Press Release
- Industry Association
- Paid Database
- Investor Presentations

Step 4 - Data Triangulation
Involves using different sources of information in order to increase the validity of a study
These sources are likely to be stakeholders in a program - participants, other researchers, program staff, other community members, and so on.
Then we put all data in single framework & apply various statistical tools to find out the dynamic on the market.
During the analysis stage, feedback from the stakeholder groups would be compared to determine areas of agreement as well as areas of divergence