

Key Insights
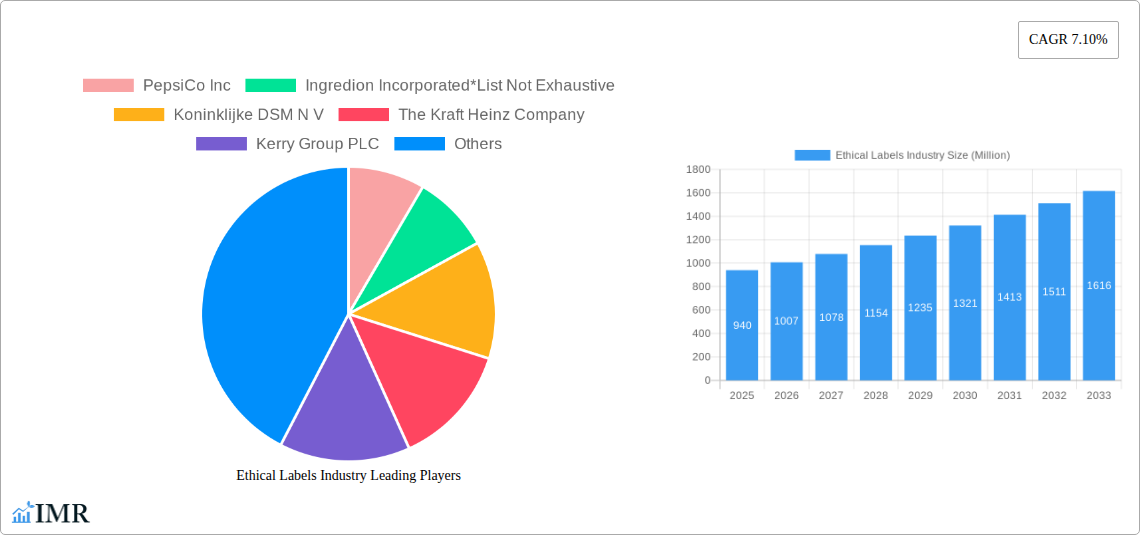
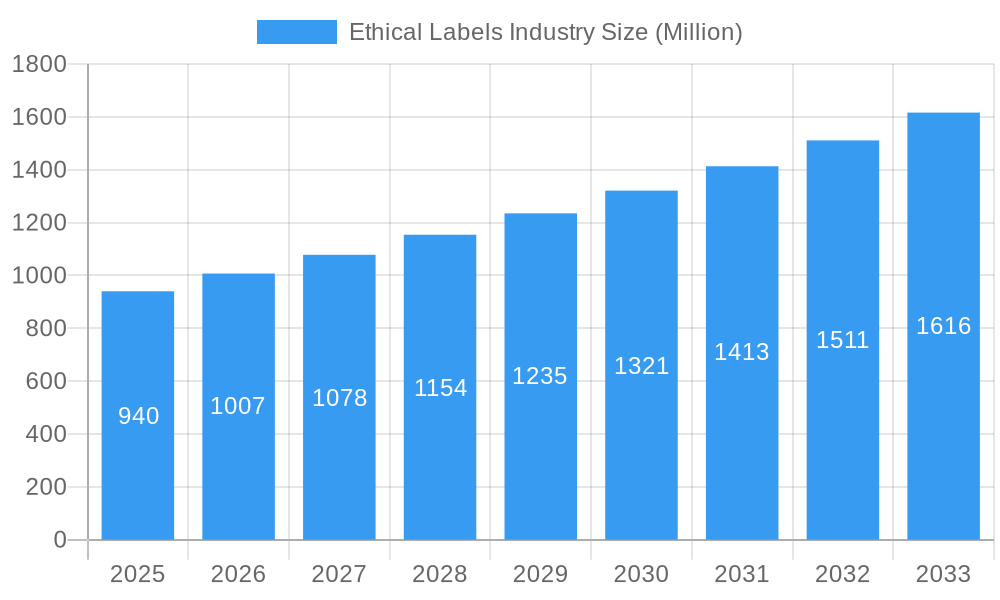
The ethical labels market, valued at $0.94 billion in 2025, is projected to experience robust growth, driven by increasing consumer awareness of ethical sourcing and sustainable practices. A compound annual growth rate (CAGR) of 7.10% from 2025 to 2033 indicates a significant expansion, with the market expected to reach approximately $1.8 billion by 2033. This growth is fueled by several key drivers: the rising demand for organic and sustainably produced goods, the growing popularity of vegan and plant-based products, and a heightened focus on animal welfare. Consumers are increasingly scrutinizing product labels, seeking certifications that guarantee ethical sourcing, fair labor practices, and environmental responsibility. This heightened consumer awareness is pushing manufacturers to adopt and prominently display ethical labels, creating a positive feedback loop for market expansion. Segmentation within the market shows significant potential across various label types (Halal, Organic, Clean, Sustainability and Fairtrade labels, Animal Welfare Labels, Vegan Labels) and product types (Food, Beverages). The online distribution channel is expected to witness faster growth compared to the offline channel, mirroring the broader e-commerce trend. Major players like PepsiCo, Ingredion, DSM, Kraft Heinz, and Cargill are actively investing in and integrating ethical sourcing and labeling into their supply chains, signifying the industry's long-term viability.
Ethical Labels Industry Market Size (In Million)
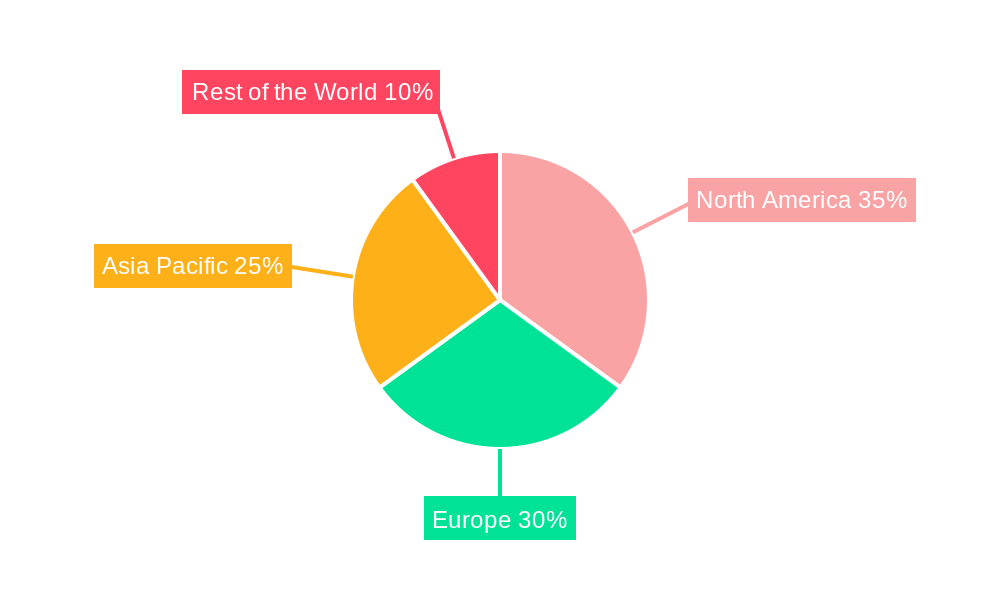
The market's growth is, however, subject to certain restraints. The cost of obtaining and maintaining ethical certifications can be high for smaller manufacturers, potentially limiting their participation. Furthermore, "greenwashing"—the practice of making misleading or unsubstantiated claims about the environmental benefits of products—poses a challenge to consumer trust and could hinder market expansion. Nevertheless, the overall trend points towards continued growth, particularly in regions like North America and Europe, where consumer awareness and purchasing power are high. The Asia-Pacific region, with its expanding middle class and increasing awareness of ethical consumption, presents a significant growth opportunity in the coming years. Successful navigation of regulatory challenges and maintaining transparency in labeling practices will be crucial for sustained market growth.
Ethical Labels Industry Company Market Share
Ethical Labels Industry Market Report: 2019-2033
This comprehensive report provides a detailed analysis of the Ethical Labels industry, encompassing market dynamics, growth trends, regional dominance, product landscape, and key players. With a study period spanning 2019-2033, a base year of 2025, and a forecast period of 2025-2033, this report offers invaluable insights for industry professionals, investors, and stakeholders. The report leverages extensive data analysis to provide a thorough understanding of this rapidly evolving market, focusing on parent markets (e.g., food and beverage industries) and their child markets (e.g., organic food, vegan beverages). The total market size in 2025 is estimated to be xx Million.
Ethical Labels Industry Market Dynamics & Structure
The Ethical Labels industry is characterized by a moderately concentrated market structure, with key players like PepsiCo Inc, Ingredion Incorporated, Koninklijke DSM N.V., The Kraft Heinz Company, Kerry Group PLC, Cargill Inc, Go Macro LLC, Archer-Daniels-Midland Company, Garden of Life (Nestlé S.A), and The Hershey Company holding significant market share. However, the increasing number of smaller, niche players signifies a dynamic competitive landscape. Technological innovation, particularly in traceability and certification technologies, is a key driver. Stringent regulatory frameworks, varying across regions, influence market dynamics. Consumer demand for ethically sourced products is a significant growth catalyst.
- Market Concentration: Moderately concentrated, with top players holding xx% market share in 2025.
- Technological Innovation: Blockchain technology for traceability and AI-driven verification systems are driving efficiency and trust.
- Regulatory Frameworks: Varying regulations across regions create both opportunities and challenges for market expansion.
- Competitive Substitutes: Conventional labels and lack of clear standardization pose a challenge.
- End-User Demographics: Growing awareness of ethical consumption among millennials and Gen Z is a key driver.
- M&A Trends: A moderate volume of mergers and acquisitions (xx deals in 2024) is observed, indicating industry consolidation.
Ethical Labels Industry Growth Trends & Insights
The Ethical Labels industry exhibits robust growth, driven by escalating consumer demand for ethically produced goods and heightened environmental awareness. Market size is projected to reach xx Million by 2033, showcasing a Compound Annual Growth Rate (CAGR) of xx% during the forecast period. Increased adoption of ethical labels across various product categories, coupled with technological advancements, fuels this expansion. Consumer behavior is shifting towards preference for transparency and sustainability, directly impacting demand.
The rise of online retail and e-commerce platforms further accelerates growth by offering wider product accessibility and detailed information on ethical sourcing. Technological disruptions like blockchain-based traceability systems significantly enhance consumer trust and drive adoption. Market penetration is expected to reach xx% by 2033, reflecting a considerable increase in consumer awareness and acceptance.
Dominant Regions, Countries, or Segments in Ethical Labels Industry
North America and Europe currently dominate the Ethical Labels market, with a combined market share of xx% in 2025. Within these regions, the Organic and Vegan label segments are experiencing the most rapid growth. The food segment holds the largest share, followed by the beverage sector. Offline distribution channels currently account for the largest market share (xx%), but online channels are exhibiting faster growth due to e-commerce expansion.
- Key Drivers:
- Strong consumer demand for organic and vegan products in North America and Europe.
- Supportive government policies and regulations in certain regions.
- Increased investment in technological advancements in traceability and certification.
- Dominance Factors: Established consumer base, robust regulatory frameworks, and strong brand awareness contribute to regional dominance.
Ethical Labels Industry Product Landscape
The Ethical Labels industry showcases diverse product innovations, encompassing various label types (Halal, Organic, Vegan, Fairtrade, etc.) catering to diverse consumer preferences. These labels are integrated onto various food and beverage products. Technological advancements like QR codes and blockchain technology enhance transparency and traceability, improving consumer trust and product authenticity. Unique selling propositions often focus on specific ethical certifications and transparent supply chain information.
Key Drivers, Barriers & Challenges in Ethical Labels Industry
Key Drivers:
- Growing consumer awareness of ethical and sustainable practices.
- Increasing demand for transparency and traceability in supply chains.
- Government regulations and incentives promoting ethical sourcing.
Key Challenges:
- High certification costs can limit smaller producers' participation. (Impact: reduced market diversity and limited supply.)
- Supply chain complexities and the risk of "greenwashing" pose significant challenges. (Impact: decreased consumer trust and potential market disruptions.)
- Competition from conventional, non-ethical labels (Impact: decreased market share for ethical labels).
Emerging Opportunities in Ethical Labels Industry
- Expansion into emerging markets with growing middle classes and rising environmental awareness.
- Development of innovative labeling technologies, such as blockchain-based traceability systems.
- Customization of labels to meet diverse consumer preferences and regional needs.
Growth Accelerators in the Ethical Labels Industry Industry
Technological advancements, strategic partnerships between ethical certification bodies and major food and beverage companies, and expansion into new geographic markets are key growth catalysts. These factors are expected to accelerate the adoption of ethical labels and increase market penetration globally.
Key Players Shaping the Ethical Labels Industry Market
- PepsiCo Inc
- Ingredion Incorporated
- Koninklijke DSM N.V.
- The Kraft Heinz Company
- Kerry Group PLC
- Cargill Inc
- Go Macro LLC
- Archer-Daniels-Midland Company
- Garden of Life (Nestlé S.A)
- The Hershey Company
Notable Milestones in Ethical Labels Industry Sector
- June 2023: Kerry Group PLC introduced Biobake EgR, an enzyme solution promoting ethical egg sourcing in baking.
- September 2023: Maranello launched its ethical label, focusing on sustainability and social responsibility in promotional objects.
In-Depth Ethical Labels Industry Market Outlook
The Ethical Labels industry's future is bright, driven by the ongoing consumer shift towards ethical and sustainable consumption. The market is poised for significant growth, fueled by technological innovations, expansion into new markets, and strategic partnerships. Companies that invest in transparency, traceability, and innovative labeling technologies will be best positioned to capitalize on this burgeoning market. The long-term potential lies in creating a truly global standard for ethical labeling, fostering trust and driving sustainable practices across the food and beverage industry.
Ethical Labels Industry Segmentation
-
1. Label Type
- 1.1. Halal
- 1.2. Organic
- 1.3. Clean
- 1.4. Sustainability and Fairtrade labels
- 1.5. Animal Welfare Labels
- 1.6. Vegan Labels
- 1.7. Other Label Types
-
2. Product Type
- 2.1. Food
- 2.2. Beverages
-
3. Distribution Channel
- 3.1. Offline
- 3.2. Online
Ethical Labels Industry Segmentation By Geography
- 1. North America
- 2. Europe
- 3. Asia
- 4. Australia and New Zealand
- 5. Latin America
- 6. Middle East and Africa
Ethical Labels Industry Regional Market Share
Geographic Coverage of Ethical Labels Industry
Ethical Labels Industry REPORT HIGHLIGHTS
| Aspects | Details |
|---|---|
| Study Period | 2020-2034 |
| Base Year | 2025 |
| Estimated Year | 2026 |
| Forecast Period | 2026-2034 |
| Historical Period | 2020-2025 |
| Growth Rate | CAGR of 7.10% from 2020-2034 |
| Segmentation |
|
Table of Contents
- 1. Introduction
- 1.1. Research Scope
- 1.2. Market Segmentation
- 1.3. Research Objective
- 1.4. Definitions and Assumptions
- 2. Executive Summary
- 2.1. Market Snapshot
- 3. Market Dynamics
- 3.1. Market Drivers
- 3.2. Market Restrains
- 3.3. Market Trends
- 3.4. Market Opportunities
- 4. Market Factor Analysis
- 4.1. Porters Five Forces
- 4.1.1. Bargaining Power of Suppliers
- 4.1.2. Bargaining Power of Buyers
- 4.1.3. Threat of New Entrants
- 4.1.4. Threat of Substitutes
- 4.1.5. Competitive Rivalry
- 4.2. PESTEL analysis
- 4.3. BCG Analysis
- 4.3.1. Stars (High Growth, High Market Share)
- 4.3.2. Cash Cows (Low Growth, High Market Share)
- 4.3.3. Question Mark (High Growth, Low Market Share)
- 4.3.4. Dogs (Low Growth, Low Market Share)
- 4.4. Ansoff Matrix Analysis
- 4.5. Supply Chain Analysis
- 4.6. Regulatory Landscape
- 4.7. Current Market Potential and Opportunity Assessment (TAM–SAM–SOM Framework)
- 4.8. IMR Analyst Note
- 4.1. Porters Five Forces
- 5. Market Analysis, Insights and Forecast 2021-2033
- 5.1. Market Analysis, Insights and Forecast - by Label Type
- 5.1.1. Halal
- 5.1.2. Organic
- 5.1.3. Clean
- 5.1.4. Sustainability and Fairtrade labels
- 5.1.5. Animal Welfare Labels
- 5.1.6. Vegan Labels
- 5.1.7. Other Label Types
- 5.2. Market Analysis, Insights and Forecast - by Product Type
- 5.2.1. Food
- 5.2.2. Beverages
- 5.3. Market Analysis, Insights and Forecast - by Distribution Channel
- 5.3.1. Offline
- 5.3.2. Online
- 5.4. Market Analysis, Insights and Forecast - by Region
- 5.4.1. North America
- 5.4.2. Europe
- 5.4.3. Asia
- 5.4.4. Australia and New Zealand
- 5.4.5. Latin America
- 5.4.6. Middle East and Africa
- 5.1. Market Analysis, Insights and Forecast - by Label Type
- 6. Global Ethical Labels Industry Analysis, Insights and Forecast, 2021-2033
- 6.1. Market Analysis, Insights and Forecast - by Label Type
- 6.1.1. Halal
- 6.1.2. Organic
- 6.1.3. Clean
- 6.1.4. Sustainability and Fairtrade labels
- 6.1.5. Animal Welfare Labels
- 6.1.6. Vegan Labels
- 6.1.7. Other Label Types
- 6.2. Market Analysis, Insights and Forecast - by Product Type
- 6.2.1. Food
- 6.2.2. Beverages
- 6.3. Market Analysis, Insights and Forecast - by Distribution Channel
- 6.3.1. Offline
- 6.3.2. Online
- 6.1. Market Analysis, Insights and Forecast - by Label Type
- 7. North America Ethical Labels Industry Analysis, Insights and Forecast, 2020-2032
- 7.1. Market Analysis, Insights and Forecast - by Label Type
- 7.1.1. Halal
- 7.1.2. Organic
- 7.1.3. Clean
- 7.1.4. Sustainability and Fairtrade labels
- 7.1.5. Animal Welfare Labels
- 7.1.6. Vegan Labels
- 7.1.7. Other Label Types
- 7.2. Market Analysis, Insights and Forecast - by Product Type
- 7.2.1. Food
- 7.2.2. Beverages
- 7.3. Market Analysis, Insights and Forecast - by Distribution Channel
- 7.3.1. Offline
- 7.3.2. Online
- 7.1. Market Analysis, Insights and Forecast - by Label Type
- 8. Europe Ethical Labels Industry Analysis, Insights and Forecast, 2020-2032
- 8.1. Market Analysis, Insights and Forecast - by Label Type
- 8.1.1. Halal
- 8.1.2. Organic
- 8.1.3. Clean
- 8.1.4. Sustainability and Fairtrade labels
- 8.1.5. Animal Welfare Labels
- 8.1.6. Vegan Labels
- 8.1.7. Other Label Types
- 8.2. Market Analysis, Insights and Forecast - by Product Type
- 8.2.1. Food
- 8.2.2. Beverages
- 8.3. Market Analysis, Insights and Forecast - by Distribution Channel
- 8.3.1. Offline
- 8.3.2. Online
- 8.1. Market Analysis, Insights and Forecast - by Label Type
- 9. Asia Ethical Labels Industry Analysis, Insights and Forecast, 2020-2032
- 9.1. Market Analysis, Insights and Forecast - by Label Type
- 9.1.1. Halal
- 9.1.2. Organic
- 9.1.3. Clean
- 9.1.4. Sustainability and Fairtrade labels
- 9.1.5. Animal Welfare Labels
- 9.1.6. Vegan Labels
- 9.1.7. Other Label Types
- 9.2. Market Analysis, Insights and Forecast - by Product Type
- 9.2.1. Food
- 9.2.2. Beverages
- 9.3. Market Analysis, Insights and Forecast - by Distribution Channel
- 9.3.1. Offline
- 9.3.2. Online
- 9.1. Market Analysis, Insights and Forecast - by Label Type
- 10. Australia and New Zealand Ethical Labels Industry Analysis, Insights and Forecast, 2020-2032
- 10.1. Market Analysis, Insights and Forecast - by Label Type
- 10.1.1. Halal
- 10.1.2. Organic
- 10.1.3. Clean
- 10.1.4. Sustainability and Fairtrade labels
- 10.1.5. Animal Welfare Labels
- 10.1.6. Vegan Labels
- 10.1.7. Other Label Types
- 10.2. Market Analysis, Insights and Forecast - by Product Type
- 10.2.1. Food
- 10.2.2. Beverages
- 10.3. Market Analysis, Insights and Forecast - by Distribution Channel
- 10.3.1. Offline
- 10.3.2. Online
- 10.1. Market Analysis, Insights and Forecast - by Label Type
- 11. Latin America Ethical Labels Industry Analysis, Insights and Forecast, 2020-2032
- 11.1. Market Analysis, Insights and Forecast - by Label Type
- 11.1.1. Halal
- 11.1.2. Organic
- 11.1.3. Clean
- 11.1.4. Sustainability and Fairtrade labels
- 11.1.5. Animal Welfare Labels
- 11.1.6. Vegan Labels
- 11.1.7. Other Label Types
- 11.2. Market Analysis, Insights and Forecast - by Product Type
- 11.2.1. Food
- 11.2.2. Beverages
- 11.3. Market Analysis, Insights and Forecast - by Distribution Channel
- 11.3.1. Offline
- 11.3.2. Online
- 11.1. Market Analysis, Insights and Forecast - by Label Type
- 12. Middle East and Africa Ethical Labels Industry Analysis, Insights and Forecast, 2020-2032
- 12.1. Market Analysis, Insights and Forecast - by Label Type
- 12.1.1. Halal
- 12.1.2. Organic
- 12.1.3. Clean
- 12.1.4. Sustainability and Fairtrade labels
- 12.1.5. Animal Welfare Labels
- 12.1.6. Vegan Labels
- 12.1.7. Other Label Types
- 12.2. Market Analysis, Insights and Forecast - by Product Type
- 12.2.1. Food
- 12.2.2. Beverages
- 12.3. Market Analysis, Insights and Forecast - by Distribution Channel
- 12.3.1. Offline
- 12.3.2. Online
- 12.1. Market Analysis, Insights and Forecast - by Label Type
- 13. Competitive Analysis
- 13.1. Company Profiles
- 13.1.1 PepsiCo Inc
- 13.1.1.1. Company Overview
- 13.1.1.2. Products
- 13.1.1.3. Company Financials
- 13.1.1.4. SWOT Analysis
- 13.1.2 Ingredion Incorporated*List Not Exhaustive
- 13.1.2.1. Company Overview
- 13.1.2.2. Products
- 13.1.2.3. Company Financials
- 13.1.2.4. SWOT Analysis
- 13.1.3 Koninklijke DSM N V
- 13.1.3.1. Company Overview
- 13.1.3.2. Products
- 13.1.3.3. Company Financials
- 13.1.3.4. SWOT Analysis
- 13.1.4 The Kraft Heinz Company
- 13.1.4.1. Company Overview
- 13.1.4.2. Products
- 13.1.4.3. Company Financials
- 13.1.4.4. SWOT Analysis
- 13.1.5 Kerry Group PLC
- 13.1.5.1. Company Overview
- 13.1.5.2. Products
- 13.1.5.3. Company Financials
- 13.1.5.4. SWOT Analysis
- 13.1.6 Cargill Inc
- 13.1.6.1. Company Overview
- 13.1.6.2. Products
- 13.1.6.3. Company Financials
- 13.1.6.4. SWOT Analysis
- 13.1.7 Go Macro LLC
- 13.1.7.1. Company Overview
- 13.1.7.2. Products
- 13.1.7.3. Company Financials
- 13.1.7.4. SWOT Analysis
- 13.1.8 Archer-Daniels-Midland Company
- 13.1.8.1. Company Overview
- 13.1.8.2. Products
- 13.1.8.3. Company Financials
- 13.1.8.4. SWOT Analysis
- 13.1.9 Garden of Life (Nestlé S A )
- 13.1.9.1. Company Overview
- 13.1.9.2. Products
- 13.1.9.3. Company Financials
- 13.1.9.4. SWOT Analysis
- 13.1.10 The Hershey Company
- 13.1.10.1. Company Overview
- 13.1.10.2. Products
- 13.1.10.3. Company Financials
- 13.1.10.4. SWOT Analysis
- 13.1.1 PepsiCo Inc
- 13.2. Market Entropy
- 13.2.1 Company's Key Areas Served
- 13.2.2 Recent Developments
- 13.3. Company Market Share Analysis 2025
- 13.3.1 Top 5 Companies Market Share Analysis
- 13.3.2 Top 3 Companies Market Share Analysis
- 13.4. List of Potential Customers
- 14. Research Methodology
List of Figures
- Figure 1: Global Ethical Labels Industry Revenue Breakdown (Million, %) by Region 2025 & 2033
- Figure 2: North America Ethical Labels Industry Revenue (Million), by Label Type 2025 & 2033
- Figure 3: North America Ethical Labels Industry Revenue Share (%), by Label Type 2025 & 2033
- Figure 4: North America Ethical Labels Industry Revenue (Million), by Product Type 2025 & 2033
- Figure 5: North America Ethical Labels Industry Revenue Share (%), by Product Type 2025 & 2033
- Figure 6: North America Ethical Labels Industry Revenue (Million), by Distribution Channel 2025 & 2033
- Figure 7: North America Ethical Labels Industry Revenue Share (%), by Distribution Channel 2025 & 2033
- Figure 8: North America Ethical Labels Industry Revenue (Million), by Country 2025 & 2033
- Figure 9: North America Ethical Labels Industry Revenue Share (%), by Country 2025 & 2033
- Figure 10: Europe Ethical Labels Industry Revenue (Million), by Label Type 2025 & 2033
- Figure 11: Europe Ethical Labels Industry Revenue Share (%), by Label Type 2025 & 2033
- Figure 12: Europe Ethical Labels Industry Revenue (Million), by Product Type 2025 & 2033
- Figure 13: Europe Ethical Labels Industry Revenue Share (%), by Product Type 2025 & 2033
- Figure 14: Europe Ethical Labels Industry Revenue (Million), by Distribution Channel 2025 & 2033
- Figure 15: Europe Ethical Labels Industry Revenue Share (%), by Distribution Channel 2025 & 2033
- Figure 16: Europe Ethical Labels Industry Revenue (Million), by Country 2025 & 2033
- Figure 17: Europe Ethical Labels Industry Revenue Share (%), by Country 2025 & 2033
- Figure 18: Asia Ethical Labels Industry Revenue (Million), by Label Type 2025 & 2033
- Figure 19: Asia Ethical Labels Industry Revenue Share (%), by Label Type 2025 & 2033
- Figure 20: Asia Ethical Labels Industry Revenue (Million), by Product Type 2025 & 2033
- Figure 21: Asia Ethical Labels Industry Revenue Share (%), by Product Type 2025 & 2033
- Figure 22: Asia Ethical Labels Industry Revenue (Million), by Distribution Channel 2025 & 2033
- Figure 23: Asia Ethical Labels Industry Revenue Share (%), by Distribution Channel 2025 & 2033
- Figure 24: Asia Ethical Labels Industry Revenue (Million), by Country 2025 & 2033
- Figure 25: Asia Ethical Labels Industry Revenue Share (%), by Country 2025 & 2033
- Figure 26: Australia and New Zealand Ethical Labels Industry Revenue (Million), by Label Type 2025 & 2033
- Figure 27: Australia and New Zealand Ethical Labels Industry Revenue Share (%), by Label Type 2025 & 2033
- Figure 28: Australia and New Zealand Ethical Labels Industry Revenue (Million), by Product Type 2025 & 2033
- Figure 29: Australia and New Zealand Ethical Labels Industry Revenue Share (%), by Product Type 2025 & 2033
- Figure 30: Australia and New Zealand Ethical Labels Industry Revenue (Million), by Distribution Channel 2025 & 2033
- Figure 31: Australia and New Zealand Ethical Labels Industry Revenue Share (%), by Distribution Channel 2025 & 2033
- Figure 32: Australia and New Zealand Ethical Labels Industry Revenue (Million), by Country 2025 & 2033
- Figure 33: Australia and New Zealand Ethical Labels Industry Revenue Share (%), by Country 2025 & 2033
- Figure 34: Latin America Ethical Labels Industry Revenue (Million), by Label Type 2025 & 2033
- Figure 35: Latin America Ethical Labels Industry Revenue Share (%), by Label Type 2025 & 2033
- Figure 36: Latin America Ethical Labels Industry Revenue (Million), by Product Type 2025 & 2033
- Figure 37: Latin America Ethical Labels Industry Revenue Share (%), by Product Type 2025 & 2033
- Figure 38: Latin America Ethical Labels Industry Revenue (Million), by Distribution Channel 2025 & 2033
- Figure 39: Latin America Ethical Labels Industry Revenue Share (%), by Distribution Channel 2025 & 2033
- Figure 40: Latin America Ethical Labels Industry Revenue (Million), by Country 2025 & 2033
- Figure 41: Latin America Ethical Labels Industry Revenue Share (%), by Country 2025 & 2033
- Figure 42: Middle East and Africa Ethical Labels Industry Revenue (Million), by Label Type 2025 & 2033
- Figure 43: Middle East and Africa Ethical Labels Industry Revenue Share (%), by Label Type 2025 & 2033
- Figure 44: Middle East and Africa Ethical Labels Industry Revenue (Million), by Product Type 2025 & 2033
- Figure 45: Middle East and Africa Ethical Labels Industry Revenue Share (%), by Product Type 2025 & 2033
- Figure 46: Middle East and Africa Ethical Labels Industry Revenue (Million), by Distribution Channel 2025 & 2033
- Figure 47: Middle East and Africa Ethical Labels Industry Revenue Share (%), by Distribution Channel 2025 & 2033
- Figure 48: Middle East and Africa Ethical Labels Industry Revenue (Million), by Country 2025 & 2033
- Figure 49: Middle East and Africa Ethical Labels Industry Revenue Share (%), by Country 2025 & 2033
List of Tables
- Table 1: Global Ethical Labels Industry Revenue Million Forecast, by Label Type 2020 & 2033
- Table 2: Global Ethical Labels Industry Revenue Million Forecast, by Product Type 2020 & 2033
- Table 3: Global Ethical Labels Industry Revenue Million Forecast, by Distribution Channel 2020 & 2033
- Table 4: Global Ethical Labels Industry Revenue Million Forecast, by Region 2020 & 2033
- Table 5: Global Ethical Labels Industry Revenue Million Forecast, by Label Type 2020 & 2033
- Table 6: Global Ethical Labels Industry Revenue Million Forecast, by Product Type 2020 & 2033
- Table 7: Global Ethical Labels Industry Revenue Million Forecast, by Distribution Channel 2020 & 2033
- Table 8: Global Ethical Labels Industry Revenue Million Forecast, by Country 2020 & 2033
- Table 9: Global Ethical Labels Industry Revenue Million Forecast, by Label Type 2020 & 2033
- Table 10: Global Ethical Labels Industry Revenue Million Forecast, by Product Type 2020 & 2033
- Table 11: Global Ethical Labels Industry Revenue Million Forecast, by Distribution Channel 2020 & 2033
- Table 12: Global Ethical Labels Industry Revenue Million Forecast, by Country 2020 & 2033
- Table 13: Global Ethical Labels Industry Revenue Million Forecast, by Label Type 2020 & 2033
- Table 14: Global Ethical Labels Industry Revenue Million Forecast, by Product Type 2020 & 2033
- Table 15: Global Ethical Labels Industry Revenue Million Forecast, by Distribution Channel 2020 & 2033
- Table 16: Global Ethical Labels Industry Revenue Million Forecast, by Country 2020 & 2033
- Table 17: Global Ethical Labels Industry Revenue Million Forecast, by Label Type 2020 & 2033
- Table 18: Global Ethical Labels Industry Revenue Million Forecast, by Product Type 2020 & 2033
- Table 19: Global Ethical Labels Industry Revenue Million Forecast, by Distribution Channel 2020 & 2033
- Table 20: Global Ethical Labels Industry Revenue Million Forecast, by Country 2020 & 2033
- Table 21: Global Ethical Labels Industry Revenue Million Forecast, by Label Type 2020 & 2033
- Table 22: Global Ethical Labels Industry Revenue Million Forecast, by Product Type 2020 & 2033
- Table 23: Global Ethical Labels Industry Revenue Million Forecast, by Distribution Channel 2020 & 2033
- Table 24: Global Ethical Labels Industry Revenue Million Forecast, by Country 2020 & 2033
- Table 25: Global Ethical Labels Industry Revenue Million Forecast, by Label Type 2020 & 2033
- Table 26: Global Ethical Labels Industry Revenue Million Forecast, by Product Type 2020 & 2033
- Table 27: Global Ethical Labels Industry Revenue Million Forecast, by Distribution Channel 2020 & 2033
- Table 28: Global Ethical Labels Industry Revenue Million Forecast, by Country 2020 & 2033
Frequently Asked Questions
1. What is the projected Compound Annual Growth Rate (CAGR) of the Ethical Labels Industry?
The projected CAGR is approximately 7.10%.
2. Which companies are prominent players in the Ethical Labels Industry?
Key companies in the market include PepsiCo Inc, Ingredion Incorporated*List Not Exhaustive, Koninklijke DSM N V, The Kraft Heinz Company, Kerry Group PLC, Cargill Inc, Go Macro LLC, Archer-Daniels-Midland Company, Garden of Life (Nestlé S A ), The Hershey Company.
3. What are the main segments of the Ethical Labels Industry?
The market segments include Label Type, Product Type, Distribution Channel.
4. Can you provide details about the market size?
The market size is estimated to be USD 0.94 Million as of 2022.
5. What are some drivers contributing to market growth?
Increased Consumer Conscious toward Health and Ethical Values; Growth due to Online Retailing and CSR Activities; Reduction in Meat Consumption for Environmental Sustainability.
6. What are the notable trends driving market growth?
Beverages To Occupy Highest Market Share.
7. Are there any restraints impacting market growth?
Increasing Competition Among Players.
8. Can you provide examples of recent developments in the market?
September 2023: Maranello launched its ethical label. To obtain the Maranello on Earth label, a product must fulfill one of 4 criteria: a useful, sustainable promotional object that can be recycled and that is biodegradable, or a renewable promotional object that uses fewer materials or eco-designed materials produced using organic and recycled materials. It can also be a promotional object with a low carbon footprint, using locally-produced raw materials and green transport over short distances, or a promotional object with a socially positive contribution, environmentally ethical, using European, national, or even local know-how; using local or international, charity-based, socially responsible or fair-trade manufacture.
9. What pricing options are available for accessing the report?
Pricing options include single-user, multi-user, and enterprise licenses priced at USD 4750, USD 5250, and USD 8750 respectively.
10. Is the market size provided in terms of value or volume?
The market size is provided in terms of value, measured in Million.
11. Are there any specific market keywords associated with the report?
Yes, the market keyword associated with the report is "Ethical Labels Industry," which aids in identifying and referencing the specific market segment covered.
12. How do I determine which pricing option suits my needs best?
The pricing options vary based on user requirements and access needs. Individual users may opt for single-user licenses, while businesses requiring broader access may choose multi-user or enterprise licenses for cost-effective access to the report.
13. Are there any additional resources or data provided in the Ethical Labels Industry report?
While the report offers comprehensive insights, it's advisable to review the specific contents or supplementary materials provided to ascertain if additional resources or data are available.
14. How can I stay updated on further developments or reports in the Ethical Labels Industry?
To stay informed about further developments, trends, and reports in the Ethical Labels Industry, consider subscribing to industry newsletters, following relevant companies and organizations, or regularly checking reputable industry news sources and publications.
Methodology
Step 1 - Identification of Relevant Samples Size from Population Database


Step 2 - Approaches for Defining Global Market Size (Value, Volume* & Price*)

Note*: In applicable scenarios
Step 3 - Data Sources
Primary Research
- Web Analytics
- Survey Reports
- Research Institute
- Latest Research Reports
- Opinion Leaders
Secondary Research
- Annual Reports
- White Paper
- Latest Press Release
- Industry Association
- Paid Database
- Investor Presentations

Step 4 - Data Triangulation
Involves using different sources of information in order to increase the validity of a study
These sources are likely to be stakeholders in a program - participants, other researchers, program staff, other community members, and so on.
Then we put all data in single framework & apply various statistical tools to find out the dynamic on the market.
During the analysis stage, feedback from the stakeholder groups would be compared to determine areas of agreement as well as areas of divergence